Research Collection
Doctoral Thesis
Exploring the Genotype-Phenotype Relationship Using Big Data and Machine Learning
Author(s):
Togninalli, Matteo Publication Date:
2020-06
Permanent Link:
https://doi.org/10.3929/ethz-b-000448681
Rights / License:
In Copyright - Non-Commercial Use Permitted
This page was generated automatically upon download from the ETH Zurich Research Collection. For more information please consult the Terms of use.
diss. eth no. 26854
E X P L O R I N G T H E G E N O T Y P E - P H E N O T Y P E R E L AT I O N S H I P U S I N G B I G D ATA A N D
M A C H I N E L E A R N I N G
A dissertation submitted to attain the degree of doctor of sciencesof eth zurich
(Dr. sc. ETH Zurich)
presented by matteo togninalli Ing. Bioing. Dipl. EPF, EPFL
born on 29 August 1992 citizen of Geneva, Switzerland
accepted on the recommendation of Prof. Dr. Karsten M. Borgwardt, examiner
Prof. Dr. Edward S. Buckler, co-examiner Prof. Dr. Richard A. Neher, co-examiner Prof. Dr. William B. Noble, co-examiner
2020
Abstract
Biology is orchestrated by a myriad of beautifully complex phenomena. While sci- entists have only been able to uncover a tiny part of all existing biological mecha- nisms, they have done so by methodically relying on data, which sometimes came in enormous amounts. The advent of computational methods have therefore been instrumental for the latest discoveries in the field. Genome-Wide Association Stud- ies (GWAS), for instance, have been able to pinpoint the location of causal mutations that lead to given phenotypes. Advances in computational and statistical methods are themselves driven by newer and larger data sets. In fact, GWAS only came after the large genotyping efforts started bearing their fruit. However, this symbiotic and virtuous relationship between data and methods is sometimes hindered.
In particular, the current genomic efforts have yielded massive data sets, which in turn have led to colossal amounts of results that are highly unorganised and not always comparable. It is therefore hard to combine these rich outcomes to derive new findings and large data sets sit completely unused. Another blocking issue is that proposed computational methods oftentimes rely on simplifying assumptions.
While they have allowed certain discoveries, they are also limiting many advanced ap- proaches: machine learning methods to investigate biological phenomena sometimes suffer from oversimplifications, which in turn leads to limited prediction capabilities.
In this thesis, solutions and approaches relying on big data and machine learning are presented to tackle both these issues. A first part focuses on enabling the compa- rability of GWAS results across phenotypes and study designs. On the data side, we present a large curatorial effort to homogenise GWAS results across a multitude of phenotypes for Arabidopsis thaliana. Moreover, we present a new GWAS summary statistics imputation method to palliate to the problem of non-overlapping summary statistics, which limit the downstream applications that rely on GWAS results. A second part introduces a new family of similarity measures for complex structured objects. We propose a new class of kernels relying on optimal transport to better capture differences between structured objects, such as graphs or time series; it can be applied to many biological problems where complex interplay of signals are found.
Finally, a third part tackles the problem of complex phenotype prediction. There, we introduce a new deep learning method to predict wheat crop yield by using genotypic information and also accounting for environmental and developmental factors.
In summary, we provide several solutions to mitigate the two undesirable effects in certain situations. Our contributions unlock new ways of combining GWAS results and new directions to model complex biological phenomena: we believe that machine learning will greatly benefit the biological sciences.
La biologie est orchestrée par une myriade de phénomènes merveilleusement com- plexes. Si les scientifiques n’ont pu découvrir qu’une infime partie de tous les mé- canismes biologiques existants, ils l’ont fait en s’appuyant méthodiquement sur des données, parfois très nombreuses. L’avènement des méthodes de calcul a donc été déterminant pour les dernières découvertes dans ce domaine. Les études d’association pangénomiques (Genome-Wide Association Studies, GWAS en anglais), par exem- ple, ont permis de localiser les mutations causales qui conduisent à des phénotypes donnés. Cela étant, les progrès des méthodes de calcul et de statistique sont eux- mêmes dus à des ensembles de données plus récents et plus importants. De ce fait, les GWAS ne sont apparues qu’après que les grands efforts de génotypage aient com- mencé à porter leurs fruits. Cependant, cette relation symbiotique et vertueuse entre les données et les méthodes est parfois entravée.
En particulier, les efforts de génomique récents ont produit des ensembles de don- nées massifs, qui ont à leur tour conduit à des quantités colossales de résultats très peu organisés et pas toujours comparables. Il est donc difficile de combiner ces riches résultats pour en tirer de nouvelles conclusions et de grands ensembles de données restent totalement inutilisés. Autre problème bloquant : les méthodes de calcul proposées reposent souvent sur des hypothèses simplificatrices. Si elles ont permis certaines découvertes, elles limitent également de nombreuses approches avancées : les méthodes d’apprentissage machine pour étudier les phénomènes biologiques souf- frent parfois de simplifications excessives, ce qui conduit à des capacités de prédiction limitées.
Dans cette thèse, des solutions et des approches s’appuyant sur les grandes don- nées et l’apprentissage machine sont présentées pour pallier ces deux problèmes. Une première partie s’attache à permettre la comparabilité des résultats des GWAS entre les phénotypes et les plans d’étude différents. Du côté des données, nous présentons un grand effort de curation pour homogénéiser les résultats des GWAS à travers une multitude de phénotypes pour l’Arabidopsis thaliana. En outre, nous présentons une nouvelle méthode d’imputation des statistiques sommaires de GWAS pour remédier au problème des statistiques sommaires sans chevauchement, qui limitent les appli- cations en aval s’appuyant sur les résultats des GWAS. Une deuxième partie présente une nouvelle famille de mesures de similarité pour les objets structurés complexes.
Nous proposons une nouvelle classe de kernels reposant sur le transport optimal pour mieux saisir les différences entre les objets structurés, tels que les graphes ou les séries temporelles ; elle peut être appliquée à de nombreux problèmes biologiques où l’on trouve une interaction complexe de signaux. Enfin, une troisième partie aborde le problème de la prédiction de phénotypes complexes. Nous y présentons une nouvelle méthode d’apprentissage profond pour prédire le rendement des cultures de blé en utilisant les informations génotypiques et en tenant compte également des facteurs environnementaux et de développement.
En résumé, nous proposons plusieurs solutions pour atténuer les deux effets in- désirables dans certaines situations. Nos contributions ouvrent de nouvelles voies
pour combiner les résultats des GWAS et de nouvelles directions pour modéliser des phénomènes biologiques complexes : l’apprentissage machine est donc et continuera à être bénéfique pour les sciences biologiques.
First and foremost, I would like to deeply thank my advisor Prof. Dr. Karsten Borgwardt for his continuous supervision and advice during my doctoral studies. He constantly provided me with the necessary resources to develop my skills, generously funded the attendance to the many conferences of the field, set up exciting research collaborations and put me in front of the relevant challenges to become a machine learning researcher. Moreover, I would also like to acknowledge his strong support in my entrepreneurial side endeavours.
I would then like to extend my gratitude to Prof. Dr. Edward Buckler, Prof.
Dr. Richard Neher, and Prof. Dr. William Noble for agreeing to be part of my thesis examination committee as well as Prof. Dr. Caroline Uhler for chairing the examination.
It is hard to put into words the gratitude I have for the co-authors of the pub- lications I worked on. I am extremely thankful to Dr. Bastian Rieck, whose stoic guidance in most of the projects I had the chance to work on was paramount, both for the ones included in this thesis and the ones that were not. He is the best mentor one could hope for and I will cherish his advice and friendship for life. I would like to thank Prof. Dr. Dominik Grimm, who guided me in the very first projects I worked on as a PhD student. His experience, guidance and organization allowed me to be on the fast-track of research since the very first day. Furthermore, I am profoundly grateful to Dr. Damián Roqueiro, whose relentless help and support directly and in- directly enabled many of the contributions in this thesis. I with to thank Dr. Felipe Llinares–López, who guided many of my modeling choices with his extensive machine learning knowledge. I am also enormously indebted to my colleagues and friends Christian Bock and Elisabetta Ghisu, with whom I shared principal authorship on several publications. The fascinating scientific discussions we had were pleasantly alternating with good times that turned into unforgettable memories. Moreover, I would also like to extend my gratitude to Max Horn, whose great software develop- ment experience and computational biology know-how combined with our respective desks’ proximity nudged many of my projects in the better direction. I also wish to thank Michael Moor for the insightful medical and thought-provoking discussions, I am truly indebted to him for a more rationalist way of seeing the world. Finally, I am also thankful to Thomas Gumbsch, Anja Gumpinger, Dr. Katharina Heinrich, Dr. Catherine Jutzeler, and Caroline Weis who have been wonderful colleagues and friends.
Throughout my doctoral studies, I had the chance to discuss and exchange with many other talented scientists. In that regard, I am truly thankful to all the present and past members of Prof. Karsten Borgwardt’s lab in Basel, Dr. Lukas Folkman, Dr. Dean Bodenham, Dr. Xiao He, Dr. Daisuke Yoneoka, Dr. Laetitia Papaxanthos, Dr. Katharina Heinrich, Giulia Muzio, and Leslie O’Bray. Similarly, many people at the Biosystems Science and Engineering department contributed in making my PhD a splendid experience. I would therefore like to extend a warm thank you to Olivier Belli, Arthur Dondi, and Mariia Cherepkova. Additionally, I had to chance to work
with the people from the PhD Students and Postdoc Association of the department (VMB) and I would like to thank all its past and present members for the important role they play for the department and its scientific staff. Lastly, I am truly grateful to all the department’s staff and in particular to Cindy Malnasi, for the continuous administrative support.
During my PhD experience, I had fantastic opportunities to collaborate with many researchers from other fields and horizons. I am therefore grateful to Ümit Seren and Prof. Dr. Arthur Korte, for the work on AraPheno and AraGWAS, to Dr. Jakob Nilsson for the rich collaboration on clinical transplant data, and to Prof. Dr. Jesse Poland and Dr. Xu Wang for the exciting work on wheat yield prediction.
Finally, I am extremely thankful to all my friends for all the marvellous moments outside my doctoral studies. I also wish to thank my family: my parents Alexandra and Danilo and my brothers David and Oscar for their understanding and kindness.
And last but certainly not least, I am forever indebted to Aryane, for her selfless encouragement and unconditional love throughout these amazing yet very busy years.
Contents
I Introduction 1
1 Introduction 3
1.1 Instilling coherence across large biological data set . . . 4
1.1.1 Genome-Wide Association Studies . . . 4
1.1.2 Organising and ensuring comparability of GWAS results . . . 6
1.2 Embracing complexity in biological phenomena . . . 6
1.2.1 Phenotype prediction . . . 7
1.2.2 Crop yield prediction for crop breeding . . . 8
1.3 Organisation and contributions of this thesis . . . 9
1.3.1 Comparable GWAS for Arabidopsis thaliana . . . 9
1.3.2 Imputation of GWAS summary statistics . . . 10
1.3.3 Wasserstein kernels for structured objects . . . 10
1.3.4 Crop yield prediction using deep learning . . . 11
II Enabling comparable GWAS 13 2 Comparable GWAS for A. thaliana 15 2.1 Introduction . . . 15
2.2 AraPheno . . . 17
2.2.1 Content and features . . . 17
2.2.2 RNA-Seq data . . . 21
2.2.3 Architecture and implementation . . . 21
2.3 AraGWAS Catalog . . . 22
2.3.1 Content and features . . . 22
2.3.2 Standardised GWAS pipeline . . . 28
2.3.3 Architecture and implementation . . . 29
2.3.4 Concluding remarks . . . 29
3 Imputation of GWAS Summary Statistics 31 3.1 Introduction . . . 32
3.2 Summary Statistics Imputation as Gaussian Process Regression . . . 34
3.2.1 A Gaussian process regression primer . . . 34
3.2.2 Summary statistics imputation . . . 36
3.2.3 Automatic Relevance Determination . . . 37
3.2.4 Implementation . . . 38
3.3 Experimental results . . . 40
3.3.1 Data sets . . . 40
3.3.2 Experimental design . . . 42
3.3.3 COPDGene . . . 43
3.3.4 Insomnia complaints . . . 53
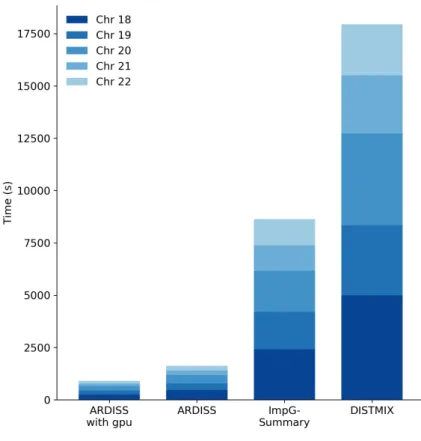
3.3.5 Speed performance . . . 54
3.3.6 Concluding remarks . . . 55
III Wasserstein kernels 59 4 Wasserstein Kernels for Structured Objects 61 4.1 Introduction . . . 62
4.1.1 R-Convolution kernels . . . 62
4.1.2 Optimal transport . . . 63
4.2 Wasserstein Graph Kernels . . . 66
4.2.1 Graph kernels . . . 66
4.2.2 Wasserstein distance on graphs . . . 67
4.2.3 From distance to graph kernels: theoretical considerations . . 70
4.2.4 Experimental evaluation . . . 78
4.3 Wasserstein Time series Kernels . . . 86
4.3.1 Time series kernels . . . 86
4.3.2 A subsequence-based Wasserstein kernel . . . 88
4.3.3 Theoretical considerations . . . 92
4.3.4 Experimental evaluation . . . 93
IV Crop yield prediction 101 5 Deep learning for crop yield prediction 103 5.1 Introduction . . . 104
5.1.1 Crop yield prediction . . . 105
5.2 Multiple Instance Learning for phenotype prediction . . . 107
5.2.1 Background . . . 107
5.2.2 Data fusion with attention-based MIL . . . 110
5.2.3 Implementation . . . 112
5.3 Experimental results . . . 112
5.3.1 Data set . . . 112
5.3.2 Phenotype prediction . . . 114
5.3.3 Feature importance analysis . . . 120
5.3.4 Concluding remarks . . . 125
6 Conclusions and Outlook 127
Acronyms 133
Contents
List of Figures 135
List of Tables 141
Bibliography 143
Part I
Introduction
1 Introduction
In which the motivation behind this doctoral thesis is laid.
Since its inception, biology has been a field that heavily relies on data. From the first inheritance experiments performed by Gregor Mendel on more than 28,000 plants [157] to the large-scale data sets analysed by Ronald Fisher at the Rotham- sted Experimental Station [76], large biological evidence has always driven method- ological and theoretical advances. More recently, the early successes of the genome sequencing initiatives of the beginning of the new millennium motivated the devel- opment of new statistical tools to identify links between genotypes and phenotypes:
shortly thereafter came Genome-Wide Association Studies (GWAS)[167]. Similarly, the advent of Next Generation Sequencing techniques have made the availability of sequenced genotypes explode, resulting in studies with an ever-increasing number of genetic variants and participants. The high-dimensional nature of the resulting data sets and the interest in exploring higher-order interaction effects between genetic variants inspired the creation of significant pattern mining[146].
It should therefore come as no surprise that the sheer amount of biological data generated nowadays is seen asthe key element to unravel life sciences mysteries and incite methodological developments. During the last decade, many have put forward the promises of precision medicine, which, thanks to the abundance of molecular data sets, would enable personalised disease prevention and treatment [9]. Nevertheless, our ability to make sense of large biological data sets is currently hindered in two main ways.
Firstly, the ever-increasing amount of data that is being generated in the biolog- ical and medical fields is generally unorganised. It is therefore hard to efficiently combine and cross-reference findings across studies. This is particularly problematic because the data collection efforts continue without any sign of slowdown. Hence, it is necessary to provide solutions to organise these data and to make them coherent and comparable.
Secondly, the current approaches to answer biological questions rely on simplify- ing assumptions and, by consequence, are oftentimes inapt to capture and model all involved mechanisms. Since biological phenomena are highly complex, simple approaches to elucidate them are limited to scenarios where everything is controlled and understood. However, to grasp realistic problems and answer practical questions, computational methods need to get rid of simplifications and embrace complexity.
With this thesis, our goal is to provide pointers on how to best tackle these two limitations with machine learning and show what practical benefits can result from considering them.
1.1 Instilling coherence across large biological data set
The ease of genotype collection mentioned above led to tens of thousands of data sets with millions of biological measurements for thousands of patients [236]. For each genotyped individual, information about structural variations (SV), i.e. differences between an individual’s genotype and a reference genotype, could be pooled. These include Single Nucleotide Polymorphisms (SNPs), for which single bases are differ- ent, Insertions and Deletions (InDels), where individuals present additional short sequences or miss some, and Copy Number Variations (CNVs), which indicate dif- ferences in the number of copies of single genes. The idea of linking the observed structural variations to the observed variations in phenotypes to better understand how the first potentially causes the second came very naturally. The best example of such analysis is given by the previously mentioned GWAS.
1.1.1 Genome-Wide Association Studies
The goal of GWAS is to identify regions in the genome that could be causal for a specific phenotype. Here, phenotype is meant in the most general sense of the term and can take the form of any observable characteristic of an organism, including binary phenotypes (e.g. diabetic patients versus healthy controls), categorical phe- notypes (e.g. patient groups with different responses to a treatment), or continuous phenotypes (e.g. human height). Insights gathered with GWAS therefore have mul- tiple applications: from better disease understanding[154],to personalised treatment plans [9] or to optimise crops for better yield in plant research[53].
More practically, a GWAS consists in collecting the genotypes and phenotypes of a large individual cohorts. Then, association tests between each SNP and the phenotype are run to identify highly associated variations. The association signal can be measured in several ways. For binary phenotypes, a GWAS can rely on simple two sample tests: for each variant, a contingency table counting the different variants for each of the phenotype classes is obtained and used to test for association using a discrete test statistics like aχ2 test or a Fisher’s exact test. Alternatively, linear models are a popular way to test individual variants’ association with a phenotype.
They rely on the assumption that the phenotypesy can be seen as a linear additive combination of genotype values x: y = β01 +β1x+, where y and x are the vector of phenotypes and genotypes of the cohort individuals respectively, β0 ∈ R is the offset, β1 the genotype effect, 1 is a vector containing ones, and are the residuals following a known distribution. The parameters can then be estimated using a maximum likelihood estimator and the deviation of β1 from 0 indicates the
1.1 Instilling coherence across large biological data set
effect size for that given variant, it can then be used in a statistical test to assess if its deviation from0is statistically significant. Linear models come in various shapes:
linear regression and linear mixed models can be used for continuous phenotypes, logistic regression can be used for binary and categorical phenotypes.
The associations are then summarised with p-values that indicate the degree of the association between the given SNP and the phenotype: under a certain computed threshold, these associations are deemedsignificant, meaning that, statistically, they are very unlikely to result from random effects. Given the high dimensional nature of genotype data and the relatedness of all genomes, certain steps need to be taken to avoid false positives. First, population structure correction can be performed:
when related individuals are present in the same study, the combined signal of their similar genotypes will augment and false positive associations can be found. The genomic inflation factor[64]can be used to assess the degree of population structure.
If this value deviates from 1, correcting for population structure is necessary. This can be achieved by using the principal components of a genetic similarity matrix as covariates or by adapting the significance threshold using the genomic inflation factor mentioned above [63, 189]. Secondly, SNPs need to be filtered to ensure the lowest possible number of false positive results. This is usually performed using the Hardy–Weinberg equilibrium[250],to discard SNPs that are the results of sam- pling or genotyping errors. SNPs can also be filtered by using their minor allele frequency (MAF); rare variants (i.e. SNPs with MAF below 0.05 or 0.01) need to be removed because standard GWAS are underpowered to uncover associations re- lated to theses SNPs[6]. Finally, conducting so many univariate tests (we sometimes speak about millions of variants) will necessarily result in spurious associations, this is often referred to as the problem ofmultiple hypothesis testing. To avoid this issue, one can control the Family-Wise Error Rate (FWER) by applying a Bonferroni cor- rection[28](i.e. dividing the significance threshold by the number of conducted tests to obtain a new significance threshold). Alternatively, one can control the False Dis- covery Rate (FDR) by using the Benjamini–Hochberg procedure[20], this approach is less conservative but avoids a larger number of false negatives. Therefore, the number of considered SNPs in a GWAS can vary considerably due to several quality control procedures performed before and during the study.
Since they are usually conducted on a subset of all mutations, GWAS seldom identify causal SNPs; instead, high association signals are often attributed to SNPs that are inlinkage disequilibrium with causal variations, meaning that they are both located on highly heritable portions of the genotype. Nonetheless, GWAS have enabled the discovery of thousands of genetic risk loci for hundreds of diseases in humans and continue to be a useful tool in identifying relevant portions among the 3billion base pairs of the human genome[154].
In other organisms too, GWAS have elucidated some genotype-phenotype relation- ships: significant associations have been reported for many traits in several organisms such as rice[266],tomatoes[142], fruit flies[156],mice[125], andA. thaliana [10].
The rapid increase of genotyped individuals led to an explosion of GWAS results with millions of reported association scores. Navigating and leveraging this wealth of
results is therefore not trivial. While drawing conclusions at the individual phenotype level is relatively easy given a GWAS, combining insights across phenotypes becomes drastically challenging. Not only due to the high complexity of the genome and interplay of its structural variations with the environment (see the next section on complex biological phenomena for more details on this), but also given the high variability and disparateness of the reported results.
1.1.2 Organising and ensuring comparability of GWAS results First, GWAS results - also referred to as summary statistics, i.e. association scores under the form of p-values, are not comparable across studies because of the design of the experiments itself. As briefly hinted at above, a p-value is only useful if used in combination with the significance threshold of the study. Yet, the significance threshold of a GWAS heavily depends on the design of the study. For instance, the number of evaluated SNPs has an impact on the correction used for the significance threshold. Given that most studies are performed on diverse sets of participants and on different sets of variants, the direct comparison of both p-values and significant association indication becomes meaningless.
Moreover, even when the studies are of comparable sizes and setups, the obtained summary statistics cannot be combined because of their highly disparate nature.
Data sets obtained from studies that were performed with different genotyping plat- forms or filtering criteria result in summary statistics for sets of SNPs that are not overlapping. Therefore, only a considerably smaller subset of SNPs will have summary statistics for all the considered studies. This severely limits the types of analyses that can be conducted because of the incomplete overlap of the genetic variants and their associations scores.
Hence, it is obvious that, in order to develop the next generation of algorithms that rely on association statistics, a curation effort of these latter is needed. To this end, we explore two ways of palliating to the above-mentioned issues. In Chapter 2 we establish online resources that enable a comparative analysis between GWAS results for the model organism Arabidopsis thaliana by re-calculating all GWAS across a large set of phenotypes using a best-practice pipeline, an updated version of the genotype data, and permutation-based statistical significance threshold to account for the phenotypic distributions. The outcome is a catalog of standardised GWAS results for allA. thaliana phenotypes that can easily promote comparative analyses across different phenotypes. In Chapter 3 we introduce Ardiss, an accurate, fast and effective method to impute missing association summary statistics in mixed- ethnicity cohorts. The method can be used to ensure a complete overlap of the SNPs of interest when dealing with results from multiple GWAS.
1.2 Embracing complexity in biological phenomena
Having coherent and organised data sets is key to answer questions about biological phenomena. But biological phenomena are highly complex, and existing methods
1.2 Embracing complexity in biological phenomena
can fail at taking this into account. For example, GWAS are excellent at identifying individual variants’ associations with a given phenotype. However, they could never capture higher-orderinteractions between structural variants in relation with a phe- notype. Several approaches have been put forward to overcome these limitations.
Significant pattern mining is a prime example [146]: by leveraging statistical tricks, this family of methods enable the automatic identification of larger genomic regions associated with a given phenotype. Similarly, Azencott et al. [11] incorporated infor- mation about the underlying biological pathways that connect seemingly unrelated SNPs using notions from graph theory resulting in a higher power in detecting causal SNPs.
This second example showcases how important complex objects are in biology. We often consider the genome as a single string, while forgetting that it translates in an elaborate interplay of signals that are distributed through time and space. Struc- tured objects such as time series and graphs can be found everywhere in biological mechanisms. Being able to handle said data structures is therefore paramount to the development of reliable algorithms for the life sciences. That is why, in Chapter 4 we introduce a new family of similarity measures, or kernels, for graphs and time series that are able to better distinguish structured objects as compared to existing measures. In turn, this can be applied to a variety of machine learning methods that rely on kernels for prediction tasks.
1.2.1 Phenotype prediction
The limitation of current approaches in dealing with complex biological phenomena is also well exemplified with phenotype prediction methods. As seen above, one of the ultimate goals of genomics is to be able to leverage genetic information to bet- ter understand phenotypic variations and guide decision making. In practice, this is represented by tasks such as phenotype prediction, which has been a problem of interest since the beginnings of genomics [219]. Being able to identify individuals with a high genetic risk for specific conditions has immense potential benefits for public health[202]. Similarly, being able to identify high-potential crops that max- imise yield while ensuring resistance and resilience is critical for food security [53, 78]. Throughout the many attempts that were made, it quickly became obvious that genotype alone cannot be used to accurately predict all phenotypic differences. This can be partly imputed to the problem of “missing heritability” [162]: even on large cohorts, the variability of individual genetic variations cannot explain all the vari- ability of the heritable portion of observed phenotypes. While several hypotheses have been proposed to explain missing heritability, the problem is yet to be fully solved. A concrete example can be found in the highly heritable trait human height.
Human height is reported to have an approximate empirical heritability of80%but the50 most associated loci together only account for5%of the observed phenotypic variance[162,242]. Several hypotheses around the causes of missing heritability were put forth and some were validated, but part of the heritability still remains unex- plained. First, initial GWAS were only focusing on highly associated SNPs. When
consideringall common SNP variants, the explained variance increases considerably.
For human height, accounting for all common SNP variants can explain between 45% to 55% of the observed phenotypic variance [136, 259]. Hence, accounting for all variants increases the explainability thanks to the weak effects of many variants.
Another supposition is that genetic variants’ effects are not only additive but also present an interactive nature: specific combinations of variants are causal for given phenotypes [163]. Finally, epigenetics is also seen as a potential source of heritabil- ity[85]. But most importantly, a large portion of the phenotypic variations is caused by environmental and developmental factors, which simply cannot be explained by genomic variability [99].
Therefore, external factors need to be accounted for in order to achieve acceptable phenotype prediction performance. Combining genotypic data with environmental data is all but straightforward. Most statistical genetics studies that have a link with phenotype prediction either try to control the environmental conditions so as not to have to account for them [24] or design experiments to minimise the impact of the environment [188]. Other attempts to incorporate environmental variables in predictive models are usually performed by including covariates that are linked to certain environmental factors. For example, in humans this can be done by including covariates such as sex and age[122]: risk predictors for coronary artery disease reach an area under the receiver operating characteristic (ROC) curve of0.81when includ- ing sex and age, whereas the performance only reaches0.64 when solely considering genetic variants [121].
While these approaches showed some promising results, the simple linear com- bination of genotypic and environmental information is certainly not sufficient to capture interactions between an individual’s genome and the environment in which they evolve. Therefore, models able to capture higher-order interactions between genotype and environment are necessary. Plant breeding offers excellent opportuni- ties in this direction and has a rich literature around phenotype prediction.
1.2.2 Crop yield prediction for crop breeding
Food security is a critical problem that recently attracted considerable interest due to the recent global population growth and important environmental changes, as op- timised crops are not sufficiently resilient to certain climatic conditions[53,78]. Since the early 1980s, molecular markers have been used in plant breeding programs to im- prove quantitative traits with stark economic and social importance [23]. As soon as SNP data on various crops became available, they were extensively used to identify quantitative trait loci (QTLs), genomic areas highly associated with a phenotype of interest. Individuals presenting relevant QTLs were then crossed in phenotypic selection assays using marker-assisted selection [53]. Nevertheless, approaches based on QTLs alone failed to yield successful crops partly due to the problem of missing heritability and to the lack of consideration for interactions between QTLs and en- vironment [22]. From these limitations stemmed the field of genomic selection (GS),
1.3 Organisation and contributions of this thesis
which relies onall available genetic markers for phenotype prediction to select crops in a test population that has been genotyped but not phenotyped.
The advantage of genomic selection is to provide indications on a new crop’s quan- titative trait without the need for phenotyping it. Genomic selection therefore short- ens the breeding cycle by reducing the time necessary to phenotype the evaluated crossings[265]. Due to the pronounced interest for good phenotype predictors, many advances in the statistical methods used were made. Similar methods than the one used for phenotype prediction in human were adopted and extended. The ridge- regression model used by Yang et al. [259] for height prediction is one of the most widespread model and was extended to account for interactions between genotypes and environment [40]. While initial contributions modeled the environment as an additional linear component in the regression models, newer approaches attempt to truly capture interactions [149], that were then extended to non-linear interactions using kernel methods[54].
More recently, advances in high-throughput phenotyping unlocked new possibilities to capture interactions between genotype and phenotype [172]. In Chapter 5, we present a way do so on a crop yield prediction problem, leveraging a multitude of different environmental-related data sources and combining them with genotypic information. Moreover, we show that using more complex deep learning models that are not based on simplifying assumptions needs not to be made at the detriment of interpretability: we manage to quantify the contributions of individual data sources in the final prediction.
This thesis is therefore a collection of solutions and methods to deal with the issues of coherence and complexity in contemporary biological data sets.
1.3 Organisation and contributions of this thesis
This thesis is organised in four chapters that comprise the main contributions in terms of new resources and methods to better elucidate genotype-phenotype relationships in simple and more structured settings. Each chapter is self contained, meaning that it includes all relevant background for the understanding of the identified problems and the proposed solutions. Chapters are based on published and unpublished work and the detailed contributions are presented below. Chapter 6 contains the conclusions and an outlook towards the open problems along the various directions explored in the thesis.
1.3.1 Comparable GWAS for Arabidopsis thaliana
Chapter 2 introduces a set of online resources that organise phenotype and GWAS results forArabidopsis thalianaand prepare them for the next generation of analyses.
The chapter is based on the following publications:
- M. Togninalli, Ü. Seren, D. Meng, J. Fitz, M. Nordborg, D. Weigel, K. Borgwardt, A. Ko- rte, and D. G. Grimm. “The AraGWAS Catalog: A curated and standardized Arabidopsis thaliana GWAS catalog”. Nucleic Acids Research 46:D1, 2018
- M. Togninalli, Ü. Seren, J. A. Freudenthal, J. G. Monroe, D. Meng, M. Nordborg, D.
Weigel, K. Borgwardt, A. Korte, and D. G. Grimm. “AraPheno and the AraGWAS Cat- alog 2020: a major database update including RNA-Seq and knockout mutation data for Arabidopsis thaliana”. Nucleic Acids Research 48:D1, 2020
For both studies, Matteo Togninalli, Ümit Seren, Karsten Borgwardt, Arthur Korte, and Dominik Grimm conceived the platforms and studies. Matteo Togninalli and Ümit Seren developed and maintained the online platforms. Arthur Korte and Do- minik Grimm performed the Genome-Wide Association Study experiments. Magnus Nordborg hosted the resources. Magnus Nordborg and Detlef Weigel provided initial data for the resources. J. Grey Monroe analysed the gene knockout data. Mat- teo Togninalli, Ümit Seren, Karsten Borgwardt, Arthur Korte, and Dominik Grimm wrote the publications with contributions from all authors.
1.3.2 Imputation of GWAS summary statistics
Chapter 3 introducesArdiss, an association summary statistics imputation method that works efficiently in mixed-ethnicity cohorts without the need to rely on privacy- sensitive covariates. The chapter is based on the following publication:
- M. Togninalli, D. Roqueiro, I. COPDGene, and K. M. Borgwardt. “Accurate and adaptive imputation of summary statistics in mixed-ethnicity cohorts”. Bioinformatics 34:17, 2018
Matteo Togninalli, Damiàn Roqueiro, and Karsten Borgwardt designed the study.
Matteo Togninalli and Damiàn Roqueiro performed the comparison experiments.
The COPDGene Investigators provided access to genotypes of patients. Matteo Togninalli, Damiàn Roqueiro, and Karsten Borgwardt wrote the manuscript.
1.3.3 Wasserstein kernels for structured objects
Chapter 4 presents a new class of kernels for structured data based on optimal transport theory. The chapter is based on the following publications:
- M. Togninalli, E. Ghisu, F. Llinares-López, B. Rieck, and K. Borgwardt. “Wasserstein Weisfeiler-Lehman Graph Kernels”. In: Advances in Neural Information Processing Sys- tems. 2019
- C. Bock, M. Togninalli, E. Ghisu, T. Gumbsch, B. Rieck, and K. Borgwardt. “A Wasser- stein Subsequence Kernel for Time Series”. In: 19th IEEE International Conference on Data Mining (ICDM 2019). 2019
For the first study, Matteo Togninalli, Elisabetta Ghisu, Bastian Rieck, and Karsten Borgwardt conceived the study. Matteo Togninalli, Elisabetta Ghisu, and Bastian
1.3 Organisation and contributions of this thesis
Rieck implemented the method and performed the experiments. Matteo Togn- inalli and Bastian Rieck derived the theoretical considerations regarding positive definiteness of the kernels. Felipe Llinares–Lopez gave inputs on the experimental results. Matteo Togninalli, Elisabetta Ghisu, Bastian Rieck, and Karsten Borg- wardt wrote the manuscript with inputs from Felipe Llinares–Lopez. For the second study, Karsten Borgwardt highlighted the meaninglessness of certain subsequence time series kernels. Christian Bock, Matteo Togninalli, Bastian Rieck and Karsten Borgwardt designed the study. Christian Bock, Matteo Togninalli, Elisabetta Ghisu, Thomas Gumbsch, and Bastian Rieck performed the experiments. Finally, all au- thors contributed to the writing of the manuscript.
1.3.4 Crop yield prediction using deep learning
Chapter 5 introduces a new crop yield prediction method that efficiently combines genotype information with multiple data sources related to the investigated plants.
The chapter is based on the unpublished work:
- M. Togninalli, X. Wang, J. Poland, and K. Borgwardt. “Deep learning enables accurate grain yield prediction using image and genotype information”. Unpublished Manuscript.
2020
Matteo Togninalli, Xu Wang, Jesse Poland, and Karsten Borgwardt imagined the study. Xu Wang coordinated the data acquisition and processing. Matteo Togninalli implemented the methods and computational experiments. Xu Wang and Jesse Poland gave field-informed inputs on the proposed approaches. Matteo Togninalli drafted the manuscript with inputs from the other authors.
Part II
Enabling comparable GWAS
2 Comparable GWAS for A. thaliana
In which online resources grouping genotype, phenotype, and association scores for Ara- bidopsis thaliana are presented.
The ease of collection of abundant experimental data from model organisms such asArabidopsis thaliana have made them the ideal subjects of large genetic research efforts. However, despite the large interest of the community for understanding the link between genotypes and phenotypes of A. thaliana, it remains hard to compare results across studies, even for such a well-documented and standardised plant.
In this chapter, we present AraPheno[212,232], a database ofA. thaliana pheno- types enriched with RNA-Seq data and the AraGWAS Catalog[232,233], a resource that was developed to allow researchers to easily access and browse standardised GWAS results. AraPheno was initially developed by collaborators [212] and the contributions of the author of this thesis are centered around extensions thereof.
However, for sake of completeness, we here report on the entirety of the project. The presented content is partly based on the following publications:
- M. Togninalli, Ü. Seren, D. Meng, J. Fitz, M. Nordborg, D. Weigel, K. Borgwardt, A. Ko- rte, and D. G. Grimm. “The AraGWAS Catalog: A curated and standardized Arabidopsis thaliana GWAS catalog”. Nucleic Acids Research 46:D1, 2018
- M. Togninalli, Ü. Seren, J. A. Freudenthal, J. G. Monroe, D. Meng, M. Nordborg, D.
Weigel, K. Borgwardt, A. Korte, and D. G. Grimm. “AraPheno and the AraGWAS Cat- alog 2020: a major database update including RNA-Seq and knockout mutation data for Arabidopsis thaliana”. Nucleic acids research 48:D1, 2020
The chapter is organised as follows. Section 2.1 explains the motivations for pro- viding these resources to the community. Section 2.2 presents the features and par- ticularities of AraPheno. Section 2.3 details the characteristics of AraGWAS and of the standardised GWAS pipeline that was developped for the effort.
2.1 Introduction
Arabidopsis thaliana is a dicotyledonous species and a member of the Brassicaceae or mustard family. It has a rapid life cycle – with only 6 weeks from germination to mature seeds, is easy to cultivate in a controlled environment and limited space, and produces large self progeny. Additionally, its genome, which was the first plant genome to be sequenced, is relatively small (114.5–125 Mb in total). All-in-all, these many advantages have madeA. thaliana the reference model organism in plant
biology[46,169,197,226]. Moreover,Arabidopsis thaliana is a naturally inbred plant, meaning that it can and often does self-pollinate, resulting in lines with completely homozygous genomes. This is a highly desirable property as it allows the study of genetically identical plants and several of their phenotypes under different and controlled environmental conditions[10],which represents a colossal advantage when studying complex trait variation in general and interactions between genotype and environment in particular.
In fact, over the past years, large efforts were carried to identify causative genetic variation for a wide variety of different phenotypes. Genome-wide association studies (GWAS) became the reference tool to link genetic variation in a population with the observed phenotypic differences, and after being pioneered in humans, were rapidly adopted and adapted by researchers in the broader biological sciences [94]. GWAS correlate genomic markers with phenotypic differences and report a likelihood of the association under the form of a p-value. On the one hand, it is desirable to have a high marker density to obtain meaningful results: inA. thaliana, GWAS have been regularly performed using214,000markers relying on hybridization technology[107].
On the other hand, the statistical power of the analysis increases with the number of samples in the study, hence the interest for increasingly large populations in humans, where, additionally, control over the environmental variables is virtually nonexistent.
Having identical samples with homozygous genomes as it is the case for Arabidopsis thaliana is therefore very helpful, as it allows for easily reproducible results and enables the re-analysis of collected results once that udpated versions of the genotypic data for the available lines become available.
Therefore, the homorozygous nature of Arabidopsis thaliana combined with the availability of high-quality full genome genotype for more than a thousand organisms (available here) provide a rare platform for reproducible research [4] and make A.
thaliana a prime model organism for genetic research beyond plants[128].
Nevertheless, while these resources enabled the development and benchmarking of tools in the machine learning and data mining communities[147,176,223],the lack of centralised information related to phenotypes and GWAS results made it difficult for researchers to (i) conveniently access phenotypic data sets; and (ii) easily compare GWAS results across different phenotypes.
In the next sections, we introduce and detail two online resources for Arabidop- sis thaliana that centralise and standardise information on phenotypes and GWAS results. AraPheno is a centralised repository of phenotypic information from thou- sands of A. thaliana lines and the AraGWAS Catalog is a catalog of standardised GWAS results computed using the phenotypes of AraPheno. These resources are of great relevance for both the A. thaliana and the data mining community as they represent a source of new biological insights as well as one of untapped data for the development and assessment of machine learning methods.
2.2 AraPheno
2.2 AraPheno
AraPheno (arapheno.1001genomes.org) is a database for A. thaliana phenotypes.
It was originally created to organise and centralise all the published phenotypes reported by the research community, and its primary purpose is therefore to provide information about the collected phenotypes and the studies they were obtained from.
2.2.1 Content and features
AraPheno is accessible online at arapheno.1001genomes.orgthrough a user-friendly interface. Phenotypes are grouped by studies, where a study is a collection of multiple phenotypes obtained for a given publication or research effort. Users can therefore select which elements to inspect from a list of phenotypes or a list of studies. However, considering the ever growing number of phenotypes, a fulltext search functionality is available to search for specific phenotypes, studies or other terms. To help users navigate the large diversity of AraPheno data, all phenotypes are linked to plant trait ontologies (bioportal.bioontology.org/ontologies/PTO), therefore relying on a predetermined vocabulary to describe observed traits in A. thaliana and allowing users to group phenotypes. Every phenotype reported in AraPheno was also used in a standardised GWAS pipeline and the results of the study are reported in the AraGWAS Catalog, see Section 2.3 for more details.
Moreover, AraPheno also provides access to a comprehensive list of available A. thaliana accessions that were collected in the wild (ara- pheno.1001genomes.org/accessions/). The list regroups meta-information (e.g. geo- graphic positions) as well as information related to the public genotype releases for a given accession, such as RegMap, 1001Genomes or others. For accessions where seeds are available, a link to TheArabidopsisInformation Resource (TAIR) page where the germplasm can be ordered is provided. Each reported phenotype is therefore linked to a specific accession allowing for easy retrieval of geographical information and for computation of genotype-phenotype associations with constantly updated genotype information, thanks to the above-mentioned homozygous nature of the species. This also enables users to easily access all phenotypes related to a particular accession of interest.
Being a constantly evolving resource, AraPheno’s content grew over the last years.
A list of currently up-to-date values can be found in Table 2.1. The platform contains 22Studies relaying information about462phenotypes for1,496different accessions.
The large volume of presented data implied some technical challenges that were tackled with modern web-development frameworks, as presented in Section 2.2.3.
AraPheno offers several views to display all the relevant information to users.
The study view (an example can be foundhere) presents a description of the study, summary statistics about the reported phenotypes, a link to the relevant publication, and a list of phenotypes. The phenotype view (see Figure 2.1 or this link) lists characteristics of the phenotype such as its ontological attributes, the unit it was measured in as well as details on how it was scored. A list of relevant publication for
the phenotype is shown. It also displays the geographic distribution of the measured accessions as well as some visualizations on the phenotype values themselves: the Explorer widget allows users to further dive into the distribution of a particular phenotype. The view also shows a link to the associated AraGWAS results (see Section 2.3). The accession view (shown in Figure 2.2 or accessible here) provides the coordinates of where the accession was collected from and shows them on a map.
It also lists all the reported measured phenotypes for that given accession as well as some summary statistics related to their ontology.
To make the resource practically useful, all information can be downloaded di- rectly from the website in various file formats (CSV, JSON, and PLINK for sin- gle phenotypes or PLINK and ISA-TAB for complete studies). Additionally, users can access the data programmatically via a Representational State Transfer Ap- plication Programming Interface (REST API, more details can be found at ara- pheno.1001genomes.org/faq/rest). This enables a fast and direct integration of the data into existing programming pipelines. Moreover, the platform provides the pos- sibility to download the full AraPheno database in a single ZIP component, including all phenotypes and its meta-information (seearapheno.1001genomes.org/faq/content for a detailed explanation of the ZIP content).
AraPheno aims to be a participative resource, that is why it offers the possibility to users to upload their own studies to the website via a user friendly form or via the REST API. The submitted studies go through a manual curation step to ensure all relevant and important information such as scoring details and trait ontology terms are provided. Once the study is approved, the phenotypes are made public and a Digital Object Identifier (DOI) is associated to each of them by DataCite (https://datacite.org/) to make them easily referenceable and citeable in order to encourage researchers to upload their phenotypes even if they are not published yet.
AraPheno also offers two handy tools: a widget to evaluate and visualise the correlation between a set of phenotypes and a tool to apply transformation to any phenotype. Measuring correlation between phenotypes can be useful to decouple the shared environmental and shared genetic effects: several methods rely on phenotypic correlation to map the underlying genetic components [129, 225, 268]. Additionally,
Table 2.1: AraPheno content and summary statistics as of January 2020.
Studies 22
Phenotypes 462
Phenotype Values 193,616
Accessions 7,426
Phenotyped accessions 1,496
RNA-Seq studies 2
Unique RNA-Seq genes 28,819
Total RNA-Seq expression values 20,371,657 Accessions with RNA-Seq data 788
2.2 AraPheno
Figure 2.1: AraPheno phenotype view, containing details related to the Iron Concentration
Figure 2.2: AraPheno accession view, containing details related to the Ör-1 accession, col- lected in Sweden. Users can easily download the details related to the accession with the download button on the top right.
2.2 AraPheno
for many statistical analysis, phenotypic values need to be normalised to match the assumptions of the employed statistical test, hence we provide an easy way to apply transformations such as log, anscombe or box-cox transformations to AraPheno phenotypes.
Finally, AraPheno also has a detailed FAQ, tutorials and guided tours to help users understand how to use all the available functionalities.
2.2.2 RNA-Seq data
Recently, AraPheno was extended to also provide gene expression data from RNA- Seq experiments. This major overhaul of the backend of the platform (see Section 2.2.3) allows us to now present the gene expression values of more than750accessions for more than28,800genes. Unlike regular phenotypes, these measurements do not have a corresponding study in the AraGWAS Catalog as of yet. However, it is possible to treat gene expression data as high-dimensional phenotypic data and run GWAS or transcription-wide association studies (TWAS) on them [244]. Users can access the RNA-Seq data by toggling the switch on the homepage of AraPheno. A clone of the website built around the peculiarities of gene expression is then accessed and can easily be recognised by the theme color of the interface (blue for RNA-Seq and brown for phenotypes).
The AraPheno RNA-Seq interface is built around the study view, which sum- marises information of a given RNA-Seq study, and a detailed gene view. The RNA- Seq view shows all measured genes as the phenotype study view would show the collected phenotypes. The gene view highlights the distribution of the RNA-Seq values measured for the different accessions. As of now, there are2RNA-Seq studies on AraPheno, but this number is expected to grow constantly, similarly to what happened with the number of phenotypes.
2.2.3 Architecture and implementation
AraPheno was built with open-source, popular, and modern web development frame- works. The platform relies on Django (www.djangoproject.com), a Python-based web-application framework. Its popularity simplifies many extensions, the Django REST framework (www.django-rest-framework.org), for example, allowed us to eas- ily build REST endpoints that were then documented using the django-rest-swagger (GitHub link), an open-source swagger implementation for Django REST.
For the backend, Django easily interfaces with the high-performance PostgreSQL (www.postgresql.org) database in which the data are stored. During the last update [232], the backend components were modified to improve performance for multiple users and enable easier download and upload of large amounts of phenotypes. The frontend visualizations are obtained using the free google charts library (develop- ers.google.com/chart) and D3.js (d3js.org), a popular Javascript library for insight- ful data visualization. The two phenotype manipulation tools (correlation analysis and phenotype normalization) are built using open-source Python libraries: NumPy
(www.numpy.org), SciPy (www.scipy.org), and Pandas (pandas.pydata.org), three very well known high-performance scientific computing and data handling libraries.
Finally, AraPheno is deployed using docker (www.docker.com), an open-source software containerization platform. Docker ensures a reproducible environment for the deployment of the AraPheno platform without encountering issues with dependencies. The platform is hosted under the 1001genomes organization (1001genomes.org) and its framework is accessible as an open-source software on GitHub.
2.3 AraGWAS Catalog
The AraGWAS Catalog (aragwas.1001genomes.org) is a manually curated database for standardised GWAS results forArabidopsis thaliana. It was originally conceived after noticing that, despite the abundance and sharing of collected phenotypes for A. thaliana (see Section 2.2), it was impossible to find an overview of all SNP-trait associations that guarantees comparability across phenotypes. In fact, due to the large variety of accessions, phenotypes, and growth conditions, it was hard to find two large-scale studies for which the reported associations scores were comparable.
That is why we re-calculated all GWAS for the available phenotypes from AraPheno, using a best practice pipeline (see section 2.3.2) and the most up-to-date version of the genotype data. We then standardised all statistical significance thresholds using a permutation-based approach that accounts for the phenotypic distribution that can differ across phenotypes. Having a standard procedure for phenotype normal- ization and processing, association computation, and permutation-based significance threshold computation ensures the comparability of the scores and the significance of the reported associations. Finally, the AraGWAS Catalog enables easy access to standardised GWAS results for all AraPheno phenotypes with the latest release of genomic data and promotes comparative analyses across different phenotypes.
2.3.1 Content and features
The AraGWAS Catalog contains GWAS results for all the 462phenotypes reported in AraPheno using the fully imputed data for2,029A. thaliana lines from the1001 Genomes Consortium [51]. While similar resources can be found for other species such as humans – e.g. the NHGRI GWAS Catalog[154,248],the public availability of genotypes and phenotypes inA. thaliana allows for the systematical re-computation of the GWAS results in a best-practice way to ensure comparability across pheno- types and experiments. Permutation-based significance thresholds are computed for every trait in the catalog to account for various phenotypic distributions. In total, we identified 44,680 significant SNP-trait associations for Arabidopsis thaliana. A detailed list of summary statistics can be found in Table 2.2.
Users can find a sortable table with all available GWAS under the“GWAS Studies”
view, where the studies are sorted according to the number of significantly associated hits above the permutation-based threshold. All details about a specific GWA Study
2.3 AraGWAS Catalog
can be visualised in the detailed study view (accessible by clicking on the study name, which is equivalent to the trait name, e.g. aragwas.1001genomes.org/study/144).
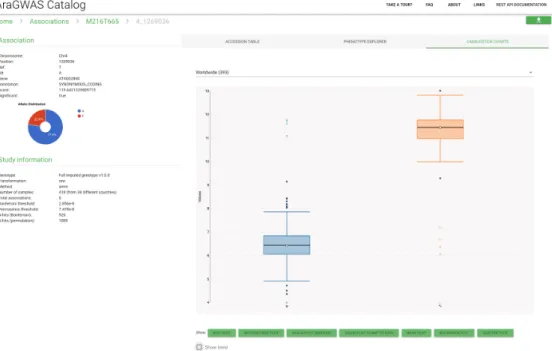
Figure 2.3 shows an example of the view for a metabolite content phenotype. The view contains all relevant information for the phenotype and details about the study, such as the genotype version used, a link to the AraPheno entry and information about the significance thresholds used (Figure 2.3 - A). Summary statistics about the distribution of significant associations are displayed just below (Figure 2.3 - B) while a list of all associated hits with their respective p-values is accessible right next to it (Figure 2.3 - C). Users can easily filter the associations with the lateral filter option and download the selected associations via a convenient download button (Figure 2.3 - D). Additionally, interactive Manhattan plots are shown in a separate tab of the sudy view and knock-out mutations associations can be visualised in a third tab.
From the detailed study view, users can conveniently click on specific associations (i.e. SNPs in the list) and access an individual association view, as shown in Figure 2.4 (accessible ataragwas.1001genomes.org/study/144/associations/4_1269036). In fact, it can be of interest for downstream analyses to look not only at p-values but also at effect sizes, standard errors, allelic information, and phenotypic distributions for the different allelic groups. All this information can be conveniently visualised in the association view via dynamic plotting or in the accession table and is accessible when downloading study data.
Moreover, other data-centric views are shown across the platform to ease users’
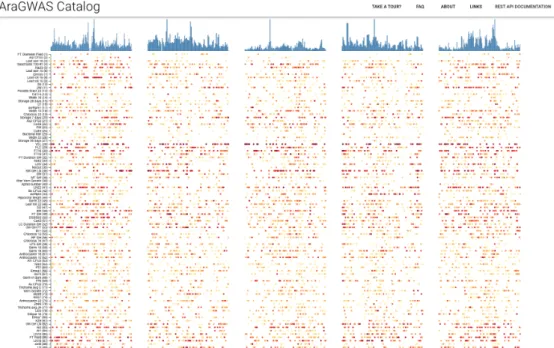
quick grasp of the Catalog’s content. The “GWAS Hitmap” shows a high level overview of the most associated hits in different regions of each of A. thaliana’s 5 chromosomes (see Figure 2.5). The columns summarise the chromosomes while each row reports the 25 strongest hits per chromosome for each of the studies re- ported in the catalog. Each dot illustrates the top associated hit within the focal region of the chromosome, which is obtained via a sliding window of 250kbp. The color reports the strength of the association, where red indicates a stronger associ- ation (i.e. lower p-value) than yellow. A histogram summarises the density of hits for each chromosome. This view enables users to have an overview of the associated
Table 2.2: AraGWAS Catalog content and summary statistics as of January 2020. Numbers of associated hits are filtered by minor allele count (MAC) > 5. Sig. is an abbreviation of Significant.
Studies 462
Phenotypes 462
Sig. SNP-Trait Associations atp <10−4 1,152,968 Sig. SNP-Trait Associations at Bonferroni threshold 104,874 Sig. SNP-Trait Associations at Permutation threshold 44,680
KO-Mutations 2,088
Sig. KO-Trait Associations atp <10−4 319 Sig. KO Associations at Bonferroni threshold 130 Sig. KO Associations Permutation threshold 15
Figure 2.3: AraGWAS Catalog detailed study view, containing details about the GWA Study on M216T665 phenotype. Users can easily download the details related to the filtered associations with the download button on the bottom right. (A) Brief description about study related information with links to the phenotype and publication. (B) Summary statistics about SNP type, impact, annotation and MAF. (C) Sorted list of associated markers. (D) Filters to narrow down the list of associated hits.
2.3 AraGWAS Catalog
Figure 2.4: AraGWAS Catalog association view, containing details about the Chr4_1269036 accession of the GWA Study on M216T665 phenotype. Users can easily visualise the distribution of the phenotype for different allelic groups.
hits at a glance, potentially highlighting correlations between traits, patterns across chromosome areas, and uncovering pleiotropic effects.
In the“Top Associations” view, users can obtain a list of all associated hits (i.e. p- value<10−4) across all traits stored in the catalog. Each association has additional information related to its variant, e.g. MAF, MAC, type and annotations. These additional entries can be used to filter the hits. Each entry in the table contains links to the detailed view about the study, accession or the gene the variant was found in.
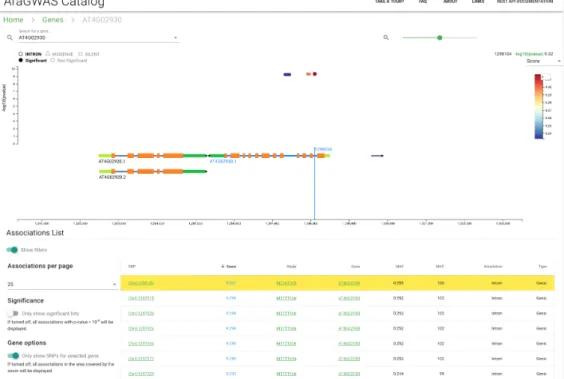
The“Top Genes” view summarises all associated hits detected in genes (or in their close proximity), grouping results by gene name. Table 2.3 shows the10 genes with the most hits. Clicking on gene names will redirect to thegene-centric view (Figure 2.6), where dynamic visualization can be used to guide the users in their explo- ration around a region of interest. Information about annotations from SnpEff [49]
or gene descriptions extracted from the AraPort11 GFF3 file from the TAIR re- source (www.arabidopsis.org/download) are shown and users can directly access the ThaleMine entries for each gene when clicking on them.
Since loss-of-function mutations are an important source of genetic variation in the evolution of plant traits[16, 111], the AraGWAS Catalog also contains associations between reported knockout (KO) mutations and all AraPheno phenotypes. The natural KO mutations are based on loss-of-function alleles of full genes [171] and these new association results are shown in additional views in the catalog. Users can quickly scan through KO-Trait association via the interactive KO Manhattan plots
Figure 2.5: AraGWAS Catalog GWAS HitMap, containing a snapshot overview of all asso- ciated hits reported in the Catalog. Each column is a chromosome while each row represents a study of the catalog. The color (yellow to red) indicates of the strength of the association.
shown in each detailed study view and, when clicking on one of the dots, they will be redirected to the detailed gene view of the knocked out gene. Additionally, the
“Top KO Mutation” view shows a full list of all significant associations between KO genes and traits and the“Top KO Genes” view provides a list of the top associated KO mutation genes, and indicates if any of the KO genes is associated to more than one phenotype.
When analyzing the reported associations between phenotypes and natural KO mutations, associations undetected by SNP-based GWAS could be uncovered. As an example, natural KO alleles in AT1G57570, a mannose-binding lectin superfamily protein expressed during seed germination, were associated with the “number of days of seed dry storage required to reach 50% germination” (DSDS50).
Data from the AraGWAS Catalog are easily downloadable through the web- interface: users can obtain full study results (summary statistics) in HDF5 format and filtered association lists in CSV format. Additionally, all related phenotype data can be obtained from AraPheno, through convenient links. A Download Centerre- groups various download options such as the full database download, the imputed genotype download or the KO mutation data download to ensure reproducibility of the results. The AraGWAS Catalog also provides a series of REST endpoints for a programmatic access to the data. Users can therefore obtain hits for a specific gene or a given genomic region in their custom analysis pipelines. A full documentation is
2.3 AraGWAS Catalog
Figure 2.6: AraGWAS Catalog Gene view, showing details of associations around specific genes. Detailed gene descriptions are available when hovering with the cursor over a certain gene.
Table 2.3: AraGWAS Catalog Top Genes according to the number of significant hits as of January 2020. The number of associated loci per gene are based on permutation- based thresholds and minor allele count (MAC) > 5.
Gene name Short description N. hits
AT4G02930 GTP binding Elongation factor Tu family protein 195
AT3G20910 Nuclear factor Y, subunit A9 190
AT5G44800 Chromatin remodeling 4 189
AT4G02850 Phenazine biosynthesis PhzC/PhzF family protein 179
AT5G40150 Peroxidase superfamily protein 159
AT5G44820 Nucleotide-diphospho-sugar transferase family protein 146
AT5G45095 Hypothetical protein 144
AT5G45190 Cyclin family protein 118
AT5G22760 PHD finger family protein 117
AT4G30150 Urb2/Npa2 family protein 112
provided online (aragwas.1001genomes.org/docs/). Finally, the AraGWAS Catalog also has a detailed FAQ and offers tutorials and guided tours to new users.
2.3.2 Standardised GWAS pipeline
The GWAS results presented in the AraGWAS Catalog are obtained with a standard- ised procedure to ensure comparability of the presented associations across different phenotypes. On one hand, all the accessions’ genotype values come from the same SNP-Matrix. On the other hand, permutation-based threshold were used to have true comparability between traits with different measuring units and distributions (including non-Gaussian phenotype distributions).
GWAS was performed on all phenotypes of the AraPheno database. For the geno- type, the latest version of the 1001 genomes project was used in combination with existing SNP chip data [107], resulting in a SNP-Matrix for 2,029 accessions and 10,709,466segregating markers. Missing values were imputed with BEAGLE v3.0 and standard parameters [37]. For the phenotypes, the untransformed mean value for each phenotype across the accessions’ replicates was used for the analysis.
GWAS were conducted using linear mixed models, correcting for population struc- ture in a two-step approach. In the first step, all markers were analysed using an approximation of the mixed model (EMMAX). In the second step, the top 100 markers were analysed again using the full mixed modell (EMMA). The kinship matrix was pre-calculated using all available accessions and removing alleles with a minor allele frequency below 5%. The permutation-based threshold for each phe- notype was obtained by repeating this exact procedure multiple times, with per- muted trait values for each accession, resulting in a mixed-model where, supposedly, no genotype-phenotype connection is present. The AraGWAS Catalog reports the 5% permutation-based threshold per phenotype, providing a more realistic signifi- cance threshold that depends on the phenotypic distribution rather than on generic