SFB 649 Discussion Paper 2016-055
A Multicity Study
of Association between
Air Pollution and CHD Mortality in China by Using
Time Series Threshold Poisson Regression Model
Xiaoyu Chen *
* Fudan University, People's Republic of China
This research was supported by the Deutsche
Forschungsgemeinschaft through the SFB 649 "Economic Risk".
http://sfb649.wiwi.hu-berlin.de ISSN 1860-5664
SFB 649, Humboldt-Universität zu Berlin Spandauer Straße 1, D-10178 Berlin
SFB
6 4 9
E C O N O M I C
R I S K
B E R L I N
1
A Multicity Study of Association between Air Pollution and CHD Mortality in China by Using Time Series Threshold Poisson Regression Model
Xiaoyu Chen
1School of Public Health, School of Data Science, Fudan University, Shanghai, China Abstract
There are few multicity studies to address the effect of short-term effect of particulate matter air pollution on daily Coronary Heart Disease (CHD) mortality in developing countries, much fewer to further discuss its threshold and seasonal effect. This study investigates the season-varying association between particulate matter less than or equal to 10 μm in aerodynamic diameter (PM10) and daily CHD mortality in seven cities of China. Time series threshold Poisson regression model is specified to estimate the health effect for four cities with the threshold effect, and conventional linear Poisson model is used to analyze the effect for three cities without threshold.
We apply the Bayesian hierarchical model to pool the city-specific estimates into overall level. On average, a 10μg/m3 increase of the moving average concentrations of current-day and previous-day PM10 is associated with an increase of 0.81% (95% Posterior Interval, PI: -0.04%, 1.67%) in daily CHD mortality for all the cities as a whole. The associations are smaller than reported in developed countries or regions with lower polluted level, which is consistent to the findings in the literature. The hazardous effect are higher in hot summer and cold winter (1.15%
and 0.89%) but lower in relative warm spring and fall (0.85% and 0.69%). In summary, we found significant associations between short-term exposure to PM10 and CHD mortality in China. The sensitivity analyses in the study support the robustness of our results.
Keywords: air pollution; CHD mortality; PM10; threshold; season; China JEL: I18; Q53; R58; C11; C14
Introduction
With the industrialization and urbanization during the past half of a century, air pollution has become a serious issue in the world, especially in the rapid developing regions like China, which inevitable influences the human health in this area. Chen et al. (2016) denoted that, due to the air pollution, more than 200 billion RMB are spent on the medical treatment for curing health damages and approximately hundred thousand lives were taken away on an annual average in China. In industrialized countries, cardiovascular disease is the leading cause of mortality and morbidity and the air pollution plays a critical role in it (Bhaskaran et al., 2009). Coronary heart disease (CHD), also known as ischemic heart disease, killed almost 7 million people in the world
1 E-mail: xiaoyuchen14@fudan.edu.cn. The author acknowledges the support from Hui-Chun Chin and Tsung-Dao Lee Chinese Undergraduate Research Endowment (CURE). Financial support from the Deutsche Forschungsgemeinschaft via CRC Economic Risk and IRTG 1792 High Dimensional Non Stationary Time Series, Humboldt-Universität zu Berlin, is gratefully acknowledged.
2
in 2010, which has now become the most common cause of mortality worldwide among cardiovascular diseases (Lozano et al., 2013). It was estimated that CHD led to 0.95 million deaths annually in China (Yang et al., 2013).
Since the 1990s, many epidemiological studies have demonstrated associations between air pollution and respiratory or cardiovascular diseases. Most of them found that exposure to air pollution has adverse effects on respiratory or cardiovascular diseases (Pope and Dockery, 2006;
Kan and Wu, 2013). However, the studies about the effect of air pollution on coronary heart disease account for a very small fraction of all the air pollution related cardiovascular studies, and have been most reported in developed areas such as North America and Europe. For example, fatal coronary heart disease was significantly associated with PM among females but not among males when analyzing the AHSMOG cohort selected from three large metropolitan areas in California (Chen et al., 2005). Jerrett et al. (2005) observed the relatively strong relationships between PM2.5 and ischemic heart disease mortality too in the metropolitan Los Angeles subcohort. Serinelli,et al. (2010) concluded that short term exposure to PM10 is associated with CHD mortality especially among the elderly and socio-economically disadvantaged in eight Italian cities during 1997-2004. Cesaroni et al. (2014) found long term exposure to particulate matter is associated with incidence of coronary events in five European countries and this association persists at levels of exposure below the current European limit values. Mustafic et al. (2012) have shown that short-term air pollution exposure is associated with ischemic heart disease, especially the triggering of myocardial infarction (MI). Zanobetti and Schwartz (2009) found a 1.18%
increase in MI for a 10μg/m3 increase in 2-day averaged PM2.5 in 112 U.S. cities. Quite few studies have evaluated the effects of air pollution on CHD in China. Xie et al. (2014) found that PM2.5 concentration was significantly associated with CHD morbidity and mortality in Beijing from 2010 to 2012. Dai et al. (2015) evaluated the effect of air pollution and temperature on daily out of hospital CHD in Shanghai from 2006 to 2011. Li et al. (2015) found a positive relationship between air pollution and CHD in 8 large Chinese cities from1996 to 2008.
The studies of associations between air pollution and CHD mortality described above normally focus on one city and less on the rapid developing regions with higher pollution level. Also, above studies often assume that the CHD deaths are linearly related to air pollution without the threshold effect. As Kim et al. (2004) denoted, there possibly exists a nonlinear association between air pollution and health effect, sometimes negative between the two variables. Thus, the conventional linear Poisson model, which does not take threshold into consideration, will underestimate the true risk of the air pollution on daily mortality. The existing literature rarely considers the seasonal effect of air pollution on CHD mortality, too. Different from them, therefore, the main goal of this study is to undertake the multicity analysis of seven cities in rapidly developing China. Bayesian hierarchical model is applied to pool the city-specific estimates into the overall level. The secondary goal of this study is to systematically introduce the modeling strategies to identify the threshold effect for different cities. Thus, the nonlinear Poisson model will be adapted to search for the thresholds based on the hypothesis that the effect of air pollution on CHD mortality is not linear but rather J-shaped. The last goal of this study is to investigate the seasonal-varying effect of particulate air pollution on CHD mortality in China. Our study aims at the PM10 air pollution, the particulate matter with an aerodynamic
3
diameter less than or equal to a 10μm and includes fine particles and a subset of coarse particles.
The other pollutants like nitrogen dioxide (NO2), sulfur dioxide (SO2) and ozone (O3) will be introduced to do the co-pollutants robust test.
Methods
Data Collection
The seven cities analyzed in this study include Shanghai, Suzhou, Shengyang, Taiyuan, Tangshan, Xi’an and Hong Kong. The study period varied between 1996 and 2008 from city to city, depending on the data availability. These cities cover a wide range of geographical and socioeconomic features and are the large city representatives of China.
The sources of daily CHD mortality data were the Municipal Center for Disease Control and Prevention for each city in mainland China, and the Census and Statistics Department in Hong Kong. As Li et al. (2015) denoted, the CHD death was defined according to the primary death cause in terms of ICD-10 (codes I20–I25). Death certificates were completed at the time of death either by community doctors for deaths at home or by hospital doctors for deaths at hospitals.
Then, the deaths were aggregated on a daily basis.
The data on daily concentrations of particulate matter with aerodynamic diameter of 10 μm or less (PM10), nitrogen dioxide (NO2), sulfur dioxide (SO2), and ozone (O3) is collected from fixed site air monitoring stations in each city. The daily 24-hour mean for PM10, NO2 and SO2 and daily maximum 8-hour averages (from 10 AM to 6 PM) for O3 are computed. In each city, the daily air pollutants’ concentrations were averaged from the available monitoring measurements across various stations. The daily mean temperature and relative humidity data are obtained from the meteorological departments in each city to allow adjustment for the potential confounding effects of weather conditions on daily CHD mortality rate (Chen et al., 2014).
Statistical Analyses
The two-stage analytical framework is applied to obtain the overall effect of PM10 on CHD mortality in this study. At the first stage, the quasi-Poisson generalized additive model (GAM) is used to regress the daily time-series data for each city because daily mortality counts typically follow an over dispersed Poisson distribution. We assume the PM10 variable enters the model in three different ways: as a simple linear term, as a cubic natural spline term, and as a combination of two linear terms (a threshold model). At the second stage, the city-specific estimates are pooled at the overall level by using Bayesian hierarchical model.
The three quasi-Poisson GAM models are specified as follow. The linear quasi-Poisson GAM model is given by
( ) ( )
( ) ( )
0 1 1
1
log ,df
temperature ,6 humidity ,3 dow
t t
t t t
E Y Z ns t
ns ns
α β
α
= + − +
+ + +
∑
(1)where
Y
t is the daily count of CHD mortality;Z
t−1 is the PM10 concentration that includes a4
lag effect; ns is the natural spline smoothing function; and
β
is the regression coefficient of PM10 on CHD mortality that we need estimation in the study. The covariates used to control for potential confounders in the model include trend (t), day of the week (dow) and meteorological variables, namely, temperature and relative humidity. In this study, we include, a priori, the mean (day of death and previous day) PM10 concentrations (lag01) in all models because this lag was most commonly used in previous studies and was shown to be more strongly associated with the observed health effects (Peng et al., 2013). Degrees of freedom (df) is selected to be 6 per year for trend variable in order to control for unmeasured long-term and seasonal trends in daily CHD mortality count, see the following sensitivity analysis for details. According to the previous studies, the df used to smooth temperature and humidity are 6 and 3, respectively, for the whole study period in order to adjust for the potential confounding effects of weather conditions on CHD mortality (Chen et al., 2014). We incorporate only the present-day temperature and relative humidity in the models.The linear model assumes that the log of CHD mortality count linearly increases as PM10 level increases, in which the threshold effect will not be taken into account. To observe the threshold and relationship without the linearity assumption, the cubic natural spline (ns) is used for the PM10 variable; this model is thus named the natural spline GAM model. A ns smoother with two knots at 25 and 75 percentiles is selected for PM10 variable in this study. The nonlinear relationship will be graphically investigated by using the model. To analyze the threshold effect, if any, we consider the following quasi-Poisson GAM model,
( ) ( ) ( )
( ) ( )
0 1 1 2 1
1
log ,df
temperature ,6 humidity ,3 dow
t t t
t t t
E Y Z Z ns t
ns ns
α β β τ
α
− − +
= + + − +
+ + +
∑
(2)where
( Z − τ )
+= max { Z − τ ,0 }
. This model is the same as formula (1) if the level of PM10 is less thanτ
, and as( ) ( ) ( )
( ) ( )
0 2 1 2 1
1
log ,df
temperature ,6 humidity ,3 dow
t t
t t t
E Y Z ns t
ns ns
α β τ β β
α
= − + + − +
+ + +
∑
(3)if the level of PM10 is greater than
τ
. These two lines are enforced to meet at the threshold value (τ
). We follow Kim et al. (2004) to name this model as the threshold GAM model in this study. All the variables and coefficients are defined same as formula (1). The location of the threshold value is obtained by implementing a grid search and by identifying the PM10 level that maximizes the estimated likelihood function or minimizing the AIC (Akaike’s Information Criterion) value in the model.To analyze the seasonal effect of PM10 effect on CHD mortality, we incorporate the seasonal dummy variables into the above GAM models as below.
1) Replace the
β
with interaction termsspDsp suDsu fDf wDw
β β
= +β
+β
+β (4)
5
where Dsp,
D
su, Df andD
w are seasonal dummy variable of spring (March-May), summer (June-August), fall (September-November) and winter (December-February), respectively.2) To control the temporal trend in each season, we replace the
ns t ( ,df )
in above models with( ,df ) ( ,df )
sp( ,df )
su( ,df )
f( ,df )
wns t = ns t I + ns t I + ns t I + ns t I (5)
The GAMs using nonparametric smoothing allow for relatively flexible fitting of long-term time trends and seasonality, as well as nonlinear associations with weather variables like temperature and relative humidity.
At the second stage, the Bayesian hierarchical model is applied to pool the city-specific estimates into overall level. The estimated city-specific
β
coefficients in the all-year model and the seasonal model are assumed to be normally distributed around the true city-specificβ
with covariance matrix, estimated within each city. The Bayesian hierarchical model is applied by using two-level normal independent sampling estimation with uniform priors. This provides a sample from the posterior distribution from which one can calculate posterior means and variances of the overall estimates. Then, we present the estimates as the posterior means of the percentage increases in daily CHD mortality and their 95% posterior intervals.To check the stability of our results, we carry out three types of sensitivity analysis in this study.
Firstly, we include different df values into the trend smooth to select the appropriate df for the formal use in the models. Secondly, we estimate the all-year and season-specific associations of PM10 using different lag structures including single-day lags (from lag 0 to lag3) and cumulative lags (lags 0-2 and lags 0-3) to examine whether the pattern of PM10’s effect on CHD mortality is changing when using alternative lags of PM10. Thirdly, we investigate the sensitivity of our results to the simultaneous exposure to other pollutant by alternatively fitting 2-pollutant models with NO2, SO2 and O3, respectively.
The statistical tests were 2-sided, and effects of P <0.05 are considered statistically significant. All models are running in R statistical software (version 3.2.4) using the mgcv package for generalized additive models, and tlnise for Bayesian hierarchical models. The formal effects are reported as the percentage change in daily CHD mortality in relation to per 10 μg/m3 increase in PM10 concentrations.
Results
Descriptive Results
Table 1 reports the descriptive statistics for the data sample and variables of seven cities in China.
6
The sample period varies from city to city according to the data availability. The total number of daily time series observations attains twelve thousand. The mean of daily CHD deaths ranges from 1.5 in Suzhou to 16.8 in Shanghai. On average, China has a highly daily mean of CHD death (8.1). The daily mean concentration of PM10 differs in these cities, ranging from 51.4 μg/m3 in Hong Kong to 130.8 μg/m3 in Xi’an. From the seasonal view, the lowest daily mean of PM 10 concentration occurs in summer, 33.2 μg/m3 for Hong Kong, and highest one occurs in winter, 164.4 μg/m3 for Xi’an. From a regional view, cities in Beijing-Tianjin-Hebei region have higher mean concentration of PM10, followed by Yangtze River Delta, and lowest in Pearl River Delta.
The mean PM10 concentration also varies greatly across seasons with higher concentration in winter (118 μg/m3) and spring (107 μg/m3) than in fall (98.9 μg/m3) and summer (83.7 μg/m3).
The daily mean temperatures range from 8.2°C in Shenyang to 23.7°C in Hong Kong, and the daily mean humidity ranges from 55.1% in Taiyuan to 77.9% in Hong Kong, reflecting the heterogeneous weather conditions among these cities. How will the different air pollution level and weather condition affect the CHD mortality in each city? That is the main task of the following regression. The descriptive statistics have provided us the hint of the regression results.
Table 1 insert here Regression Results
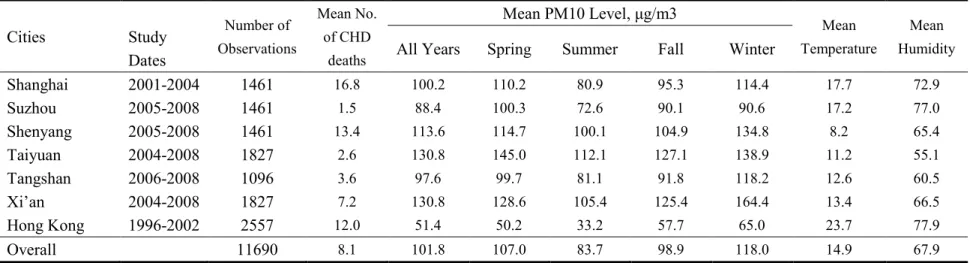
This study adopts the cubic natural spline (ns) GAM model specified in statistical analysis section to check the threshold effect for seven cities respectively. Among seven cities, three cities like Shenyang, Tangshan and Hong Kong are observed to almost have positive linear associations between CHD deaths and PM10 without the threshold effect. The other four cities display the obvious nonlinear relations between percent increase of CHD mortality and PM10 level with the apparent threshold. Figure 1 illustrates the nonlinear curves between daily CHD mortality and PM10 concentration as estimated by the cubic ns model for four cities in all the years. The PM10 concentration ranges from zero to 0.90 quantile of PM10 level for each city. From the figure, it is evident that a threshold point exists somewhere between 50 and 60 μg/m3 of PM10 for Shanghai, 40-60 μg/m3 for Suzhou, 50-60 μg/m3 for Taiyuan, and 90-120 μg/m3 for Xi’an respectively.
Figure 1 insert here
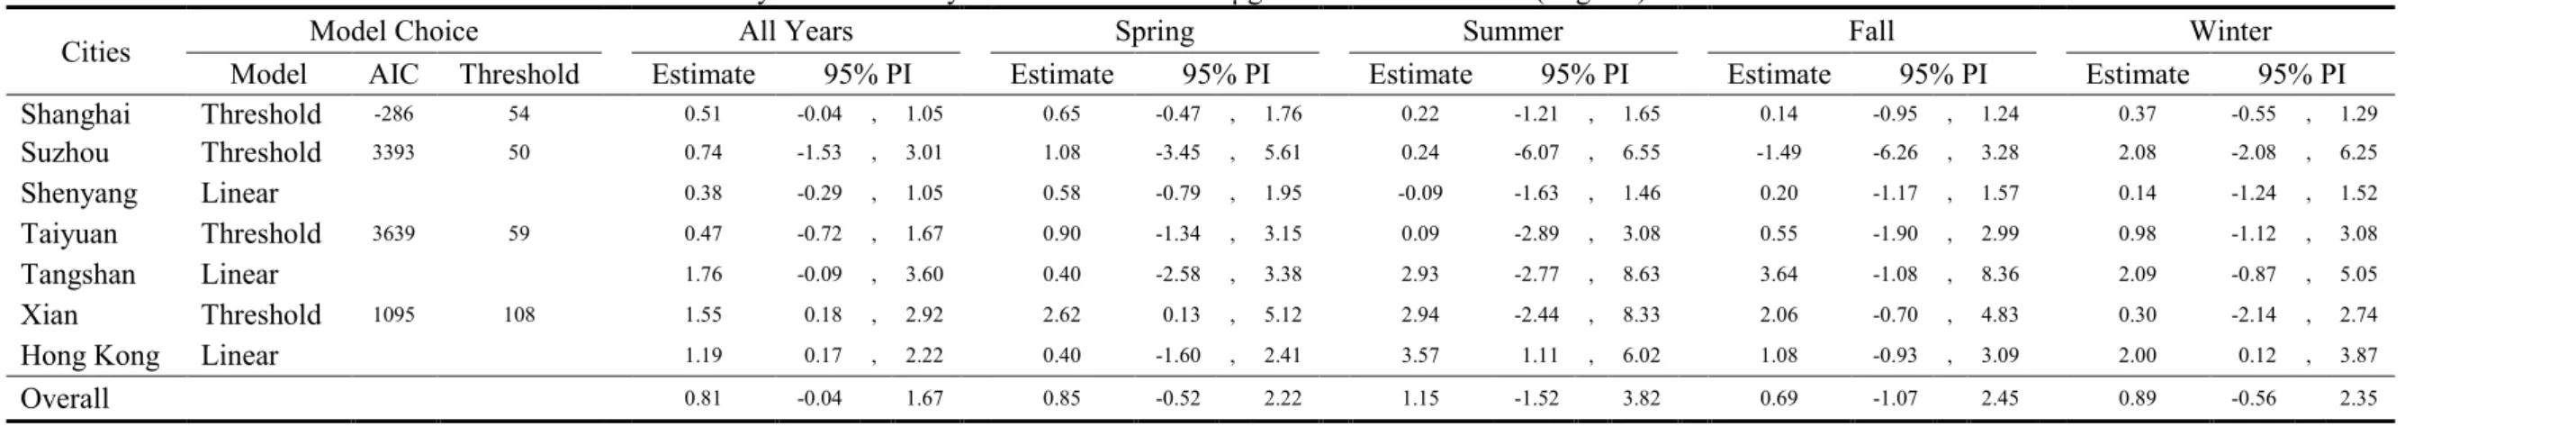
A linear GAM model would be an underestimate if the threshold point exists. Thus, we estimate the city-specific effect of PM10 on CHD mortality for above four cities by using the threshold quasi-Poisson GAM model, i.e., taking the slope of the line after the threshold. For three cities without threshold the linear quasi-Poisson GAM model is used to estimate the CHD effect. Table 2 reports the model choice and the estimated percentage increase of CHD mortality associated with a 10 μg/m3 increase of PM10 in seven cities of China and its pooled level. The specific discerned thresholds that minimizing the corresponding AIC are listed in the 4th column of the table. Obvious, the thresholds for four cities in China all exceed or at least equal to 50 μg/m3, the short-term air quality criterion of 24-hours mean PM10 concentration provided by WHO. Due to the smallest AIC value shown in the third column, the threshold model always provides us the
7
best fit. The highest increase of 1.76% (95% PI: -0.09-3.60) in CHD mortality associated with a 10μg/m3 increase of PM10 is observed in Tangshan. The lowest increase of 0.38% (95% PI:
-0.29-1.05) in CHD is observed in the city of Shenyang. There also exists big variability of estimated CHD effect among four seasons for each city. On average, a 10 μg/m3 increase of PM10 will cause 0.81% (95% PI: -0.04-1.67) increase of CHD mortality in China. The apparent seasonal effects are also observed in the pooled estimates. The higher increase of CHD mortality effect in related to a 10μg/m3 increase of PM10 level occurs in hot summer (1.15%, 95% PI:
-1.52-3.82) and cold winter (0.89%, 95% PI: -0.56-2.35), while the lower increase of CHD effect appears in warm spring (0.85%, 95% PI: -0.52-2.22) and cool fall (0.69%, 95% PI: -1.07-2.45).
Obviously, the temperature variable has played a critical role in the effect of particulate air pollution on CHD mortality in China.
Table 2 insert here
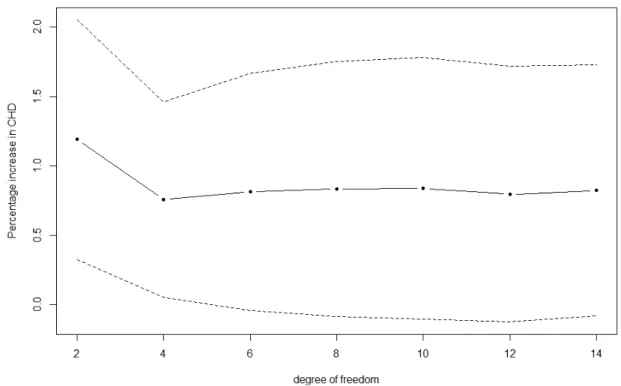
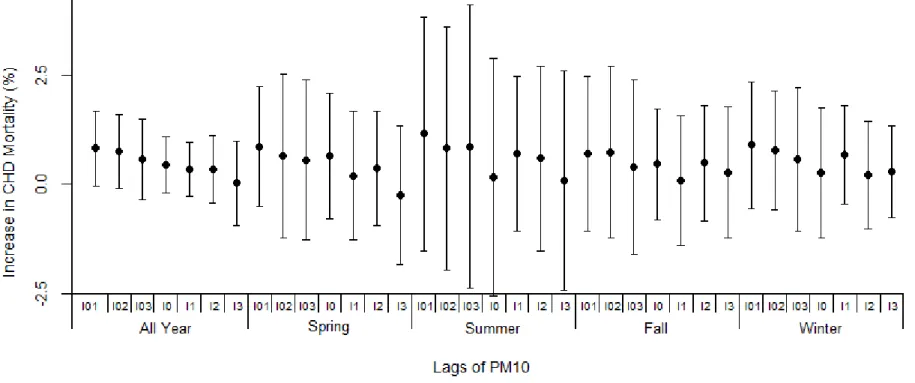
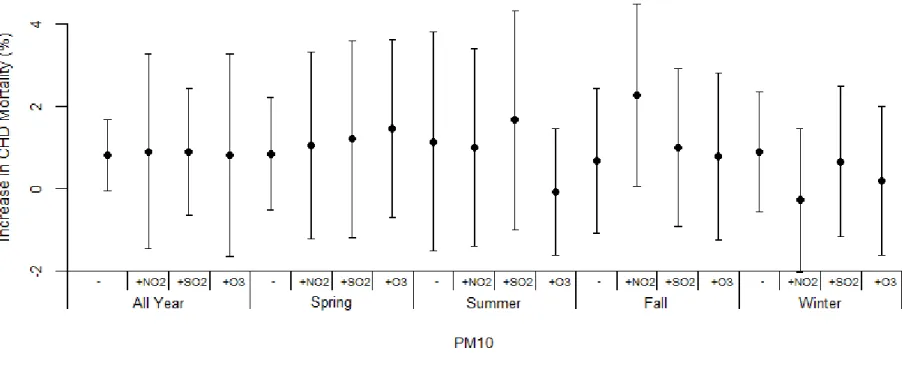
Figure 2-4 provide the robust tests of above results in the study. Figure 2 depicts the percentage increase in CHD mortality associated with a 10 μg/m3 increase in PM10, under different degrees of freedom for trend variable. The estimate becomes stable when the df value is larger than 4, while increasing df has little effect on the estimates. Thus, we selected 6 as the df of trend variable for all the models used in the study. Because the adverse CHD effects of PM10 are likely dependent on both exposure concentrations and length of exposure, it is also necessary to test the estimates under different lags of PM10 exposure. Seen from Figure 3, the estimates from multi-day moving average lags are normally larger than those from single-day lags, and the lag structure used in this study (lag01) almost generates the largest estimates compared with all other lags (only one exception in fall), which is able to fully reflect the adverse effect of air pollution on the health. The seasonal effects are also apparent in the test, higher in summer than in spring, and also higher in winter than in fall, similar to the estimates shown in Table 2. Figure 4 tells us, after adjusting in turn for NO2, SO2 and O3, the estimates from 2-pollutant models provide the similar effect of air pollution on CHD mortality to that by 1-pollutant models used in this study. The sensitivity analysis justifies our results reported above.
Figure 2-4 insert here
Discussion
This multicity time-series study in seven large cities across China provides robust evidence of a significant association between short-term particulate air pollution exposure and CHD mortality.
Four cities display a nonlinear exposure–response relationship curves with apparent threshold effects and three cities have linear lines without any discernible thresholds. Obvious seasonal effects are observed in the study which is averagely higher in extreme temperature like hot summer and cold winter but lower in moderate climate such as warm spring and cool fall. Our results are generally not sensitive to the use of alternative lags for PM10 and the adjustment of co-pollutants.
Table 3 insert here
8
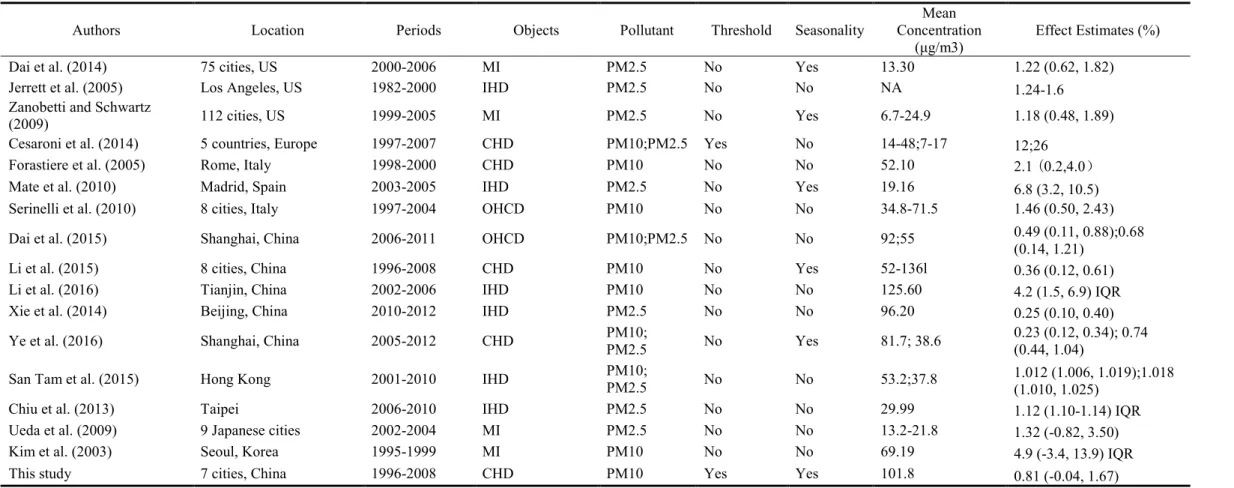
Our estimates show that a 10 μg/m3 increase of PM10 will cause 0.81% increase of CHD mortality in China overall, which are smaller than those effects reported in developed countries or regions and are consistent to the findings in the time series based studies. As shown in Table 3 which provides the estimated effect of particulate matter air pollution on CHD mortality in the literature, the exposure-response relationships are normally higher in US, Europe and developed Asia countries or regions but lower in China. For example, based on the data of 75 cities of US, Dai et al. (2014) estimated a 1.03% (95% CI: 0.65, 1.41%) increase in cardiovascular disease, a 1.22% (95% CI: 0.62, 1.82%) increase in myocardial infarction (MI), a 1.76% (95% CI: 1.01, 2.52%) increase in stroke in association with a 10μg/m3 increase in 2-day averaged PM2.5 concentration.
Cesaroni et al. (2014) found in Europe a 5 μg/m3 increase in annual mean PM2.5 was associated with a 13% increased risk of coronary events, and a 10 μg/m3 increase in annual mean PM10 was associated with a 12% increased risk of coronary events. Ueda et al. (2009) analyze the 9 Japan cities and estimate a 1.27% (CI, 0.22-2.32) increase of all heart disease and 1.32% (CI: -0.82-3.50) increase of MI mortality associated with a 10μg/m3 increase in PM2.5. For four studies of China provided in Table 3, a 10μg/m3 increase of PM10 and PM2.5 will result in 0.23-0.49%, and 0.25-0.74% increase of CHD or IHD mortality, respectively (Xie et al., 2014; Dai et al., 2015; Li et al., 2015, and Ye et al., 2016), being even smaller than the estimated effect of China (0.81%) in this study.
Apparent seasonal effects are observed in our study. Overall, the largest increase of 1.15% of CHD mortality in response to a 10μg/m3 increase in PM10 occurs in hot summer, followed by 0.89% in cold winter, and the lower increase of 0.85% and 0.69% is in mild spring and fall. There are only small proportions of the studies that analyzed the seasonal effect of PM10 on CHD mortality in the literature, as summarized in Table 3, and the observed seasonal pattern is not consistent. For example, Dai et al. (2014) studied the season-varying association between PM2.5 and MI mortality in 25 US cities and found the associations were largest in the spring, followed in summer and fall, and lowest in winter. Zanobetti and Schwartz (2009) also examined the seasonal association between PM2.5 and MI mortality in 112 US cities and concluded the associations from the largest to the lowest occur in spring, winter, fall and summer. The studies of China achieve the different seasonal effects too. Ye et al. (2016) estimated the seasonal effect of PM10 and PM2.5 on CHD mortality in Shanghai and found that the cool effect is larger than warm effect for both PM10 and PM2.5. Li et al. (2015) analyzed the seasonal effect of PM10 on CHD mortality in 8 Chinese large cities and gave the contrary conclusions that the effect is larger in warm season and lower in cool season. Different from them, our study indicates that the effect of particulate air pollution on CHD mortality is higher in summer and winter with extreme temperatures but lower in spring and fall with mild weathers.
As described in Table 3, most of previous estimate was obtained from single-city studies, especially in Chinese studies, and thus potential publication bias might exist. Multicity studies, on the other hand, allow for reporting negative results in city-specific estimates which are less likely to be published in single-city studies (Chen et al., 2014). Therefore, the multicity analysis of seven Chinese cities in our study may provide more comprehensive evidence about the effects of particulate matter air pollution on CHD mortality either in all years or in four seasons. In Table 3,
9
furthermore, only Cesaroni et al. (2014) among 16 reviewed papers discussed the threshold effect between particulate matter and CHD mortality in Europe. In fact, in the literature, many studies found the linear association between air pollution and public health without threshold effect, but many other studies discuss the nonlinear effect and corresponding threshold value.
Understanding the shape of the exposure-response curve and the existence of a no-effects threshold level has played a critical role in efforts to establish and evaluate ambient air quality standards and related public health policy (Pope and Dockery, 2006). Thus, the possible existence of a threshold must be carefully studied when the association between PM10 and CHD deaths is estimated in this study. In particular, we specify a cubic natural spline Poisson model to identify the threshold effect of PM10 on CHD mortality in seven cities and adopt the threshold quasi-Poisson model to estimate the CHD effect of particulate matter with threshold. Totally three cities exhibit a linear curve without threshold but four cities address apparent threshold effect in this study. Grid search is used to discern the exact threshold value which will provide the threshold GAM model the best fit. As Kim et al. (2004) denoted, linear model is often specified mainly due to its computational simplicity. But, linearity is a very strong assumption and its estimate is very likely to be negative below the threshold value. If the threshold effects exist, the estimate from the linear model would be a weighted average of the two slopes, and therefore would be less than the slope for the PM10 level larger than the threshold. This implies that a linear time-series Poisson regression may seriously underestimate the true association, which justifies the appropriateness of threshold quasi-Poisson GAM model and its estimates used in this study.
Several limitations should be noted in this study. First, we only search for the threshold for the all-years estimates of each city rather for seasonal estimates further, which may reduce the adequacy and significance of the estimated seasonal effect. Of course, this also has its advantage in that the estimate of four seasonal effects can be put within a unified framework for directly comparison each other. Second, our analysis is based on the time series of each city, which cannot control for the individual characteristics such as age, sex and the regional demographic and socioeconomic features. Third, as in most previous time-series studies, we averaged pollutant measurements across monitors within a city. This results in measurement error, which is difficult to quantify, especially in 2-pollutant models. Fourth, as denoted in our previous study (Chen et al. 2014), the definitions and cutoffs of seasons may vary appreciably across regions, however, most of our cities are located in subtropical and warm temperate zones with an IQR of annual average temperature less than 5°C.
Conclusion
Our results have described that, on average, PM10 concentration significantly associated with CHD mortality in seven cities and overall China, the effect of which is smaller than those reported in developed countries or regions with lowly pollution level. The exposure-response relationships between PM10 and CHD mortality are nonlinear with threshold effect in four cities and positively linear in other three cities. The CHD mortality effects of particulate matter occur highly in hot summer and cold winter, but lowly in warm spring and cool fall. To our knowledge, this is the rare multicity epidemiological study in China to investigate the effect of particulate matter air
10
pollution on CHD mortality by using the threshold GAM approach. The sensitivity analyses in this study support the robustness of our results.
References
Bhaskaran, K, Hajat S, Haines A, Herrett E, Wilkinson P, Smeeth L. Effects of air pollution on the incidence of myocardial infarction. Heart. 2009;95(21):1746-1759.
Cesaroni, G, Forastiere F, Stafoggia M, Andersen ZJ, Badaloni C, Beelen R, Caracciolo B, de Faire U, Erbel R, Eriksen KT, Fratiglioni L. Long term exposure to ambient air pollution and incidence of acute coronary events: prospective cohort study and meta-analysis in 11 European cohorts from the ESCAPE Project. Bmj. 2014 Jan 21;348:f7412.
Chen, L.H.; Knutsen, S.F.; Shavlik, D.; Beeson, W.L.; Petersen, F.; Ghamsary, M.; Abbey, D. 2005, The Association between Fatal Coronary Heart Disease and Ambient Particulate Air Pollution: Are Females at Greater Risk?;
Environ. Health Perspect. 2005, 113, 1723-1729.
Chen, Renjie, Jing Cai, Xia Meng, Ho Kim, Yasushi Honda, Yue Leon Guo, Evangelia Samoli, Xin Yang, and Haidong Kan, 2014, Ozone and Daily Mortality Rate in 21 Cities of East Asia: How Does Season Modify the Association?
American Journal of Epidemiology, Vol. 180, No. 7, 729-736.
Chen, Xiaoyu, Shuai Shao, Zhihua Tian, Zhen Xie, Peng Yin, Impacts of air pollution and its spatial spillover effect on public health based on China's big data sample, Journal of Cleaner Production, accepted and in press, available online 7 March 2016, http://dx.doi.org/10.1016/j.jclepro.2016.02.119.
Chiu, HF, Peng CY, Wu TN, Yang CY. Short-term effects of fine particulate air pollution on ischemic heart disease hospitalizations in Taipei: a case-crossover study. Aerosol Air Qual Res. 2013 Oct 1;13:1563-9.
Dai, Jinping, Renjie Chen, Xia Meng, Changyuan Yang, Zhuohui Zhao, Haidong Kan, 2015, Ambient air pollution, temperature and out-of-hospital coronary deaths in Shanghai, China, Environmental Pollution 203 (2015) 116-121.
Dai, L, Zanobetti A, Koutrakis P, Schwartz JD. Associations of fine particulate matter species with mortality in the United States: a multicity time-series analysis. Environmental Health Perspectives (Online). 2014 Aug 1;122(8):837.
Jerrett, M.; Burnett, R.T.; Ma, R.; Pope, C.A., III; Krewski, D.; Newbold,K.B.; Thurston, G.; Shi, Y.; Finkelstein, N.;
Calle, E.E.; Thun, M.J. 2005, Spatial Analysis of Air Pollution and Mortality in Los Angeles; Epidemiol. 2005, 16, 727-736.
Kan, Hai-dong, Tang-chun Wu, Ambient air pollution and human health in China: the past and future, Academic Journal of Second Military Medical University, 2013, 34 (7), 697-699.
Kim, H, Kim Y, Hong YC. The lag-effect pattern in the relationship of particulate air pollution to daily mortality in Seoul, Korea. International journal of biometeorology. 2003 Sep 1;48(1):25-30.
11
Kim, SY, Lee JT, Hong YC, et al. Determining the threshold effect of ozone on daily mortality: an analysis of ozone and mortality in Seoul, Korea, 1995–1999. Environ Res. 2004; 94(2):113–119.
Li, Huichu, Renjie Chen, Xia Meng, Zhuohui Zhao, Jing Cai, Cuicui Wang, Changyuan Yang, Haidong Kana, 2015, Short-term exposure to ambient air pollution and coronary heart disease mortality in 8 Chinese cities, International Journal of Cardiology 197 (2015) , 265–270.
Li, G, Zeng Q, Pan X. Disease burden of ischaemic heart disease from short-term outdoor air pollution exposure in Tianjin, 2002–2006. European journal of preventive cardiology. 2016 May 18:2047487316651352.
Lozano, R., M. Naghavi, K. Foreman, et al., Global and regional mortality from 235 causes of death for 20 age groups in 1990 and 2010: a systematic analysis for the Global Burden of Disease Study 2010, Lancet 380 (2013) 2095–2128.
Mate, T, Guaita R, Pichiule M, Linares C, Diaz J. Short-term effect of fine particulate matter (PM 2.5) on daily mortality due to diseases of the circulatory system in Madrid (Spain). The Science of the total environment 2010;408(23):5750-5757.
Mustafic, Hazrije, Patricia Jabre, Christophe Caussin, Mohammad H. Murad, Sylvie Escolano, Muriel Tafflet,Marie-Cecile Perier,Eloi Marijon, Dewi Vernerey, Jean-Philippe Empana, Xavier Jouven, 2012, Main Air Pollutants and Myocardial Infarction: A Systematic Review and Meta-analysis, Journal of American Medical Association, Vol 307, No. 7, 713-721.
Peng, RD, Samoli E, Pham L, et al. Acute effects of ambient ozone on mortality in Europe and North America:
results from the APHENA Study. Air Qual Atmos Health. 2013;6(2): 445–453.
Pope, III, C. Arden, Douglas W. Dockery, 2006, Health Effects of Fine Particulate Air Pollution: Lines that Connect, Journal of the Air & Waste Management Association, 56:6, 709-742.
San Tam, WW, Wong TW, Wong AH. Association between air pollution and daily mortality and hospital admission due to ischaemic heart diseases in Hong Kong. Atmospheric Environment. 2015 Nov 30;120:360-8.
Serinelli, M, Vigotti MA, Stafoggia M, Berti G, Bisanti L, Mallone S, Pacelli B, Tessari R, Forastiere F. Particulate matter and out-of-hospital coronary deaths in eight Italian cities. Occupational and environmental medicine. 2010 May 1;67(5):301-6.
Ueda, K, Nitta H, Ono M. Effects of fine particulate matter on daily mortality for specific heart diseases in Japan.
Circulation Journal. 2009;73(7):1248-54.
Xie, W, Gang Li,2 Dong Zhao,et al. 2014, Relationship between fine particulate air pollution and ischaemic heart disease morbidity and mortality, Heart 2014;0:1–7. doi:10.1136/heartjnl-2014-306165.
Yang, G., Y. Wang, Y. Zeng, et al., Rapid health transition in China, 1990–2010: findings from the Global Burden of Disease Study 2010, Lancet 381 (2013) 1987–2015.
12
Ye, X, Peng L, Kan H, Wang W, Geng F, Mu Z, Zhou J, Yang D. Acute Effects of Particulate Air Pollution on the Incidence of Coronary Heart Disease in Shanghai, China. PloS one. 2016 Mar 4;11(3):e0151119.
Zanobetti, A, Schwartz J. The effect of fine and coarse particulate air pollution on mortality: a national analysis.
Environmental health perspectives 2009;117(6):898-903.
Tables and Figures
13
Table 1 Basic Descriptive Statistics for seven cities in China
Cities Study
Dates
Number of Observations
Mean No.
of CHD deaths
Mean PM10 Level, μg/m3 Mean
Temperature
Mean Humidity All Years Spring Summer Fall Winter
Shanghai 2001-2004 1461 16.8 100.2 110.2 80.9 95.3 114.4 17.7 72.9 Suzhou 2005-2008 1461 1.5 88.4 100.3 72.6 90.1 90.6 17.2 77.0 Shenyang 2005-2008 1461 13.4 113.6 114.7 100.1 104.9 134.8 8.2 65.4 Taiyuan 2004-2008 1827 2.6 130.8 145.0 112.1 127.1 138.9 11.2 55.1 Tangshan 2006-2008 1096 3.6 97.6 99.7 81.1 91.8 118.2 12.6 60.5 Xi’an 2004-2008 1827 7.2 130.8 128.6 105.4 125.4 164.4 13.4 66.5 Hong Kong 1996-2002 2557 12.0 51.4 50.2 33.2 57.7 65.0 23.7 77.9
Overall 11690 8.1 101.8 107.0 83.7 98.9 118.0 14.9 67.9
14
Figure 1 The nonlinear exposure-response relationship curves between current and previous 2-day moving average PM10 concentration and daily CHD mortality for four cities as estimated by the cubic ns model in all the years. X-axis: the range of daily PM10 concentrations from 0 to 0.90 quantile of PM10 concentration of each city; Y-axis: the percentage increase of daily CHD mortality in associated with a 10μg/m3 increase of 2-day moving average PM10 concentration for each city.
15
Table 2 Model Choice and Estimated Percent Increase of Daily CHD Mortality Associated with an 10μg/m3 Increase of PM10 (Lag 0-1) in Chinese Seven Cities
Cities Model Choice All Years Spring Summer Fall Winter
Model AIC Threshold Estimate 95% PI Estimate 95% PI Estimate 95% PI Estimate 95% PI Estimate 95% PI Shanghai Threshold -286 54 0.51 -0.04 , 1.05 0.65 -0.47 , 1.76 0.22 -1.21 , 1.65 0.14 -0.95 , 1.24 0.37 -0.55 , 1.29
Suzhou Threshold 3393 50 0.74 -1.53 , 3.01 1.08 -3.45 , 5.61 0.24 -6.07 , 6.55 -1.49 -6.26 , 3.28 2.08 -2.08 , 6.25
Shenyang Linear 0.38 -0.29 , 1.05 0.58 -0.79 , 1.95 -0.09 -1.63 , 1.46 0.20 -1.17 , 1.57 0.14 -1.24 , 1.52
Taiyuan Threshold 3639 59 0.47 -0.72 , 1.67 0.90 -1.34 , 3.15 0.09 -2.89 , 3.08 0.55 -1.90 , 2.99 0.98 -1.12 , 3.08
Tangshan Linear 1.76 -0.09 , 3.60 0.40 -2.58 , 3.38 2.93 -2.77 , 8.63 3.64 -1.08 , 8.36 2.09 -0.87 , 5.05
Xian Threshold 1095 108 1.55 0.18 , 2.92 2.62 0.13 , 5.12 2.94 -2.44 , 8.33 2.06 -0.70 , 4.83 0.30 -2.14 , 2.74
Hong Kong Linear 1.19 0.17 , 2.22 0.40 -1.60 , 2.41 3.57 1.11 , 6.02 1.08 -0.93 , 3.09 2.00 0.12 , 3.87
Overall 0.81 -0.04 1.67 0.85 -0.52 2.22 1.15 -1.52 3.82 0.69 -1.07 2.45 0.89 -0.56 2.35
Abbreviation: PI, posterior interval
16
Figure 2 Sensitivity test of different degree of freedom of trend variable when analyzing the effect of PM10 on daily CHD mortality in this study
17
Figure 3 Percent increase (posterior mean and 95% posterior intervals) of daily CHD mortality associated with a 10μg/m3 increase of PM10 at alternative lag days in seven cities of China.
18
Figure 4 Percent increase (posterior mean and 95% posterior intervals) of daily CHD mortality associated with a 10μg/m3 increase of PM10, adjusted for co-pollutants in 2-pollutant models in seven cities of China. Dashes under the x-axis indicate results obtained from single-pollutant models of PM10.
19
Table 3 Effect estimates of particulate matter air pollution on CHD mortality in studies from America, Europe and Asia
Authors Location Periods Objects Pollutant Threshold Seasonality Mean
Concentration
(μg/m3) Effect Estimates (%)
Dai et al. (2014) 75 cities, US 2000-2006 MI PM2.5 No Yes 13.30 1.22 (0.62, 1.82)
Jerrett et al. (2005) Los Angeles, US 1982-2000 IHD PM2.5 No No NA 1.24-1.6
Zanobetti and Schwartz
(2009) 112 cities, US 1999-2005 MI PM2.5 No Yes 6.7-24.9 1.18 (0.48, 1.89)
Cesaroni et al. (2014) 5 countries, Europe 1997-2007 CHD PM10;PM2.5 Yes No 14-48;7-17 12;26
Forastiere et al. (2005) Rome, Italy 1998-2000 CHD PM10 No No 52.10 2.1 (0.2,4.0)
Mate et al. (2010) Madrid, Spain 2003-2005 IHD PM2.5 No Yes 19.16 6.8 (3.2, 10.5)
Serinelli et al. (2010) 8 cities, Italy 1997-2004 OHCD PM10 No No 34.8-71.5 1.46 (0.50, 2.43)
Dai et al. (2015) Shanghai, China 2006-2011 OHCD PM10;PM2.5 No No 92;55 0.49 (0.11, 0.88);0.68
(0.14, 1.21)
Li et al. (2015) 8 cities, China 1996-2008 CHD PM10 No Yes 52-136l 0.36 (0.12, 0.61)
Li et al. (2016) Tianjin, China 2002-2006 IHD PM10 No No 125.60 4.2 (1.5, 6.9) IQR
Xie et al. (2014) Beijing, China 2010-2012 IHD PM2.5 No No 96.20 0.25 (0.10, 0.40)
Ye et al. (2016) Shanghai, China 2005-2012 CHD PM10;
PM2.5 No Yes 81.7; 38.6 0.23 (0.12, 0.34); 0.74
(0.44, 1.04)
San Tam et al. (2015) Hong Kong 2001-2010 IHD PM10;
PM2.5 No No 53.2;37.8 1.012 (1.006, 1.019);1.018
(1.010, 1.025)
Chiu et al. (2013) Taipei 2006-2010 IHD PM2.5 No No 29.99 1.12 (1.10-1.14) IQR
Ueda et al. (2009) 9 Japanese cities 2002-2004 MI PM2.5 No No 13.2-21.8 1.32 (-0.82, 3.50)
Kim et al. (2003) Seoul, Korea 1995-1999 MI PM10 No No 69.19 4.9 (-3.4, 13.9) IQR
This study 7 cities, China 1996-2008 CHD PM10 Yes Yes 101.8 0.81 (-0.04, 1.67)
Abbreviations: CHD, coronary heart disease; OHCD, out-of-hospital coronary deaths; IHD, ischaemic heart disease; MI, myocardial infarction.
Effect estimates are the percent increase of health effect associated with a 10 μg/m3 or an Interquartile-Range (IQR) increase of air pollution.
20
SFB 649 Discussion Paper Series 2016
For a complete list of Discussion Papers published by the SFB 649, please visit http://sfb649.wiwi.hu-berlin.de.
001 "Downside risk and stock returns: An empirical analysis of the long-run and short-run dynamics from the G-7 Countries" by Cathy Yi-Hsuan Chen, Thomas C. Chiang and Wolfgang Karl Härdle, January 2016.
002 "Uncertainty and Employment Dynamics in the Euro Area and the US" by Aleksei Netsunajev and Katharina Glass, January 2016.
003 "College Admissions with Entrance Exams: Centralized versus Decentralized" by Isa E. Hafalir, Rustamdjan Hakimov, Dorothea Kübler and Morimitsu Kurino, January 2016.
004 "Leveraged ETF options implied volatility paradox: a statistical study" by Wolfgang Karl Härdle, Sergey Nasekin and Zhiwu Hong, February 2016.
005 "The German Labor Market Miracle, 2003 -2015: An Assessment" by Michael C. Burda, February 2016.
006 "What Derives the Bond Portfolio Value-at-Risk: Information Roles of Macroeconomic and Financial Stress Factors" by Anthony H. Tu and Cathy Yi-Hsuan Chen, February 2016.
007 "Budget-neutral fiscal rules targeting inflation differentials" by Maren Brede, February 2016.
008 "Measuring the benefit from reducing income inequality in terms of GDP"
by Simon Voigts, February 2016.
009 "Solving DSGE Portfolio Choice Models with Asymmetric Countries" by Grzegorz R. Dlugoszek, February 2016.
010 "No Role for the Hartz Reforms? Demand and Supply Factors in the German Labor Market, 1993-2014" by Michael C. Burda and Stefanie Seele, February 2016.
011 "Cognitive Load Increases Risk Aversion" by Holger Gerhardt, Guido P.
Biele, Hauke R. Heekeren, and Harald Uhlig, March 2016.
012 "Neighborhood Effects in Wind Farm Performance: An Econometric Approach" by Matthias Ritter, Simone Pieralli and Martin Odening, March 2016.
013 "The importance of time-varying parameters in new Keynesian models with zero lower bound" by Julien Albertini and Hong Lan, March 2016.
014 "Aggregate Employment, Job Polarization and Inequalities: A Transatlantic Perspective" by Julien Albertini and Jean Olivier Hairault, March 2016.
015 "The Anchoring of Inflation Expectations in the Short and in the Long Run" by Dieter Nautz, Aleksei Netsunajev and Till Strohsal, March 2016.
016 "Irrational Exuberance and Herding in Financial Markets" by Christopher Boortz, March 2016.
017 "Calculating Joint Confidence Bands for Impulse Response Functions using Highest Density Regions" by Helmut Lütkepohl, Anna Staszewska- Bystrova and Peter Winker, March 2016.
018 "Factorisable Sparse Tail Event Curves with Expectiles" by Wolfgang K.
Härdle, Chen Huang and Shih-Kang Chao, March 2016.
019 "International dynamics of inflation expectations" by Aleksei Netšunajev and Lars Winkelmann, May 2016.
020 "Academic Ranking Scales in Economics: Prediction and Imdputation" by Alona Zharova, Andrija Mihoci and Wolfgang Karl Härdle, May 2016.
SFB 649, Spandauer Straße 1, D-10178 Berlin http://sfb649.wiwi.hu-berlin.de
This research was supported by the Deutsche
Forschungsgemeinschaft through the SFB 649 "Economic Risk".
SFB 649, Spandauer Straße 1, D-10178 Berlin http://sfb649.wiwi.hu-berlin.de
This research was supported by the Deutsche
Forschungsgemeinschaft through the SFB 649 "Economic Risk".
SFB 649 Discussion Paper Series 2016
For a complete list of Discussion Papers published by the SFB 649, please visit http://sfb649.wiwi.hu-berlin.de.
021 "CRIX or evaluating blockchain based currencies" by Simon Trimborn and Wolfgang Karl Härdle, May 2016.
022 "Towards a national indicator for urban green space provision and environmental inequalities in Germany: Method and findings" by Henry Wüstemann, Dennis Kalisch, June 2016.
023 "A Mortality Model for Multi-populations: A Semi-Parametric Approach"
by Lei Fang, Wolfgang K. Härdle and Juhyun Park, June 2016.
024 "Simultaneous Inference for the Partially Linear Model with a Multivariate Unknown Function when the Covariates are Measured with Errors" by Kun Ho Kim, Shih-Kang Chao and Wolfgang K. Härdle, August 2016.
025 "Forecasting Limit Order Book Liquidity Supply-Demand Curves with Functional AutoRegressive Dynamics" by Ying Chen, Wee Song Chua and Wolfgang K. Härdle, August 2016.
026 "VAT multipliers and pass-through dynamics" by Simon Voigts, August 2016.
027 "Can a Bonus Overcome Moral Hazard? An Experiment on Voluntary Payments, Competition, and Reputation in Markets for Expert Services"
by Vera Angelova and Tobias Regner, August 2016.
028 "Relative Performance of Liability Rules: Experimental Evidence" by Vera Angelova, Giuseppe Attanasi, Yolande Hiriart, August 2016.
029 "What renders financial advisors less treacherous? On commissions and reciprocity" by Vera Angelova, August 2016.
030 "Do voluntary payments to advisors improve the quality of financial advice? An experimental sender-receiver game" by Vera Angelova and Tobias Regner, August 2016.
031 "A first econometric analysis of the CRIX family" by Shi Chen, Cathy Yi- Hsuan Chen, Wolfgang Karl Härdle, TM Lee and Bobby Ong, August 2016.
032 "Specification Testing in Nonparametric Instrumental Quantile Regression" by Christoph Breunig, August 2016.
033 "Functional Principal Component Analysis for Derivatives of Multivariate Curves" by Maria Grith, Wolfgang K. Härdle, Alois Kneip and Heiko Wagner, August 2016.
034 "Blooming Landscapes in the West? - German reunification and the price of land." by Raphael Schoettler and Nikolaus Wolf, September 2016.
035 "Time-Adaptive Probabilistic Forecasts of Electricity Spot Prices with Application to Risk Management." by Brenda López Cabrera , Franziska Schulz, September 2016.
036 "Protecting Unsophisticated Applicants in School Choice through Information Disclosure" by Christian Basteck and Marco Mantovani, September 2016.
037 "Cognitive Ability and Games of School Choice" by Christian Basteck and Marco Mantovani, Oktober 2016.
038 "The Cross-Section of Crypto-Currencies as Financial Assets: An Overview" by Hermann Elendner, Simon Trimborn, Bobby Ong and Teik Ming Lee, Oktober 2016.
039 "Disinflation and the Phillips Curve: Israel 1986-2015" by Rafi Melnick and Till Strohsal, Oktober 2016.
SFB 649, Spandauer Straße 1, D-10178 Berlin http://sfb649.wiwi.hu-berlin.de
This research was supported by the Deutsche
Forschungsgemeinschaft through the SFB 649 "Economic Risk".
SFB 649, Spandauer Straße 1, D-10178 Berlin http://sfb649.wiwi.hu-berlin.de
This research was supported by the Deutsche
Forschungsgemeinschaft through the SFB 649 "Economic Risk".
SFB 649 Discussion Paper Series 2016
For a complete list of Discussion Papers published by the SFB 649, please visit http://sfb649.wiwi.hu-berlin.de.
040 "Principal Component Analysis in an Asymmetric Norm" by Ngoc M. Tran, Petra Burdejová, Maria Osipenko and Wolfgang K. Härdle, October 2016.
041 "Forward Guidance under Disagreement - Evidence from the Fed's Dot Projections" by Gunda-Alexandra Detmers, October 2016.
042 "The Impact of a Negative Labor Demand Shock on Fertility - Evidence from the Fall of the Berlin Wall" by Hannah Liepmann, October 2016.
043 "Implications of Shadow Bank Regulation for Monetary Policy at the Zero Lower Bound" by Falk Mazelis, October 2016.
044 "Dynamic Contracting with Long-Term Consequences: Optimal CEO Compensation and Turnover" by Suvi Vasama, October 2016.
045 "Information Acquisition and Liquidity Dry-Ups" by Philipp Koenig and David Pothier, October 2016.
046 "Credit Rating Score Analysis" by Wolfgang Karl Härdle, Phoon Kok Fai and David Lee Kuo Chuen, November 2016.
047 "Time Varying Quantile Lasso" by Lenka Zbonakova, Wolfgang Karl Härdle, Phoon Kok Fai and Weining Wang, November 2016.
048 "Unraveling of Cooperation in Dynamic Collaboration" by Suvi Vasama, November 2016.
049 "Q3-D3-LSA" by Lukas Borke and Wolfgang K. Härdle, November 2016.
050 "Network Quantile Autoregression" by Xuening Zhu, Weining Wang, Hangsheng Wang and Wolfgang Karl Härdle, November 2016.
051 "Dynamic Topic Modelling for Cryptocurrency Community Forums" by Marco Linton, Ernie Gin Swee Teo, Elisabeth Bommes, Cathy Yi-Hsuan Chen and Wolfgang Karl Härdle, November 2016.
052 "Beta-boosted ensemble for big credit scoring data" by Maciej Zieba and Wolfgang Karl Härdle, November 2016.
053 "Central Bank Reputation, Cheap Talk and Transparency as Substitutes for Commitment: Experimental Evidence" by John Duffy and Frank Heinemann, December 2016.
054 "Labor Market Frictions and Monetary Policy Design" by Anna Almosova, December 2016.
055 "A Multicity Study of Association between Air Pollution and CHD Mortality in China by Using Time Series Threshold Poisson Regression Model" by Xiaoyu Chen, December 2016.
SFB 649, Spandauer Straße 1, D-10178 Berlin http://sfb649.wiwi.hu-berlin.de
This research was supported by the Deutsche
Forschungsgemeinschaft through the SFB 649 "Economic Risk".
SFB 649, Spandauer Straße 1, D-10178 Berlin http://sfb649.wiwi.hu-berlin.de
This research was supported by the Deutsche
Forschungsgemeinschaft through the SFB 649 "Economic Risk".