Figure 1: The structure function F2 as a function ofxfor various Q2 values, exhibiting Bjorken scaling, taken from [Ellis/Stirling/Webber]
Figure 2: Parton distribution function set A from the Martin-Roberts-Stirling group, taken from [Ellis/Stirling/Webber]. Note that this uses the common notation of defining valence quark distri- butions, fuv ≡fu−fu¯, fdv ≡fd−fd¯.
1
0.1 0.15 0.2 0.25 0.3 0.35 0.4 0.45
αs(µ) DIS (Bj-SR) DIS (GLS-SR)τ decays QQ− states (lattice)ϒ decays e+ e− (σhad)
pp(−)→bb−X, γX
e+ e− (jet & event-shape) e+ e− (σhad) e+ e− (jet & event-shape) e+ e− (Z width) e+ e− (jet & event-shape) N3LO N2LO NLO
0.11 0.12 0.13
1 10 102
DIS (e/µ; F2)
[1.9–15.2]
µ scale (GeV) αs(MZ)
Figure 3: Results of a recent compilation of αS values, see [arXiv:0803.0979 [hep-ph], arXiv:hep- ex/0606035]. The scale dependence shows excellent agreement with the predictions of perturbative QCD over a wide energy range. When translated into measurements of αS(Mz), the separate measurements cluster strongly around the average value,αS(Mz) = 0.1204±0.0009
1 10
F
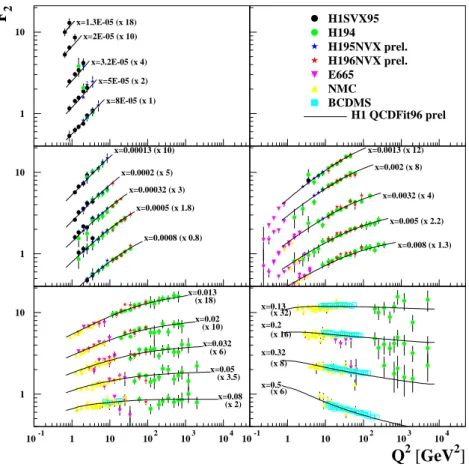
2x=1.3E-05 (x 18) x=2E-05 (x 10) x=3.2E-05 (x 4)
x=5E-05 (x 2) x=8E-05 (x 1)
H1SVX95 H194
H195NVX prel.
H196NVX prel.
E665 NMC BCDMS
H1 QCDFit96 prel
1 10
x=0.00013 (x 10) x=0.0002 (x 5) x=0.00032 (x 3)
x=0.0005 (x 1.8)
x=0.0008 (x 0.8)
x=0.0013 (x 12) x=0.002 (x 8)
x=0.0032 (x 4) x=0.005 (x 2.2)
x=0.008 (x 1.3)
1 10
10-1 1 10 102 103 104
x=0.013 (x 18) x=0.02
(x 10) x=0.032
(x 6) x=0.05
(x 3.5) x=0.08 (x 2)
10-1 1 10 102 103 104
Q
2[GeV
2]
x=0.13 (x 32) x=0.2
(x 16) x=0.32
(x 8) x=0.5
(x 6)
Figure 4: Fit to theF2data over a wide range ofQ2values, exhibiting violation of Bjorken scaling
2
![Figure 1: The structure function F 2 as a function of x for various Q 2 values, exhibiting Bjorken scaling, taken from [Ellis/Stirling/Webber]](https://thumb-eu.123doks.com/thumbv2/1library_info/4744596.1619310/1.892.224.770.126.505/figure-structure-function-function-various-exhibiting-bjorken-stirling.webp)