Exercise Sheet No. 1
Introduction to General Relativity
Exercise Sheet No. 1
1. Tensor Operations
a) Let space be two dimensional, with coordinate (x1, x2). Suppose the tensors Va, Wa, Pab, Qab and Mab are measured to have the values
V1 = 2, V2 = 3; W1 = 4, W2 = 5 (1) Pab =
2 −1
3 6
ab
; Qab =
0 2 4 7
ab
; Mab =
4 3 2 1
ab
. (2) Calculate the following tensors:
(1) α=VaWa (2) Tb =PabWa
(3) Fac =PabQbc (4) Gab =McbQca
b) Translate the following 3-vector identities into index notation, and prove them:
(1) A~·(B~ ×C) =~ B~ ·(C~ ×A) =~ C~ ·(A~×B)~ (2) ∇ ·(f ~A) =A~· ∇f +f∇ ·A~
(3) ∇ ·(A~×B) =~ B~ · ∇ ×A~−A~· ∇ ×B~
The cross product can be calculated using the three-dimensional total-antisymetric Levi-Civita symbol, which is defined as:
αβγ =
1 if αβγ is an even permutation of (1,2,3)
−1 if αβγ is an odd permutation of (1,2,3) 0 otherwise (two indices are equal)
(3)
Using matrix notation it can be displayed in three dimensions as:
αβ1 =
0 0 0
0 0 1
0 −1 0
; αβ2 =
0 0 −1 0 0 0 1 0 0
; αβ3 =
0 1 0
−1 0 0 0 0 0
(4) or in two dimensions as:
αβ =
0 1
−1 0
(5)
1
Exercise Sheet No. 1
In index notation the cross product can now be expressed as:
(A×B)α=αβγAβBγ (6)
c) LetSab andAabbe symmetric and anti-symmetric contravariant tensors. Show that Sab and Aab are symmetric and anti-symmetric as well.
d) Lets define the rank 3 tensor anti-symmetric tensor Aabc= 1
2 Vabc−Vcba
(7) And Aabc =−Acba. Show that TabAacb vanishes.
e) Show that Tabe =Tabcdeδde is a tensor.
f) Show that Tab=−Tba in one coordinate system it implies thatT0 ab =−T0 ba in all coordinate systems.
2. Mercator Projection
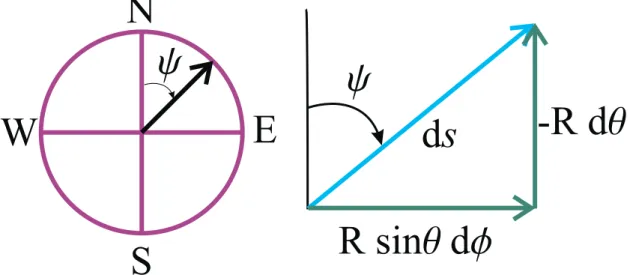
The Mercator projection is a cylindrical projection which aims to align compass bearings to constant directions on the map. In other words, if the angle between between a line of longitude and a great circle that intersect at some point on the Earth’s surface isφ, the Mercator projection’s aim is to ensure that the same angle φ is measured on the map.
Figure 1: A schematic visualization of the Mercator map projection. The angle ψ on the surface of the earth does not change when when mapping to a flat plane.
As in the cylindrical case, we start with the line element.
ds2 =R2 dθ2 + sin2θdφ2
, (8)
On the map however, dy=Rdθ and dx=Rsinθdφ
2
Exercise Sheet No. 1
a) Show that that if x= 2πwφ then y = w
2πlog
cot θ 2
(9)
b) Let us define a new variable ˆ
y ≡ 2π
wy = log
cot θ 2
(10) Show that sinθ = sech ˆy (Hint: use the definition of sech and other trigono- metric identiies).
c) With these choices of (x, y), show that the mercator line elements is:
ds2 =
2πR w
2
sech2yˆ dx2+ dy2
, (11)
and the Mercator metric:
gab =
2πR w
2
sech2yˆ 1 0
0 1
. (12)
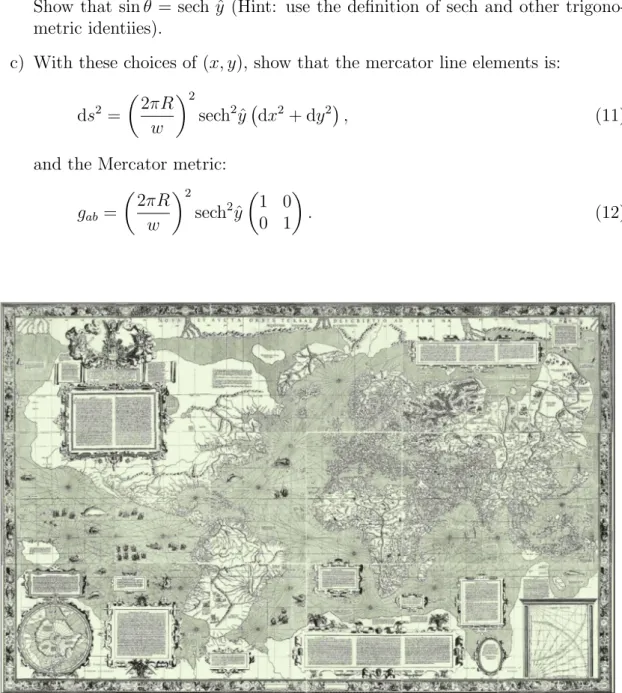
Figure 2: A Mercator projection of the earth from 1569.
3
Exercise Sheet No. 1
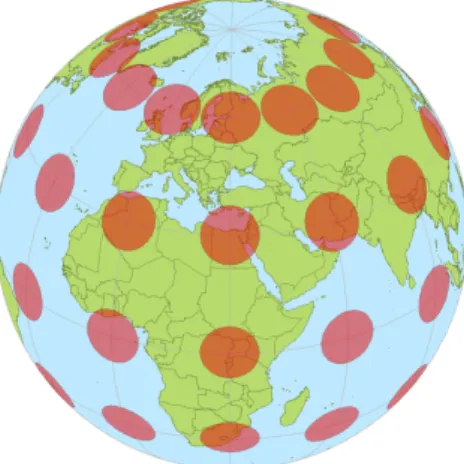
Figure 3: A Mercator projection of the earth including a measure of the distortion known as the “Tissots indicatrix”
4