Genetic alterations driving metastatic colony formation are acquired outside of the primary tumour in melanoma
Melanie Werner-Klein
1,2, Sebastian Scheitler
1,3, Martin Hoffmann
3, Isabelle Hodak
1, Klaus Dietz
4, Petra Lehnert
5, Veronika Naimer
1, Bernhard Polzer
3, Stef fi Treitschke
3, Christian Werno
3,
Aleksandra Markiewicz
1, Kathrin Weidele
3, Zbigniew Czyz
3, Ulrich Hohenleutner
6, Christian Hafner
6, Sebastian Haferkamp
6, Mark Berneburg
6, Petra Rümmele
7,8, Anja Ulmer
5& Christoph A. Klein
1,3Mouse models indicate that metastatic dissemination occurs extremely early; however, the timing in human cancers is unknown. We therefore determined the time point of metastatic seeding relative to tumour thickness and genomic alterations in melanoma. Here, we fi nd that lymphatic dissemination occurs shortly after dermal invasion of the primary lesion at a median thickness of ~0.5 mm and that typical driver changes, including BRAF mutation and gained or lost regions comprising genes like MET or CDKNA2 , are acquired within the lymph node at the time of colony formation. These changes de fi ne a colonisation signature that was linked to xenograft formation in immunode fi cient mice and death from melanoma. Thus, melanoma cells leave primary tumours early and evolve at different sites in parallel. We propose a model of metastatic melanoma dormancy, evolution and colonisation that will inform direct monitoring of adjuvant therapy targets.
DOI: 10.1038/s41467-017-02674-y
OPEN
1Experimental Medicine and Therapy Research, University of Regensburg, Franz-Josef Strauß Allee 11, 93053 Regensburg, Germany.2Regensburg Center for Interventional Immunology (RCI) and University Medical Center of Regensburg, Franz-Josef Strauß Allee 11, 93053 Regensburg, Germany.3Division of Personalized Tumor Therapy, Fraunhofer-Institute for Toxicology and Experimental Medicine, RegensburgAm Biopark 9, 93053, Germany.4Department of Medical Biometry, University of Tübingen, Silcherstr. 5, 72076 Tübingen, Germany.5Department of Dermatology, University of Tübingen, Liebermeisterstr.
25, 72076 Tübingen, Germany.6Department of Dermatology, University of Regensburg, Franz-Josef Strauß Allee 11, 93053 Regensburg, Germany.
7Department of Pathology, University of Regensburg, Franz-Josef Strauß Allee 11, 93053 Regensburg, Germany.8Institute of Pathology, University Hospital, Friedrich-Alexander-University Erlangen-Nürnberg, Krankenhausstr. 8-10, 91054 Erlangen, Germany. Melanie Werner-Klein, Sebastian Scheitler, and Martin Hoffmann contributed equally to this work. Anja Ulmer and Christoph A. Klein jointly supervised this work. Correspondence and requests for materials should be addressed to C.A.K. (email:Christoph.klein@ukr.de)
1234567890():,;
T he classical linear progression model1holds that metastases are generated from late-disseminating clones that geneti- cally resemble the predominant clone of the primary tumour (PT)
2,3, whereas parallel progression suggests dis- semination from early transformed lesions and acquisition of important genetic changes at the metastatic site
1. Parallel pro- gression gained substantial support by patient data
4,5and trans- genic mouse models
6–8, indicating that metastatic dissemination often occurs early. In mouse models, molecular mechanisms of early dissemination were identified and evidence was provided for a superior metastatic potential of early disseminated cancer cells (DCCs) compared to late DCCs
9,10. In patients, comparative sequencing of PTs and metastases revealed branched parallel progression in all cases tested, whereas no case followed linear progression
11. However, since clinical practice often derives therapy decisions from an assumed (based on a linear progression model) identity between accessible PTs and inaccessible meta- static seeds, a correct understanding of metastatic progression is essential. Surprisingly, despite high relevance for adjuvant therapies, which need to take into account the molecular het- erogeneity of DCCs and PTs
12, no study has ever investigated the relative time point of dissemination during tumour progression or assessed the evolutionary events during the early steps of metastasis, i.e., early colonisation, within target organs of patients.
In this study, we address both aspects in melanoma and lymph node metastasis because (i) overtly visible melanoma is often detected when tumour thickness is measured in micrometres, unlike late-detected cancers whose diameter is recorded in the range of centimetres and (ii) we recently developed a highly sensitive assay based on disaggregation and immunocytology to detect disseminated cancer cells in the sentinel lymph node (SLN). We demonstrated in more than 1000 patients
13that this method outperforms conventional histopathology and that gp100 is best suited (considering sensitivity and specificity) to detect melanoma cells
13,14. We now apply this assay to detect, isolate and characterise early metastatic seeds and their molecular pro- gression. We find that dissemination occurs very early and that early DCCs need to acquire important genetic alterations outside the PT to form metastatic colonies in patients or in xenografts.
Moreover, we identify for each DCC alteration the most likely site of its acquisition.
Results
Tumour thickness at dissemination and colony formation. To determine melanoma thickness at seeding and colonisation, we examined the clinical data from our previous studies
13,14, where we had established and validated a gp100-based detection method for single melanoma cells in SLNs of 1027 patients with clinically node-negative disease as assessed by palpation and ultrasound. Of these, 51% harboured gp100-positive cells
13, whereas we did not detect a single gp100-positive cell among 70 control samples.
Genetic analysis showed that 98% of randomly selected gp100- positive cells from SLNs harboured DNA sequence changes
13.
There was a weak positive correlation (Spearman’s ρ = 0.18, p
< 0.0001, n = 1027) between PT thickness and disseminated cancer cell density (DCCD; defined as the number of gp100- positive cells per million cells in disaggregated SLNs). The percentage of patients with gp100-positive SLNs increased only marginally from T1 (≤1 mm) to T4 (>4 mm) tumours (T1:
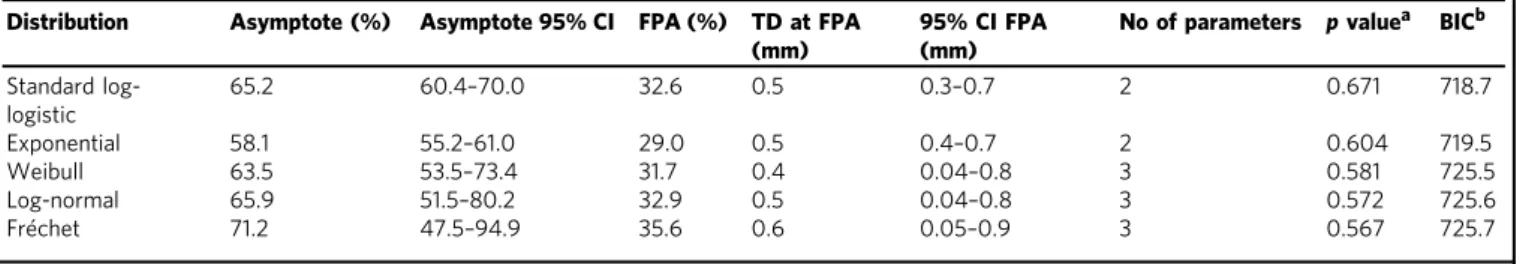
45.8%, T2: 47.4%, T3: 54.9% and T4: 59.4%), suggesting that dissemination occurs preferentially early. We used the nonpara- metric Turnbull method to determine thickness at dissemination and compared five different parametric models for best fit. While all models largely concurred (Table 1a), a standard log-logistic model outperformed the other approaches (Table 1a). These analyses revealed that (i) lymphatic dissemination was restricted to 65.2% of all patients and that (ii) in 50% of these cases cancer cells had spread before tumours reached a thickness of 0.5 mm (95% CI: 0.3–0.7 mm; Fig. 1a). In sum, our data show that ~1/3 of all melanomas disseminated lymphatically at a tumour thickness
of <0.5 mm, ~1/3 at a thickness ≥0.5 mm and ~1/3 were not
capable of lymphatic spread.
We asked at what tumour thickness DCCs would have grown to a colony in SLNs. In all cases, we split the SLNs and analysed one half by histopathology (preserving the architecture) and the other by gp100 immunocytology after disaggregation (destroying the architecture but enabling quantification; for details, see ref.
Table 1 Identification of bestfitting model for tumour thickness at dissemination and colonisation
(a) Tumour thickness at dissemination
Distribution Asymptote (%) Asymptote 95% CI FPA (%) TD at FPA (mm)
95% CI FPA (mm)
No of parameters pvaluea BICb Standard log-
logistic
65.2 60.4–70.0 32.6 0.5 0.3–0.7 2 0.671 718.7
Exponential 58.1 55.2–61.0 29.0 0.5 0.4–0.7 2 0.604 719.5
Weibull 63.5 53.5–73.4 31.7 0.4 0.04–0.8 3 0.581 725.5
Log-normal 65.9 51.5–80.2 32.9 0.5 0.04–0.8 3 0.572 725.6
Fréchet 71.2 47.5–94.9 35.6 0.6 0.05–0.9 3 0.567 725.7
(b) Tumour thickness at colonisation Distribution TD15 colonisation
(mm)
95% CI TD15 (mm)
TD50 Colonisation (mm)
95% CI TD50 (mm)
No of parameters pvaluea BICb
Exponential 2.4 2.0–3.1 10.3 8.4–13.0 1 0.31 210.1
Standard log- logistic
2.4 1.9–3.1 13.4 10.5–17.1 1 0.28 210.8
Fréchet 2.3 1.9–2.8 11.1 7.3–21.4 2 0.32 215.4
Log-normal 2.4 2.0–2.9 9.7 6.9–17.0 2 0.25 215.6
Weibull 2.5 2.0–3.1 8.9 6.8–14.2 2 0.18 216.0
FPA50% of asymptote,TDtumour thickness,TD15tumour thickness at 15% colonisation,TD50tumour thickness at 50% colonisation,CIconfidence interval,BICBayes information criterion aFor goodness offit comparing model predictions with observed values (see methods)
bLowest BIC identifies best model
13
). To establish a DCCD representative for colonisation, as opposed to early dissemination (first arrival), we compared both halves of a patient’s SLN. Analysing histopathological detection rates vs. DCCD for 494 patients
14, we had noted before that histopathological detection of cancer cells was associated with a DCCD of 100 in 50% of cases (see ref.
14). We therefore analysed 65 unselected, consecutive cases with a positive DCCD of up to 100, expecting that first colonies may become detectable slightly below this value. We assessed whether the SLN half screened by
standard and immune histopathology contained so called isolated tumour cells (ITC; <0.2 mm or <200 cells) or larger lesions, i.e., micrometastases (Fig. 1b and Supplementary Fig. 4a). Of the 65 cases, 50 (77%) were negative by standard and immune histopathology, 10 (15%) harboured ITC and 5 (8%) micro- metastases. Interestingly, the median DCCD of histopathologi- cally negative and of ITC samples were 1 and 4, respectively, whereas micrometastatic lesions displayed a median DCCD of 74 in the half analysed by immunocytology (Fig. 1c). Thus, it seems
e f
0.002 0.01 0.1 1
Hazard rate (per mm)
1 10 20
0.5 0.7 3 5 7
Tumour thickness (mm)
0%
25%
50%
75%
100%
Melanoma-specific survival propability 0
Time (months)
T1 T2 T3
T4
p < 0.0001
12 24 36 48 60 72 84
a d
LN135 (S100)LN168 (S100)
LN10 (S100)LN72 (MelanA)LN154 (H&E) LN89 (MelanA)
DCCD ≤100100< DCCD ≤1000DCCD >1000
5000 μm 5000 μm
2000 μm 200 µm
200 μm
5000 μm
5000 μm
10000 μm
200 μm
500 μm
1 2 1 3
3 2
100 μm
3
3 3
Negative by standard and immune
histophathology (%) ITCa Micrometastasis Number of patients with
0<DCCD<100 (n=65)
50 (77%) 10 (15%) 5 (8%)
Median DCCD (range) 1 (1–61) 4 (1–65) 74 (12–93)
aITC, isolated tumour cells as defined in L.H. Sobin, Ch. Wittekind, M.K. Gospodarowicz (eds.):
TNM classification of Malignant Tumours, 2009, 7th Edition, Wiley Blackwell, ISBN: 978-1-4443-3241-4
c
0%
25%
50%
75%
100%
15%
0.4 0.6 0.81 2 3 4 6 8 10
Tumour thickness (mm) until first colonization of SLN Cumulative propability of colonization
2.0 2.4 3.1 65.2%
95% CI of fit
Turnbull estimate 30%
70%
Cumulative probability of dissemination
0.1 0.2 0.4 0.6 1 3 5 7 10
Tumour thickness (mm) until first dissemination to SLN 0.5 0.7
0.3
Standard log-logistic fit 50%
10%
32.6%=65.2%/2
Dissemination
Colonization
b
95% CI of fit Turnbull estimate
Exponential
500 μm
200 μm
safe to conclude that colonisation, understood as micrometastasis formation, occurs at a DCCD of ~100, whereas samples with lower DCCD comprise melanoma cells before colony outgrowth.
Of the 525 DCC-positive patients, the proportion of samples with a DCCD > 100 increased with tumour thickness. An exponential distribution function provided best fit (Fig. 1d and Table 1b). Median thickness at colonisation (10.3 mm) was about 20 times higher than at seeding. We noted that the risk of de novo tumour seeding steadily decreased as tumours grew, while the risk of de novo colonisation did not depend on tumour thickness (Fig. 1e)
Discrepancy between dissemination and survival. Patients with T1 and T4 stage melanomas differed by only 13.6% for gp100- positive SLNs (38/83 (45.8%) vs. 79/133 (59.4%), respectively). To explore how this marginal difference in DCC positivity is linked to survival, we asked how many patients had died during the median follow-up period of 49 months (range, 3–123 months), with 370 (36%) patients having a follow-up of ≥5 years. Only 1/83 (1.2%) DCC-positive T1 stage melanoma patient died, consistent with previous studies
15,16. In contrast, 47/133 (35.3%) of T4 stage cases harbouring DCCs died (Fig. 1f; 9-year survival 88.9% for T1, and 45.9% for T4; p < 0.0001, log-rank test). Thus, there is a discrepancy between T1 and T4 stage melanomas regarding seeding and death. Nevertheless, for the total cohort of patients, each DCC increased the risk of death
13.
Genetic lineages of PTs and DCCs. The standard approach to addressing outcome-associated differences between T1 and T4 melanomas employs PT tissue. It assumes that the molecular characteristics of metastasis-initiating DCCs can be identified using the PT, because PTs and DCCs are thought to be largely identical. To test this assumption, we compared the genomic profiles of PTs and their matched DCCs from SLNs.
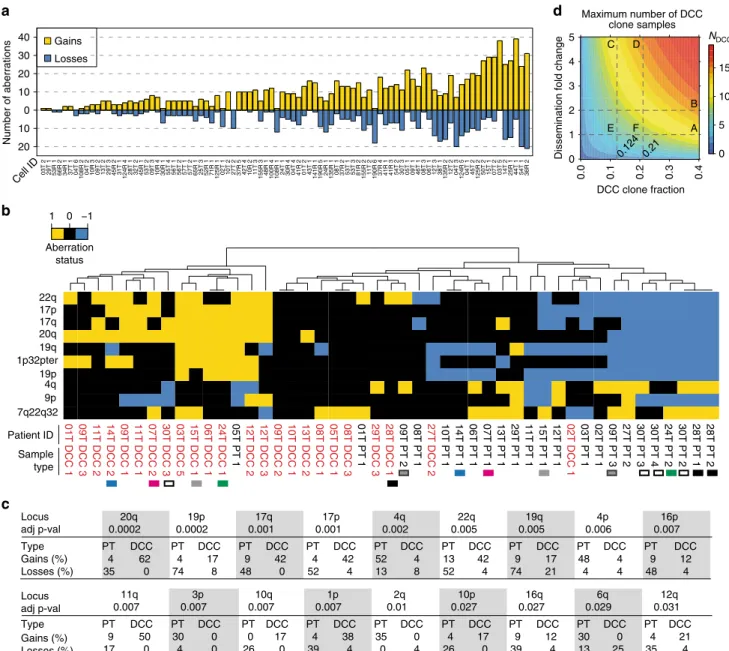
We first assessed the genomes of disseminated melanoma cells in a subset of 61 patients (Supplementary Fig. 1 and Supplementary Table 1) of which high-quality genomic DNA of DCCs was available for molecular analysis (in total, 91 individual DCCs). Inclusion criteria are summarised in Supplementary Fig. 1. The malignant origin of each included DCC was confirmed by comparative genomic hybridization (CGH; Fig. 2a) or targeted sequencing for BRAF/NRAS. DCCs were found to display a large range of copy number variations ranging from 1 to 52 per cell (Fig. 2a; median = 14; interquartile range = 14.8). We noted that genomic gains per cell (median = 9; range, 0–39) were more frequent than losses (median 3.5; range, 0–21). As a control, we isolated 30 single leukocytes and performed CGH analysis (Supplementary Fig. 2) with none of the control cells displaying any aberration (p < 0.0001; Fisher’s exact test).
Next, DNA from available PTs of these patients was isolated by laser microdissection (Supplementary Fig. 4b) and whenever possible several areas were analysed. However, compared to other cancers such as kidney cancer
17, early stage melanomas are very small, often technically precluding the assessment of subclones from different areas. Microdissected PT samples (n = 23, 19 patients) and micromanipulator-isolated single DCCs (n = 24, 19 patients) were analysed by CGH (Supplementary Fig. 3).
Regardless of melanoma thickness, there was a striking disparity between PTs and matched DCCs (Fig. 2b). Unexpectedly, PTs from different individuals clustered closer together than indivi- dual PTs and their matched DCCs (Fig. 2b and Supplementary Fig. 5). Interestingly, PTs displayed significantly more deletions than DCCs (Fig. 2b, c and Supplementary Fig. 5; p = 0.003, Mann–Whitney U test). The corresponding difference in gains was clearly nonsignificant (p = 0.66, Mann–Whitney U test).
When several areas from the same PTs were available, we noted genomic heterogeneity, however they still clustered together (for example 28T, 30T and 09T in Fig. 2b and Supplementary Fig. 5) apart from their paired DCCs.
The observed disparity between PTs and DCCs may result from two scenarios: (i) the isolated DCCs represent hidden subclones within the PT that still exist at the time of surgery and from which dissemination may have occurred late (scenario 1) or (ii) the DCCs disseminated early and represent genomic states that have become extinct within the primary site by later selective sweeps (scenario 2). We investigated the 19 matched patient samples assuming that each DCC derives from one of the PT areas selected according to highest similarity (i.e., maximum support for scenario 1; see 'Methods' section for details). For defining a detection threshold, we supposed that an aberration must be present in at least 60% of cells in the corresponding PT sample analysed by CGH
18. To obtain a conservative estimate of how many of our DCC samples could derive from DCC-identical subclones within the PT, i.e., conform to scenario 1, we derived maximum DCC subclone percentages that are still consistent with the respective PT bulk measurement results for all loci.
Depending on the individual patient, these maximum percentages ranged between 10 and 40%. We then calculated the maximum number of DCCs that could derive from the hidden clones on an α = 0.05 significance level. We found that a maximum of 11/24 DCC samples could possibly result from DCC-identical subclones within the PT if their corresponding subclone fractions are indeed maximal, i.e., equal 10–40% depending on the individual patient (Fig. 2d). In case of rarer DCC subclones, one must assume that they disseminate several fold more successfully than the remaining (i.e., non-DCC like) PT clones. For example, if a DCC subclone displays a fivefold higher successful dissemination propensity, it may not exceed a frequency of 12.4% for the same maximum of 11/24 subclone-derived DCCs. Consequently, SLN
Fig. 1Dissemination of melanoma cells as function of tumour thickness.aYellow function: estimated cumulative probability of dissemination as a function of tumour thickness (Turnbull) (n=1027 patients). Blue line: Standard log-logistic distribution incorporating a fraction of patients without long-term dissemination (95% CI: blue dashed lines). Upper black dashed line: only 65.2% of melanomas disseminate lymphatically (95% CI: 60.4–70.0%). Fifty percent of this value (32.6%) provides the median thickness (0.5 mm, 95% CI: 0.3–0.7 mm) of disseminating melanomas (lower black dashed line).b Comparative analysis of histopathological and immuncytological SLN halves. Displayed are representative examples with immunocytological scores of DCCD≤100, 100<DCCD≤1000 and DCCD>1000. Samples LN 72 and LN 89 are stained against melan A LN 10, LN 135 and LN 168 against S100. LN 154 shows a highly pigmented melanoma in H&E staining. A close-up of the subcapsular region 3 is shown in the mainfigure; more central or core regions 1 and 2, see Supplementary Fig.4a for higher magnification.cEvaluation of histopathologicalfindings in corresponding sections of samples with a positive DCCD<100.dPercentage of DCC-positive patients (n=525) with colonisation (DCCD>100) according to the Turnbull estimate (yellow). The percentage of colonisation (blue curve, 95% CI blue dashed curves) is described by a cumulative exponential distribution function (median 10.3 mm; 95%
CI: 8.4–13.0 mm).eHazard functions for dissemination (yellow line), and colonisation (blue line) describing the instantaneous risk per unit thickness for an event (dissemination,n=1027; colonisation,n=525) for those tumours, for which it has not yet occurred (de novo dissemination/ colonisation).fSurvival analysis of melanoma patients (n=1027) according to T stage (T1:≤1 mm (n=83); T2: 1.01–2.0 mm (n=496); T3: 2.01–4.0 mm (n=315); T4:>4 mm thickness (n=133); log-rank test,p<0.001)
DCCs, displaying the identified karyotypes, may equally likely result from both scenarios, i.e. late dissemination from rare PT subclones (scenario 1) or and early dissemination (scenario 2) followed by selective extinction or somatic progression of the disseminating clone. However, if the DCC-like subclones indeed make up less than the respectively estimated maxima of 10–40%
of PT cells and display a dissemination ability similar to the
predominant (non-DCC-like) PT clones, the late dissemination scenario 1 becomes increasingly unlikely.
We then reconstructed the phylogeny of PTs and their matched DCCs based on the assumption that (1) aberrations more common among samples have developed earlier in time and (2) the overall number of genomic changes leading to the observed sample data is minimal (maximum parsimony).
Patient ID 22q 17p 17q 20q 19q 1p32pter 19p 4q 9p 7q22q32
01T DCC 1 09T DCC 3 11T DCC 2 14T DCC 2 09T DCC 1 11T DCC 1 07T DCC 2 30T DCC 3 03T DCC 5 15T DCC 1 06T DCC 1 24T DCC 1 05T PT 1 12T DCC 2 12T DCC 3 09T DCC 2 10T DCC 1 13T DCC 2 08T DCC 1 05T DCC 1 08T DCC 3 01T PT 1 29T DCC 3 28T DCC 1 09T PT 2 08T PT 1 27T DCC 2 10T PT 1 14T PT 1 06T PT 1 07T PT 1 13T PT 1 29T PT 1 11T PT 1 15T PT 1 12T PT 1 02T DCC 1 03T PT 1 02T PT 1 09T PT 3 27T PT 2 30T PT 3 30T PT 4 24T PT 2 30T PT 2 28T PT 1 28T PT 2
b
Locus adj p-val
Type PT DCC PT DCC PT DCC PT DCC PT DCC PT DCC PT DCC PT DCC PT DCC
Gains (%) 4 62 4 17 9 42 4 42 52 4 13 42 9 17 48 4 9 12
Losses (%) 35 0 74 8 48 0 52 4 13 8 52 4 74 21 4 4 48 4
20q 19p 17q 17p 4q 22q 19q 4p 16p
0.0002 0.0002 0.001 0.001 0.002 0.005 0.005 0.006 0.007
c
−1 0 1
PT DCC PT DCC PT DCC PT DCC PT DCC PT DCC PT DCC PT DCC PT
9 50 30 0 0 17 4 38 35 0 4 17 9 12 30 0 4 21
17 0 4 0 26 0 39 4 0 4 26 0 39 4 13 25 35 4
11q 3p 10q 1p 2q 10p 16q 6q 12q
0.029 0.031
0.007 0.007 0.007 0.007 0.01 0.027 0.027
DCC Locus
adj p-val Type Gains (%) Losses (%)
Aberration status
DCC clone fraction
Dissemination fold change
Maximum number of DCC clone samples
d
0 5 10 15 NDCC
0.0 0.1 0.2 0.3 0.4
0 1 2 3 4 5
A B
C D
E F
0.124 0.21
03T 2 29T 1 53R 1 66R 2 34R 1 37T 1 04T 6 108R 204T 2 10R 3 09T 2 13T 2 29T 3 45R 2 31T 1
124R 4 28T 1 32T 2 45R 1 53T 2 09T 3 10R 4 30R 1 55T 4 56T 1 56T 2 57T 1 57T 2 65R 1 25T 3 52R 1 71R 1 125R 102T 1 10T 2 27T 2 37R 5 42T 4 10R 2 11T 3
155R 3 48R 1100R 4 108R 1 24T 1 30R 4 04T 4 41R 2 01T 2 43T 1 141R 1 190R 5 24R 1135R 108T 1 37R 2 53T 1 53T 3 81R 2
155R 211T 2 190R 637R 4 41R 1 41R 3 54T 2 30T 3 05T 1 09T 1 46T 1 08T 3 06T 1 12T 3 38T 1135R 2 12T 2 04T 3 124R 504T 1 45T 2
125R 250T 2 15T 1 07T 2 03T 5 14T 2 25R 1 44T 1 54T 1 36R 2
Number of aberrations 20 10 0 10 20 30
40 Gains Losses
Cell ID
a
Sample type
Fig. 2gp100-positive cells from SLNs and primary tumours display multiple copy number alterations (CNAs).aNinety-one DCCs from our patients were selected according to QC criteria (see main text and Supplementary Figure1) for CGH and mutation analysis. Histograms depict the genomic gains (yellow) or losses (blue) per cell. The identifiers indicate cell ID.bCluster analysis of paired PTs (n=23 samples) and DCCs (n=24 samples) from 19 patients for chromosomal aberrations (gain=+1; loss=−1). Only the 10 most variable regions are included (see Supplementary Figure5for all 53 variable regions). Side- line identifiers indicate patient ID, sample type (PT and DCC) and sample index; bottom-line labels indicate chromosomal regions. Black (28T), white (30T) and dark grey (09T)filled squares indicate examples of PT-DCC pairs for which several areas of the PT were available. Examples of paired DCCs and PTs with varying PT thickness are indicated by coloured squares (green: 1 mm, grey: 1.4 mm, pink: 2 mm, blue: 7 mm PT thickness).cComparison of paired PTs and DCCs for chromosomal aberrations. Displayed are the 18 chromosomal regions that differ significantly (FDR-adjusted Fisher’s exact testpvalue≤0.05) between paired PTs (n=23, 19 patients) and DCCs (n=24,n=19 patients) regarding aberration frequency. Gains and losses are given in percent.d Maximum number of DCC samplesNDCC(colour-coded) that cannot be excluded to derive from corresponding DCC-like clones within the PT plotted against the assumed DCC-like clone fraction in the PT and the successful dissemination fold change. If DCC-like and non-DCC-like PT clones disseminate equally (fold=1), at most 11/24 DCC samples may result from DCC clones within the PT at the maximum indicated clone fraction of 0.40 (A); for twofold dissemination not more than 14/24 (B). For fold=5, the same number of samples can be excluded up to a fraction of 0.124 (11/24) (C) and 0.21 (14/24) (D), respectively. These intermediate fractions correspond to a maximum of 5/24 (0.124) (E) and 7/24 (0.21) (F) DCC samples, respectively, if clones disseminate similarly (fold=1). See 'Methods' section for details. Significance levelα=0.05 (Poisson-binomial distribution)
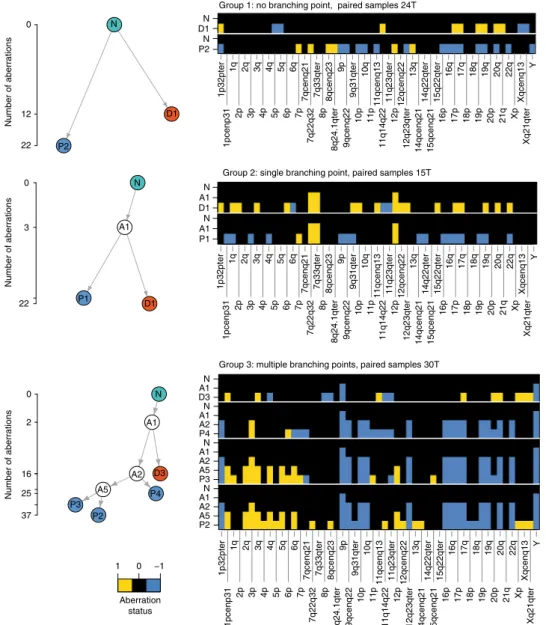
Applying this approach to our copy number alteration (CNA) data, we observed three types of phylogenetic trees (Fig. 3) defined by the number of branching points. In all 19 matched samples, DCCs and PT samples branched early and evolved in parallel (Fig. 3 and Supplementary Figs. 6–8).
DCCs and PTs are rarely clonal for BRAF mutations. Since BRAF and NRAS mutations are frequent in melanoma, occurring in 40 and 21% of cases on average, respectively
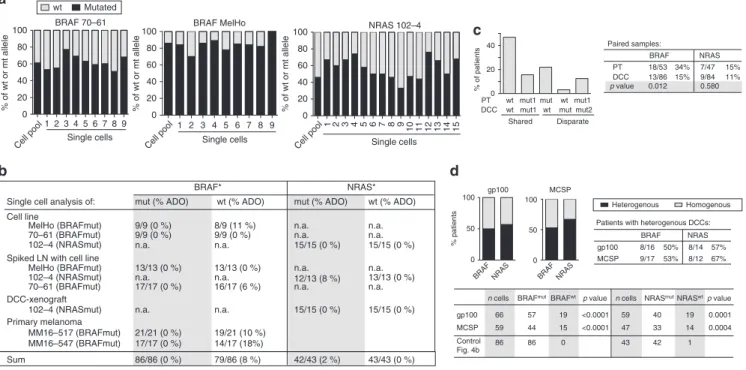
19, we investigated whether PTs pass them on to DCCs. We performed a series of control experiments on single cells from cell lines, xenografts and PTs to determine the allelic drop-out (ADO) rate for mutant and wild-type alleles. We assumed one mutant and one wild-type allele per cell and found the ADO rate for BRAF to range between 0% (mutant allele; 86/86 alleles detected) and 8% (wt allele; 79/86 alleles detected; Fig. 4a, b) and for NRAS between 0% (wt allele;
43/43 detected) and 2% (mutant allele; 42/43 detected). We concluded that our single-cell assay is well suited to address
questions of clonality and lineage descent for BRAF and NRAS. In matched patient samples, BRAF was mutated more frequently in PTs (34%) than in DCCs (15%; p = 0.012, Fisher’s exact test; n = 32 patients; Fig. 4c and Supplementary Fig. 11), whereas no sig- nificant difference was observed for NRAS mutations (15% in PTs and 11% in DCCs; p = 0.58; n = 29 patients). For these two oncogenes, we found a shared wild type in 47%, a shared mutated status in 16% and disparate mutational states in 37% of cases (Fig. 4c). Among patients with mutated PTs, matched DCCs were mostly not sharing these mutations (shared in 3/11 for BRAF and 3/6 for NRAS, Supplemental Fig. 12), indicating that they had disseminated before fixation of the mutation within the primary site.
BRAF and NRAS mutations have been suggested to initiate melanoma
20and, consequently, be fully clonal. We therefore determined if sibling DCCs, i.e., individual DCCs from patients with BRAF or NRAS mutant gp100+ DCCs of whom we could isolate more than one DCC, all share the same mutation. We found that sibling gp100+ DCCs are heterogeneous in 50 and
1p32pter 1pcenp31 1q 2p 2q 3p 3q4p 4q5p 5q6p 6q 7p 7qcenq21 7q22q32 7q33qter 8p 8qcenq23 8q24.1qter 9p 9qcenq22 9q31qter 10p 10q11p 11qcenq1311q14q22 11q23qter12p 12qcenq2212q23qter 13q14qcenq21 14q22qter15qcenq21 15q22qter16p 16q 17p 17q 18p 18q19p 19q20p 20q21q 22qXp Xqcenq13Xq21qter Y P1
A1 N D1 A1 N
1p32pter 1pcenp31 1q 2p 2q 3p 3q 4p 4q 5p 5q 6p 6q 7p 7qcenq21 7q22q32 7q33qter 8p 8qcenq23 8q24.1qter 9p 9qcenq22 9q31qter 10p 10q 11p 11qcenq13 11q14q22 11q23qter 12p 12qcenq2212q23qter 13q14qcenq21 14q22qter15qcenq21 15q22qter16p 16q17p 17q18p 18q19p 19q20p 20q21q 22qXp Xqcenq13Xq21qter Y P2
N D1 N
1p32pter 1pcenp31 1q 2p 2q 3p 3q 4p 4q 5p 5q 6p 6q 7p 7qcenq21 7q22q32 7q33qter 8p 8qcenq23 8q24.1qter 9p 9qcenq22 9q31qter 10p 10q11p 11qcenq13 11q14q22 11q23qter 12p 12qcenq22 12q23qter 13q 14qcenq21 14q22qter 15qcenq21 15q22qter16p 16q17p 17q 18p 18q 19p 19q 20p 20q 21q 22q Xp Xqcenq13Xq21qter Y P2
A5 A2 A1 N P3 A5 A2 A1 N P4 A2 A1 N D3 A1 N
Group 1: no branching point, paired samples 24T
Group 2: single branching point, paired samples 15T
Group 3: multiple branching points, paired samples 30T 22
3 0
Number of aberrations
22 12 0
Number of aberrations
37 25 16 2 0
Number of aberrations
−1 0 1
Aberration status N
N
A1
P1 D1
A1 N
A2 D3 A5 P4
P3 P2 P2
D1
Fig. 3Phylogenetic trees of paired PT and DCC samples. Representative examples for the three distinct groups observed in our data (for all 19 patients, see Supplementary Figures6–8). The ordinate of the tree panels indicates the number of aberrations per CGH profile (square root scale). Heat maps show aberration profiles along paths from normal cells (N) to PT (P1–4) and DCC (D1, D3) samples, respectively. Profiles A1, A2 and A5 denote inferred common ancestors (intermediates) (see 'Methods' section)
57% of cases for BRAF and NRAS mutations, respectively (Fig. 4d). To rule out a selective effect of the detection marker gp100, we analysed additional melanoma DCCs detected by the melanoma marker MCSP (melanoma-associated chondroitin sulphate proteoglycan) and obtained similar results (Fig. 4d).
To test whether this heterogeneity of sibling DCCs reflects method-induced mutant allele loss or non-clonality, we compared the mutation rates of sibling DCCs with single cells (n = 86 for BRAF and 43 for NRAS) from our control experiments (Fig. 4b).
In the latter, we detected the mutant allele in all (BRAF) or all but one (NRAS) single cells, whereas the mutant allele often remained undetected in gp100
+or MCSP
+DCCs (p < 0.0001 for BRAF; p = 0.0001 and 0.0004 for NRAS and gp100 and MCSP, respectively;
Fig. 4d). Therefore, the frequent failure to detect the mutant allele in sibling DCCs cannot be explained by a technical artefact. We conclude that BRAF or NRAS mutations among sibling DCCs are not fully clonal. Finally, when we compared the mutational state for PT-DCC-metastases triplets or pairs of PTs-metastases or pairs of DCC-metastases, we found that DCCs with and without BRAF/NRAS mutations were able to form manifest metastases (Supplementary Fig. 12a, b).
In summary, both copy number alterations and targeted mutation analysis demonstrate that primary melanomas and their paired DCCs are largely genetically disparate implying early evolutionary branching. Consequently, we focused on the evolution of DCCs within the SLN because of their obvious relevance for systemic cancer progression.
Genomic evolution of DCCs outside the PT. DCCs disseminate early and display genomes either representative of earlier
evolutionary states before loss of chromosomal material (Fig. 2b, c) or of a hidden PT subclone. To address cancer evolution outside the PT, we first investigated the genomic profiles of DCCs that had not yet expanded within the SLN and representing the time early after arrival.
Since colony formation became clearly apparent at a DCCD > 100 (Fig. 1b and ref.
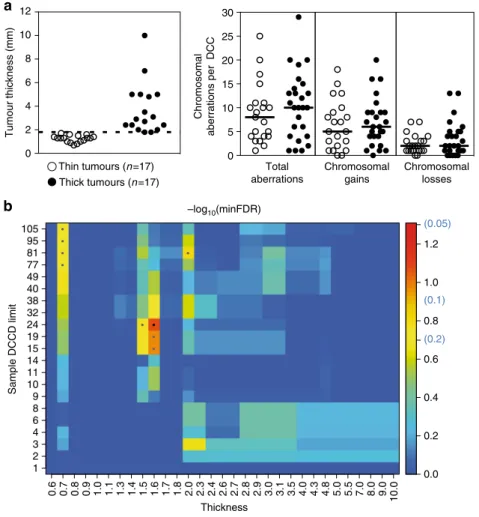
14), we considered samples with a DCCD ranging from 1 to 99 to contain early arriving DCCs. Thus, DCCs from the 34 patients with a DCCD below 100 were categorised as thin and thick melanomas taking the median thickness as a split (Fig. 5a). We found no difference in the number of CNAs (total; gains; losses) between DCCs arriving from thick and thin melanomas (Fig. 5a) and could not identify any genetic alteration that was significantly enriched in DCCs from thick melanomas (Fig. 5b). Therefore, we can exclude a simple model of mutation accumulation and late arising metastasis-causing alterations within growing PTs.
We investigated for all genetic changes of SLN DCCs their association to PT thickness and DCCD assuming that alterations may either be acquired within the PT before dissemination or thereafter. Since the risk of acquiring genetic changes is linked to the number of cell divisions and the local environment, we determined for each alteration whether the risk depends on the number of cell divisions within the PT or the SLN. Strikingly, we could classify most of the genetic changes into one of four categories associated with the angle of a straight line that best separates DCC samples with different aberration status in the two-dimensional space of thickness and DCCD (Figs. 6a, d, g, j and 7a; and 'Methods' section). The risk of acquiring category 1 changes (Fig. 6a–c) is solely related to the number of cell divisions a cell undergoes within the PT before dissemination (n
T) while
0 20 40 60 80 100
% of wt or mt allele
BRAF 70–61
% of patients
PT DCC
wt mut
wt wt mut
wt mut2 mut1 mut1
mut1
Disparate Shared
0 20
40 Paired samples:
BRAF NRAS
PT 18/53 34% 7/47 15%
DCC 13/86 15% 9/84 11%
p value 0.012 0.580
Homogenous Heterogenous
BRAF NRAS
gp100 8/16 50% 8/14 57%
MCSP 9/17 53% 8/12 Patients with heterogenous DCCs:
0 50 100
% patients
gp100
0 50 100
MCSP NRAS 102–4
0 20 40 60 80 100
% of wt or mt allele
Single cells Cell pool
1 2 3 4 5 6 7 8 9 Single cells
Cell pool
1 2 3 4 5 6 7 8 9
Single cells Cell pool
1 2 3 4 5 6 7 8 9 10 11 12 13 14 15
67%
Cell line
Spiked LN with cell line
DCC-xenograft
BRAF*
mut (% ADO) wt (% ADO)
NRAS*
mut (% ADO) wt (% ADO) 9/9 (0 %) 8/9 (11 %)
15/15 (0 %) 15/15 (0 %) 13/13 (0 %) 13/13 (0 %)
12/13 (8 %) 13/13 (0 %) 17/17 (0 %) 16/17 (6 %)
15/15 (0 %) 15/15 (0 %) 9/9 (0 %) 9/9 (0 %)
n.a. n.a.
n.a. n.a.
n.a. n.a.
102–4 (NRASmut) n.a. n.a.
n.a. n.a.
70–61 (BRAFmut) 102–4 (NRASmut)
n.a. n.a.
n.a. n.a.
MelHo (BRAFmut) 70–61 (BRAFmut) 102–4 (NRASmut) MelHo (BRAFmut) Single cell analysis of:
Mutated wt
Sum 86/86 (0 %) 79/86 (8 %) 42/43 (2 %) 43/43 (0 %)
BRAF MelHo
0 20 40 60 80 100
% of wt or mt allele
gp100 MCSP Control Fig. 4b
n cells BRAFmutBRAFwt 66
59 86
57 44 86
19 15 0
p value
<0.0001
<0.0001 BRAF NRAS BRAF NRAS
n cells NRASmutNRASwt 59
47 43
p value 40
33 42
19 14 1
0.0001 0.0004 Primary melanoma
MM16–517 (BRAFmut) MM16–547 (BRAFmut)
21/21 (0 %) 17/17 (0 %)
19/21 (10 %) 14/17 (18%)
*calculated with one mutant/wildtype allele per cell
a
c
b d
Fig. 4BRAF and NRAS mutations in PTs and DCCs.aSingle cell WGA reliably captures wild-type and mutated alleles. Exon 15 mutation c1799T>A (BRAF) and Exon 2 mutation c181C>A (NRAS) were detected in all single cells (lanes 1–9 or 1–15) of cell lines withBRAF(cell lines 70–61 (n=9) and MelHo (n= 9)) orNRAS(cell line 102–4;n=15) mutation. The allelic ratio of wt vs. mut alleles of each cell line was determined using pooled DNA. Note that this ratio is preserved in most single cells.bSummary of results inaand detection ofBRAFandNRASmutation in single gp100+ cells isolated from (i) lymph nodes from healthy controls spiked with melanoma cell line cells, processed and stained as SLN of melanoma patients; (ii) an enzymatically digested DCC- xenograft derived from NRAS-mutated DCCs and (iii) primary melanomas with BRAF mutation.cMutation analysis ofBRAFandNRASfor paired PT-DCC samples (n=32 patients). Different mutations (eitherNRASorBRAF) are indicated by mut1 and mut2. Fisher’s exact testpvalues indicate differences in BRAFmutational status between PTs and DCCs.dPercentage of patients (n=seeTable 1) with homogeneous (all cells harbouring the mutation) and heterogeneousBRAF/NRASmutational status among DCCs. DCCs were detected using two markers, gp100 (n=43 cells) or MCSP (n=61 cells)
subsequent cell divisions within the SLN (n
L) do not alter (increase or decrease) their emergence (Fig. 6a–c). Notably, all changes acquired under the linear progression model conform to this category. Category 2 (Fig. 6d–f) comprises alterations whose risk is fully explained by the total number of cell divisions, i.e., the generation of changes is independent of the microenvironment and reflects total disease duration if growth rates within and outside the primary are equal. As an example, initial gain of chromosome 1p11–13 was 're-normalised' over time and vanished as PTs grew larger than 2.7 mm (Fig. 6e, f). Category 3 changes (Fig. 6g–i) have a higher risk of emergence within the SLN than within the PT. A striking example here is mutant BRAF, which is rarely found in very small primary lesions
21,22, but is highly associated with the emergence of SLN colonies (Fig. 6h, i).
Thus, although BRAF mutations are present in ~1/3 of PTs in paired PT-DCC samples (Fig. 4c), BRAF-mutated PT cells obviously do either not disseminate or not engraft in SLNs.
Finally, we identified alterations, whose risk was negligible for the number of cell divisions within the PT before dissemination but dramatically increased at colonisation of the distant site (category 4, Fig. 6j–l).
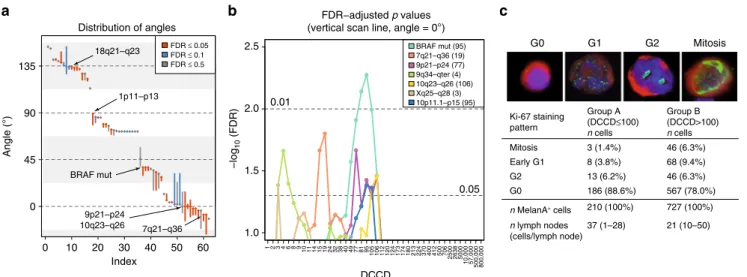
In contrast to category 1 (exclusive dependence on the number of cell divisions before dissemination) and category 2 (depen- dence on the total number of divisions), categories 3 and 4 show a real and observable dependence on the number of divisions within the SLN, i.e., the DCCD. To identify critical DCCD values, we scanned for the emergence of DCCD-dependent genomic changes. Of note, alterations in regions harbouring typical melanoma-driving onco- and tumour suppressor genes such as BRAF or CDKN2A (9p21-p24) emerged at a DCCD of 77–106, exactly when we noted morphological colony formation (Fig. 7b and Supplementary Tables 2 and 3). NRAS mutation was associated with insignificant classification FDR values and the best classifier for NRAS separated out only 4 out of 87 samples. In Figure 7a we required a minimum of 10 samples per class and displayed in Figure 7b only loci reaching 5% significance. Thus, NRAS does not surface in either graphics. Obviously, cell divisions within the SLN determine the risk of acquiring alterations. Therefore, we compared labelling indices for the proliferation marker Ki-67 in SLN DCCs from patients with DCCD ≤ 100 and DCCD > 100, i.e., before and after colony formation (Fig. 7c). As double staining of MIB-1 (anti-Ki-67) and
Chromosomal losses Chromosomal
gains Total
aberrations 0
5 10 15 20 25 30
Chromosomal aberrations per DCC
Tumour thickness (mm)
0 2 4 6 8 10 12
0.0 0.2 0.4 0.6 0.8 1.0 1.2
1 2 3 4 6 8 9 10 11 14 15 19 24 32 38 40 49 77 81 95 105
0.6 0.7 0.8 0.9 1.0 1.1 1.3 1.4 1.5 1.6 1.7 1.8 2.0 2.3 2.4 2.6 2.7 2.8 2.9 3.0 3.1 3.5 4.0 4.3 4.8 5.0 5.5 7.0 8.0 9.0 10.0
Sample DCCD limit
Thickness
(0.05)
(0.1)
(0.2) –log10(minFDR)
Thin tumours (n=17) Thick tumours (n=17)
a
b
Fig. 5Molecular analysis of DCCs at dissemination.aLeft: Separation of primary melanomas according to median thickness into thin (<1.8 mm) and thick (≥1.8 mm) tumours, from which DCCs were analysed. Right: Number of chromosomal aberrations per DCC from thin (n=17) and thick (n=17) tumours . bSamples were selected for suggested early arrival in the SLN as indicated by small DCCD values up to 105 and then tested for genomic differences regarding their origin from thick and thin primaries. Theyaxis specifies the DCCD limit up to which samples were included in the analysis, with sample numbers ranging from 6 (DCCD=1) over 31 (DCCD=24) to 46 (DCCD=105). Thexaxis reports the limiting thickness according to which samples were split regarding their association with thin or thick tumours (set points left of these values). Colour indicates the minimum FDR-adjustedpvalues (Fisher’s exact test) across loci/mutations assessing the largest genomic differences between these two groups. The smallestpvalue of FDR=0.084 occurs at DCCD=24 and thickness=1.6 mm for locus 18q21–23 (black central dot).pvalues up to FDR=0.2 are indicated by grey dots and may refer to the loci 18q21–23, 1q24–44 or 8q23–24.3. The colour key includes the non-log-transformed FDR values 0.05, 0.1 and 0.2 in brackets. No significant differences were observed
HMB45 (anti-gp100) was unsuccessful, we replaced gp100 with the melanoma-associated marker Melan A
14. Ki-67 expression was assessed in 37 nodes with DCCD ≤ 100 (Group A) and 21 nodes with DCCD > 100 (Group B), involving evaluation of 937 cells in total. In Group A, 11.4% of cells were clearly cycling , while 22.0% were in the cell cycle in group B (p = 0.0005; Fisher’s exact test, Fig. 7c). Thus, a basal proliferation rate may initially enable acquisition of genetic alterations that subsequently drive accelerated outgrowth.
Colonisation-associated alterations and malignant behaviour.
Cancer cells forming a SLN colony displayed a characteristic signature of alterations. To test whether pre- and post-colonising DCCs have tumour-initiating ability, we transplanted both DCC
types and cells from cell lines into NSG mice. We first evaluated conditions for xenotransplantation of few melanoma cells
23. For cell line cells (Supplementary Fig. 13a, b) and patient DCCs (Fig.
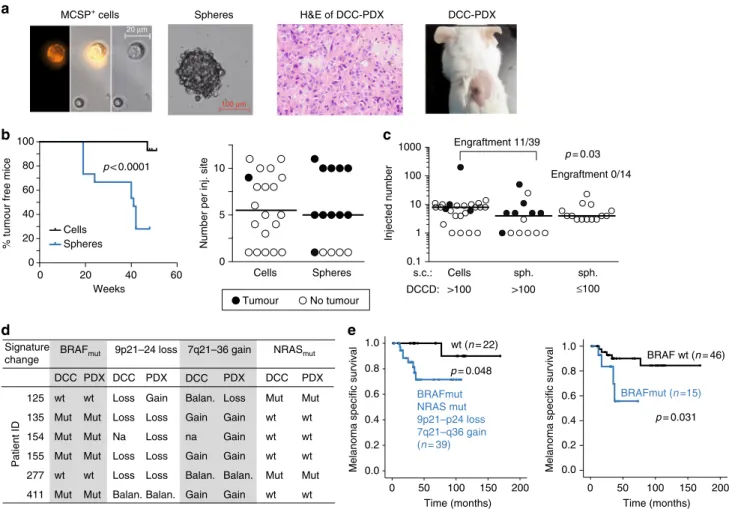
8a, b), we compared two approaches: direct transplantation of groups of DCCs and transplantation of DCC spheres after brief culture under melanosphere conditions (Fig. 8a). We found that melanospheres formed tumours in immunodeficient NSG mice earlier and more frequently than groups of single cells (p <
0.0001, log-rank test; Fig. 8b and Supplementary Fig. 13a, b). The applied conditions supported growth from as few as a single transplanted sphere or a group of seven DCCs (Fig. 8b). We therefore only transplanted spheres from samples with DCCD ≤ 100 and spheres or groups of single DCCs from samples with DCCD > 100 for comparing the tumour-initiating ability of
50 40 30 20 10 0 E
nT
Angle = 45°
NTNTNT nT
Angle = 90°
−20
−10 10 20 E
0 5 10 15 20
nT
Angle = 135°
E
nT
Angle = 0°
1p11-p13: minFDR = 0.041 (1.38) 18q21–q23: minFDR = 0.003 (2.54)
Thickness (mm)
BRAFmut: minFDR = 0.0005 (3.32)
E = nL E = nT+ 2nL(= NT+nL)
E = nT+ nL(= NT) E = nT (=NT– nL)
1122333468910111414141519243238404049497781959595959510510611212012012012412417317317417418021322422422437037037040040040041241250070670625002500263826385000500010,00010,00057000500,000500,000800,000 0.6
0.7 0.8 0.9 1.0 1.1 1.3 1.4 1.5 1.6 1.7 1.8 2.0 2.3 2.4 2.6 2.7 2.8 2.9 3.0 3.1 3.5 4.0 4.3 4.8 5.0 5.5 7.0 8.0 9.0 10.0
DCCD
Thickness (mm)
18q21–q23: Angle = 134° Class1 = (5|7|1) Class2 = (1|73|0) Type = (−1|0|1)
1 1 2 2 3 3 3 4 6 8 9
10 11 14 14 14 15 19 24 32 38 40 40 49 49 77 81 95 95 95 95 95105 106 112 120 120 120 124 124 173 173 174 174 180 213 224 224 224 370 370 370 400 400 400 412 412 500 706 706 2500 2500 2638 2638 5000 5000
10,000 10,000 57,000500,000 500,000 800,000 0.6
0.7 0.8 0.9 1.0 1.1 1.3 1.4 1.5 1.6 1.7 1.8 2.0 2.3 2.4 2.6 2.7 2.8 2.9 3.0 3.1 3.5 4.0 4.3 4.8 5.0 5.5 7.0 8.0 9.0 10.0
DCCD
Thickness (mm)
1p11–p13: Angle = 89° Class1 = (2|41|1) Class2 = (0|32|11) Type = (−1|0|1)
1 1 2 2 3 3 3 4 6 8 9
10 11 14 14 14 15 19 24 32 38 40 40 49 49 77 81 95 95 95 95 95105 106 112 120 120 120 124 124 173 173 174 174 180 213 224 224 224 370 370 370 400 400 400 412 412 500 706 706 2500 2500 2638 2638 5000 5000
10,000 10,000 57,000500,000 500,000 800,000 0.6
0.7 0.8 0.9 1.0 1.1 1.3 1.4 1.5 1.6 1.7 1.8 2.0 2.3 2.4 2.6 2.7 2.8 2.9 3.0 3.1 3.5 4.0 4.3 4.8 5.0 5.5 7.0 8.0 9.0 10.0
DCCD
Thickness (mm)
BRAFmut: Angle = 38° Class1 = (22|20) Class2 = (44|1) Type = (0|1)
1 1 2 2 3 3 3 4 6 8 9
10 11 14 14 14 15 19 24 32 38 40 40 49 49 77 81 95 95 95 95 95105 106 112 120 120 120 124 124 173 173 174 174 180 213 224 224 224 370 370 370 400 400 400 412 412 500 706 706 2500 2500 2638 2638 5000 5000
10,000 10,000 57,000 500,000 500,000 800,000 0.6
0.7 0.8 0.9 1.0 1.1 1.3 1.4 1.5 1.6 1.7 1.8 2.0 2.3 2.4 2.6 2.7 2.8 2.9 3.0 3.1 3.5 4.0 4.3 4.8 5.0 5.5 7.0 8.0 9.0 10.0
DCCD
Thickness (mm)
9p21–p24: Angle = 0° Class1 = (28|20|1) Class2 = (6|31|1) Type = (−1|0|1)
a
e f
h i
k l
12346891011141519243238404977819510510611212012417317418021322437040041250070625002638500010,00057,000500,000800,000 0.6
0.7 0.8 0.9 1.0 1.1 1.3 1.4 1.5 1.6 1.7 1.8 2.0 2.3 2.4 2.6 2.7 2.8 2.9 3.0 3.1 3.5 4.0 4.3 4.8 5.0 5.5 7.0 8.0 9.0 10.0
DCCD
1 2 3 4 6 8 910 11 14 15 19 24 32 38 40 49 77 81 95
105 106 112 120 124 173 174 180 213 224 370 400 412 500 706 2500 2638 5000
10,000 57,000 500,000 800,000 0.6
0.7 0.8 0.9 1.0 1.1 1.3 1.4 1.5 1.6 1.7 1.8 2.0 2.3 2.4 2.6 2.7 2.8 2.9 3.0 3.1 3.5 4.0 4.3 4.8 5.0 5.5 7.0 8.0 9.0 10.0
DCCD
Thickness (mm)
1 2 3 4 6 8 9
10 11 14 15 19 24 32 38 40 49 77 81 95
105 106 112 120 124 173 174 180 213 224 370 400 412 500 7062500 2638 5000 10,000 57,000
500,000 800,000 0.6
0.7 0.8 0.9 1.0 1.1 1.3 1.4 1.5 1.6 1.7 1.8 2.0 2.3 2.4 2.6 2.7 2.8 2.9 3.0 3.1 3.5 4.0 4.3 4.8 5.0 5.5 7.0 8.0 9.0 10.0
DCCD
Thickness (mm)
9p21–p24: minFDR = 0.022 (1.67)
Aberration statusAberration statusAberration statusAberration status
5 10 15 20 25 30
0
5 10 15 20 25 30
0
5 10 15 20 25 30
0
5 10 15 20 25 30
0 NT
0 30
E30 25 20 15 10 5 0 nL
0 5 10 15 20
nL
0 5 10 15 20
nL
0 5 10 15 20
nL
20 15 10 5 0
3.0
2.0 1.5 2.5
1.0 0.5 0.0
3.5 3.0
2.0 1.5 2.5
1.0 0.5 0.0
2.0
1.5
1.0
0.5
0.0 2.0
1.5
1.0
0.5
0.0
−1 0 1
−1 0 1
−1 0 1 0 1
b c
d
g
j
DCCs from SLNs with DCCD ≤ 100 to those with DCCD > 100.
The number of spheres per injected site was similar in both cases (p = 0.39, Mann–Whitney U test; Fig. 8c). Strikingly, a DCCD >
100 was predictive of successful xenotransplantation (11/39 (28.2%) transplantations gave rise to tumours in 6/10 patients), whereas samples with DCCD ≤ 100 never established tumours (0/
14 injection sites in 0/5 patients; Fig. 8c; p= 0.03, Fisher's exact test). Genetic fingerprinting confirmed patient origin (Supple- mentary Fig. 13c). Furthermore, in 5/6 patient-derived xenografts either BRAF mutation, loss of 9p21–24 (harbouring CDKN2A), or gain of 7q21–36 (harbouring MET) was present (Fig. 8d). In one case (patient 125 in Fig. 8d), successful outgrowth was linked to the presence of an NRAS mutation.
Finally, we explored whether the genetic aberrations associated with colony formation in the SLN or with tumour formation in mice were associated with clinical outcome. For this, we tested if one or several alterations of our final colonisation signature (comprising BRAF mutation, loss of 9p21–24, gain of 7q21–36 and NRAS mutation) in single DCCs increased the risk of death.
Indeed, one or several of the signature changes were present in DCCs of 8/9 (89%) patients dying from melanoma (p = 0.048, log- rank test; Fig. 8e), with BRAF mutation being the most relevant single indicator (p = 0.031).
Discussion
This study provides a compelling molecular model that accounts for the ectopic evolution in the spread of early systemic cancer.
We report the first estimate for the tumour extent at which metastatic dissemination of a human cancer occurs; it is based on highly sensitive, direct detection of DCCs rather than being inferred from tumour growth rates
24–26. The median thickness of seeding melanomas was 0.5 mm (95% CI: 0.3–0.7 mm), much smaller than previously thought.
We therefore specifically investigated the fate of early DCCs and collected all available evidence to differentiate between three possible scenarios. Model 1: early DCCs (here defined as DCCs before evidence of colony formation in the SLN) inherit all genetic changes from the primary lesion that enable them to form a metastatic colony. Model 2: early DCCs may exist but are irrelevant; only late DCCs that disseminate after acquisition of driver mutations within the PT, grow out to manifest colonies.
Model 3: early DCCs are genetically immature and acquire critical alterations after homing to a distant site and thereby gain the ability to form a colony.
Our data allow us to reject model 1. Despite clear evidence for dissemination from earliest lesions, the 9-year death rate for T1 melanomas was much lower than the seeding rate at this stage. In
contrast, seeding and death rates in T4 melanomas were similar.
In line with this, pre-colonising DCCs lacked typical melanoma driver changes and were unable to form xenografts. Therefore, dissemination is necessary but not sufficient to generate lethal metastasis.
To address model 2, we first compared PTs and DCCs. We focused on CNAs because they best reflect cancerous progression as opposed to point mutations
4,20,27, which are frequently detected also in benign lesions unlike CNAs
4,20,28. Independent of tumour thickness, CNA profiles of PTs and matched DCCs were clearly different. Primary tumours displayed a differential loss of chromosomal material and phylogenetic analysis indicated that PTs and DCCs branch off early and progress in parallel, rendering model 2 unlikely. To corroborate this reasoning, we scrutinised DCCs that had just arrived in the SLN and specifically compared DCCs from thin vs. thick melanomas. We tested whether we can detect late-disseminating, genetically more mature, possibly more aggressive cells in SLNs from patients with thick melanomas. However, early DCCs from thin and thick melanomas did not differ characteristically, neither with regard to the number nor the quality of alterations.
Our analysis finally refuted model 2 and supported model 3 when we determined for each DCC alteration its link to the number of cell divisions within and outside the PT and visualised the aberration status as a function of tumour thickness and DCCD. Most changes were found to fall into one of four cate- gories (category 1: exclusive dependence on the number of cell divisions before dissemination; category 2: dependence on the total number of cell divisions before and after dissemination;
category 3: higher impact of cell divisions in SLN; category 4:
exclusive dependence on the number of cell divisions after dis- semination). Only 29% of loci showing significant FDR values correspond to category 1 and their alteration may thus derive from linear progression. The great majority (71%), however, conform to category 2 (18%), 3 (18%) or 4 (36%) that are in an increasing degree inconsistent with linear progression. Had, e.g., BRAF mutations been persistently generated within the primary and continuously spread to the SLN, a positive mutation status at small DCCD values would have been a frequent observation in Fig. 6i. Since, however, BRAF mutations existed in ~1/3 of PT samples while being absent in precolonizing DCCs, BRAF mutant cells either remain in the primary, are unable to survive in or bypass the sentinel. Recent findings support the first explanation because strong oncogene activation apparently favours pro- liferation, but impedes dissemination
10,21,29. Consistently, most of our experimental data cannot be explained by the linear pro- gression paradigm stating that genetic alterations originate
Fig. 6DCCs acquire genetic alterations within and outside the PT.a,d,g,jGenome alterations are explained by four different risk scenarios. Panelsa,d,g andjshow different risk functionsE(colour-coded) as a function of the number of cell divisions in the SLN (nL) and the PT (NT). The two arrows indicate a prototypic state trajectory: initially, cell divisions exclusively occur within the PT (NT>0,nL=0) until afternTcell divisions a tumour cell disseminates to the SLN. Subsequently, PT and SLN cells grow simultaneously (NT>0,nL>0). The grey dashed horizontal lines atNT=14.4 and 26.6 correspond to the minimum (0.6 mm) and maximum (10 mm) experimental thickness values ('Methods' section). Growth rates are presumed equal in both environments implying (i) inaccessibility of the region below the diagonal (grey solid line), consistent with the empty lower right triangular area inc,f,i,land (ii)NT=nT
+nL(after dissemination; 'Methods' section). The angle indicates the direction of the normal vector regarding equal risk lines.b,e,h,kClassification results for four prototypic CGH results (loci/mutations) using linear classifiers with 2D set points according to the indicated DCCD and PT thickness values and directions as pictured by the small arrows within each rectangle of the colour matrix ('Methods' section). Colour encodes the negative decadic logarithm of the FDR-correctedpvalues of each classification (Fisher’s exact test). Basically, the red/orange areas separate regions differing in their distribution of genomic alterations. Their orientation parallels the equal risk lines ina,d,g,j. DCCD and thickness values were chosen according to experiment while classifier set points were slightly displaced relative to these values (white points included for the 5% most significant FDR values). Minimum FDR values are indicated by black points.N=87 DCCs, 57 patients, 82 loci/mutations.c,f,i,lCorresponding measurement results as well as the class assignments of the best (lowest FDR) classifiers indicated by the light (class1) and dark (class2) grey areas. The class boundary does not necessarily appear linear as samples are listed according to rank while linear classification was performed in log(DCCD)-log(thickness) space. The classifier angle and the distribution of deletions (−1), balances/wt (0) and amplifications/mutations (+1) in each class are given in the title