DISS. ETH NO. 27337
MOLECULAR HOLOGRAMS - DESIGN PRINCIPLES OF ROBUST BIOSENSORS AT THE EXAMPLE OF FOCAL MOLOGRAPHY
A thesis submitted to attain the degree of DOCTOR OF SCIENCES of ETH ZÜRICH
(Dr. Sc. ETH Zürich)
presented by ANDREAS FRUTIGER
MSc. in Biomedical Engineering ETH Zürich MSc. in Materials ETH Zürich
born on 30.05.1989
citizen of Ringgenberg, BE, Schweiz
accepted on the recommendation of Prof. Dr. Janos Vörös, examiner Dr. Christof Fattinger, co-examiner Prof. Dr. Vahid Sandoghdar, co-examiner
2021
A NY SUFFICIENTLY ADVANCED TECHNOLOGY IS INDISTINGUISHABLE FROM
MAGIC .
A RTHUR C. C LARKE
Acknowledgements
A scientific project is always a team effort and this should be valued much more in academia. With this paragraph I would like to express my deepest thank to all the people that supported and guided me during my time as a PhD student at LBB.
Probably the biggest thank goes to Christof Fattinger. Christof, you are the in- ventor of focal molography. But for me I would say you are the person who made me a true scientist. It was not easy at the beginning of my PhD to actually gain your trust, and I still remember your eyes when I dropped that phase mask, but once I proved myself you were a formidable mentor and friend. You spend numerous hours with me and taught me about optics and the importance of working properly, something that is very rare in today’s unhealthy "publish or perish" world.
A not smaller thank goes to my PhD supervisor Janos Vörös. Janos, I deliber-
ately chose your lab because of your optimistic and welcoming nature. The amount
of ideas you have is just breathtaking and the social environment that you sustain
in your lab feels sometimes like a big family. You are always available for your
PhD students and your first priority is to make everyone grow personally as much as
possible during their time at LBB.
Next, I would like to thank the members of the molography team, Volker Gat- terdam, Yves Blickenstorfer, Andreas Reichmuth and Fridolin Treindl. Yves, you started as my master student in 2016, to pursue the crazy idea of etching a glass fiber for 10 hours (with buffered oxide etch (hydrofluoric acid/ammoniumfluoride mixture) in a student project) and putting a Bragg grating on it. Four years later we still did not manage to perform this measurement. However, its fair to say that together we understood and derived most of the relevant physics of diffractometric biosensors. I very much enjoyed the countless discussion we had, the critical cross- checking of our formulas (which were always wrong the first time) and mutual inspi- ration. Alone neither of us would have gotten so far. At this occasion Markus Müller deserves to be mentioned as well for his tremendous help in the "Quantitative diffrac- tometric Biosensing" paper [1] and teaching me how to write proper manuscripts for physics journals. Volker, we started molography together and I still remember the day when we saw the first molograms, it was just before Christmas in 2014 at Roche in Rotkreuz. It was your enthusiasm and organizational skills that made working with you a pleasure and the molography subgroup so efficient. Andreas, you were the driver and visionary in the molography project. Without your countless proof of principle demonstrations the commercialization of focal molography would never have happenend.
I would also like to thank the entire LBB. Guys you were and are awesome! All the crazy parties that we had and especially the Après-Ski’s in Taufers I will never forget. Unless of course, the damage to my neurons continues at the same pace as at LBB.
But now lets gets get serious again, Esther Singer and Christian Frei I know you two went crazy because I always failed to pay my bills on time. Thank you for being so patient with me over all these years.
A lot of custom built instrumentation was required to obtain the result of this
thesis. This would not have been possible without the help of Stephen Wheeler but
also the Roche Workshop (Tom Kissling, René Rietmann, Pascal Hofer). At Roche
I would also like to thank Matthias Lauer for performing surface roughness AFM
(atomic force microscopy) measurements.
A
CKNOWLEDGEMENTSv
Many students also contributed to this thesis, here I would like to emphasize Cla Duri Tschannen, Silvio Bischof, Jens Duru and Roland Dreyfus. Their mostly theoretical work on focal molography greatly improved our understanding of the technique.
There are also a few people outside LBB that contributed significantly to this thesis. Here I would like to express all the gratitude in this world to my parents, Doris and Bernhard Frutiger. I think it was your support during my entire life and the freedom I enjoyed as a young boy that made me a scientist. I could always come home whenever I wanted and fully recharge my batteries or focus on a particular study subject since everything else was taken care of in hotel “Mama”. The next thanks goes to my brother Stefan, who has always been a great buddy for outdoor sports activities.
During my studies at ETH and also the PhD I lived and am still living in the very same shared flat (for 10 years). Mario Könz, which I by now would consider a brother, also lived there for this entire period. It was mainly because of our common fascination for science that we pushed each other to take as many courses as possible during our bachelors and finally both finished with two master’s degrees. Without your advise in software engineering I would not have managed to write the extensive Python packages that control the Moloreader and simulation framework. I would also thank you for being my thesis lawyer and helping me actually finish my thesis nearly on time.
Another key contributor to my scientific path is Samuel Stucki. Samuel you were my supervisor for “Schweizer Jugend forscht” in 2008, but we kept in contact ever since. You provided me with scientific advice and career guidance whenever I needed during my PhD.
Also there are a few organizations that should be named. I big thank goes to
Swiss Youth in Science and the Swiss Chemistry Olympiad for inspiring me dur-
ing my time at the gymnasium. Furthermore, I would like to thank the Swiss Study
Foundation and the Ernst Göhner Foundation for financial and intellectual support
during my studies. Finally, ETH Zürich and Roche are acknowledged for the finan-
cial support that made this work possible.
Abstract
Holograms have fascinated humans ever since their first creation nearly 70 years
ago. On the other hand, label-free optical biosensors are an invaluable tool for
molecular interaction analysis. This thesis is about applying holographic detection
to biomolecular interaction analysis and by this overcoming many of the drawbacks
of state-of-the-art biosensors. Over the past 30 years, refractometric biosensors, and
in particular surface plasmon resonance, have matured to the de facto standard of this
field. However, since their introduction no fundamental technological breakthrough
that could address the major problems of refractometric transducers occured. Sen-
sor equilibration, temperature drifts, buffer change artefacts and nonspecific binding
are still significantly lowering throughput, limit the application scope and compli-
cate the analysis of molecular binding experiments. Most importantly, the stabi-
lization requirements and the cross-sensitivity of refractometric biosensors have im-
peded label-free (bio-)sensors to truly extend their scope beyond the controlled con-
ditions of a laboratory environment. Molecular holograms or diffractometric biosen-
sors should finally enable this step and create biosensors that can analyze molecular
interactions in their natural habitat - the crowded environment of body fluids, tis-
sues, cells and membranes. This thesis provides the physical explanation and the
experimental evidence why this is not just a dream but actually very well possible.
First, I introduce the spatial affinity lock-in and use signal processing to explain
why diffractometric biosensors are finally solving the inherent stability problems
of refractometric biosensors. Second, by simulation and experiments I show that
molecular holograms achieve diffraction-limited focusing and derive mass quantifi-
cation formulas and an optimization criterion for diffractometric biosensors. Third, I
demonstrate that waveguide based diffractometric biosensors can function as a com-
bined refractometric sensor. In addition, in a direct comparison of a state-of-the-art
biosensor system to an unstabilized diffractometric biosensor I show that diffracto-
metric biosensors surpass refractometric biosensors in terms of mass resolution and
require less precise readout instrumentation. Lastly, I end with an in-depth noise
analysis to identify the intrinsic noise limit of biosensors in general and the extrinsic
noise limits of the setups developed in this thesis. In summary, this thesis provides
the explanation why molecular holograms at optical frequencies are the physical
principle to build robust and sensitive molecular sensors.
Zusammenfassung
Hologramme haben den Menschen seit ihrer ersten Kreation vor fast 70 Jahren fas-
ziniert. Andererseits sind markierungsfreie optische Biosensoren ein unschätzbares
Werkzeug für die Analyse molekularer Wechselwirkungen. In dieser Arbeit geht es
darum, die holographische Detektion auf die Analyse biomolekularer Wechselwir-
kungen anzuwenden und so viele der Nachteile modernster Biosensoren zu überwin-
den. In den letzten 30 Jahren sind refraktometrische Biosensoren und insbesondere
die Oberflächenplasmonresonanz zum De-facto-Standard dieses Gebiets gereift. Seit
ihrer Einführung ist jedoch kein grundlegender technologischer Durchbruch einge-
treten, der die Hauptprobleme refraktometrischer Sensoren lösen konnte. Einpen-
delung des Sensor, Temperaturabweichungen, Pufferwechselartefakte und unspezifi-
sche Bindung senken den Durchsatz immer noch erheblich, begrenzen den Anwen-
dungsbereich und erschweren die Analyse molekularer Bindungsexperimente. Die
Stabilisierungsanforderungen und die Querempfindlichkeit refraktometrischer Bio-
sensoren hindern markierungsfreie (Bio-) Sensoren bis heute ihren Anwendungsbe-
reich über die kontrollierten Bedingungen einer Laborumgebung hinaus zu erwei-
tern. Molekulare Hologramme oder diffraktometrische Biosensoren sollten diesen
Schritt endlich ermöglichen und Biosensoren schaffen, die molekulare Wechselwir-
kungen in ihrem natürlichen Lebensraum analysieren können - der überfüllten Um-
gebung von Körperflüssigkeiten, Geweben, Zellen und Membranen. Diese Arbeit lie-
fert die physikalischen Erklärungen und die experimentellen Nachweise, warum dies
nicht nur ein Traum, sondern tatsächlich sehr gut möglich ist. In meiner Arbeit stelle
ich zunächst den räumlichen Affinitäts-Lock-In vor und erkläre anhand von Metho-
den aus der Signalverarbeitung, warum diffraktometrische Biosensoren die inhären-
ten Stabilitätsprobleme der refraktometrischen Biosensoren lösen. Zweitens zeige
ich durch Simulationen und Experimente, dass molekulare Hologramme eine beu-
gungsbegrenzte Fokussierung erreichen, die Massenquantifizierungsformeln korrekt
sind und leite ein Optimierungskriterium für wellenleiterbasierte diffraktometrische
Biosensoren her. Drittens zeige ich, dass diffraktometrische Biosensoren auf Wellen-
leiterbasis als kombinierter refraktometrischer/diffraktometrischer Sensor fungieren
können. Anhand eines direkten Vergleichs eines kommerziellen Biosensorsystems
mit einem nicht stabilisierten diffraktometrischen Biosensor wird bestätigt, dass dif-
fraktometrische Biosensoren die refraktometrischen Biosensoren nicht nur hinsicht-
lich der Massenauflösung übertreffen, sondern auch weniger genaue Ausleseinstru-
mente erfordern. Zuletzt schließe ich mit einer eingehenden Rauschanalyse ab, um
die intrinsische Rauschgrenze von Biosensoren im Allgemeinen und die extrinsi-
schen Rauschgrenzen der in dieser Arbeit entwickelten Setups zu identifizieren. Zu-
sammenfassend liefert diese Arbeit die Erklärung, warum molekulare Hologramme
im sichtbaren Bereich des elektromagnetischen Spektrums das physikalische Prinzip
sind, um robuste und empfindliche molekulare Sensoren zu bauen.
Contents
1 Introduction 1
1.1 The significance of information on the presence of molecules and their interactions to life . . . . 1 1.2 Molecular sensors . . . . 2 1.3 Towards the technical emulation of all senses . . . . 3 1.4 Why are molecular sensors hard when it was easy for evolution? . . 4 1.5 Molecular sensors today . . . . 4 1.5.1 State of the art - refractometric molecular sensors . . . . 5 1.6 The ideal molecular sensor . . . . 9 1.7 Molecular holograms as the ideal transduction principle for molecu-
lar sensors . . . . 12 1.7.1 A brief history of holography . . . . 12 1.7.2 Diffraction and diffraction gratings . . . . 13 1.7.3 Molecular holograms and diffractometric biosensors . . . . 14 History of diffractometric biosensing . . . . 15 1.7.4 Challenges in the implementation of diffractometric biosensors 15 1.7.5 Focal molography - or how to implement diffractometric
biosensors . . . . 16
2 Scope of the thesis 19
3 Theory, methods and instrumentation 25
3.1 Mathematical and physical tools . . . . 25
3.1.1 Theory of dielectric waveguides . . . . 25
3.1.2 Coupled mode theory . . . . 26
3.1.3 Fourier optics . . . . 27
3.1.4 Scattering . . . . 27
Scattering at molecules/particles . . . . 28
Scattering of isotropic media . . . . 28
Scattering at surface roughness . . . . 28
3.1.5 Speckles . . . . 28
3.1.6 Random processes and power spectral density . . . . 29
3.1.7 Algebra of random variables . . . . 30
3.2 Instrumentation . . . . 31
3.2.1 Moloreaders . . . . 31
3.2.2 Molographic measurements . . . . 33
3.2.3 Lithography setups . . . . 33
3.3 Software . . . . 34
3.3.1 Control software for moloreaders . . . . 34
3.3.2 Simulation frameworks . . . . 36
3.4 Fabrication processes . . . . 37
3.4.1 Phase mask fabrication process . . . . 37
4 The spatial affinity lock-in amplifier 39 4.1 Paper - The spatial affinity lock-in amplifier . . . . 39
4.2 Chapter conclusion . . . . 60
5 Diffraction limited focal molography - theory, simulation and experi- mental verification 61 5.1 Paper - Diffraction limited focal molography . . . . 61
5.2 Chapter conclusion . . . 107 6 Combined sensing principles and direct comparison of refractometric
and diffractometric methods 109
C
ONTENTSxiii
6.1 Paper - Direct comparison of refractometric and diffractometric
biosensors . . . 109
6.2 Chapter conclusion . . . 142
7 Noise analysis of focal molography 143 7.1 Some general comments on noise . . . 143
7.2 Noise sources in biosensors . . . 144
7.2.1 Intrinsic noise sources . . . 145
Bulk noise sources in thermodynamic equilibrium . . . 146
7.2.2 Power spectral densities (PSD) of intrinsic bulk noise sources 147 7.2.3 Bulk noise limit for a macroscopically referenced sensor in DI water . . . 149
7.2.4 Influence of molecules - bulk concentration noise and ad- sorption/desorption noise . . . 151
7.2.5 Conclusion - Intrinsic noise sources for macroscopically ref- erenced refractometric sensors . . . 155
Effect of spatial referencing on intrinsic noise sources . . . 156
7.2.6 Conclusion intrinsic noise sources . . . 158
7.2.7 Extrinsic noise sources . . . 159
7.2.8 Optical shot and read noise . . . 159
Photon shot noise limit of focal molography . . . 160
Shot noise limit for other diffractometric biosensor arrangements . . . 162
Shot noise limit when only a fraction of the available photons can be captured . . . 164
Experiments to support the statements on the shot noise limit . . . 166
If not shot noise - what limits the resolution at low bias on short time scales? . . . 167
7.2.9 Quantization/algorithm noise . . . 168
7.2.10 Environmental noise sources in diffractometric biosensors . 169 Mechanical noise . . . 170
Stray light interferences . . . 172
Beam envelope stability . . . 176
7.3 Ways to reduce the dominating environmental noise sources - stray
light and beam envelope instability . . . 180
7.3.1 Influence of reduced spatial coherence of the laser source . . 181
7.3.2 Influence of reduced temporal coherence of the laser source 181 7.4 Chapter conclusion . . . 183
8 Conclusion and outlook 185 References 191 A Fabrication of molecular holograms 205 A.1 Introduction . . . 205
A.2 Reactive immersion lithography . . . 206
A.3 Optimization of phase shift masks . . . 207
A.3.1 Methods . . . 207
Phase mask simulations . . . 207
A.3.2 Theory of phase shift mask . . . 208
A.3.3 Talbot effect . . . 212
A.3.4 Anomalies in guided mode resonance phase shift masks . . 213
A.3.5 Phase shift masks for the fabrication of molecular holograms 218 A.3.6 Robust optimization of chirped phase shift masks . . . 221
Robust optimization algorithm . . . 223
Optimal vs. robustly optimized phase shift masks . . . 225
Performance of robustly optimized phase shift masks for fo- cal molography . . . 226
A.3.7 Substrate reflections . . . 228
A.3.8 Conclusion robust phase mask optimization . . . 229
A.4 Displacement Talbot lithography in combination with inverse RIL as a way to fabricate high quality molecular holograms . . . 231
A.4.1 Displacement Talbot lithography . . . 232
A.4.2 Paper - Image reversal reactive immersion lithography im- proves the detection limit of focal molography . . . 234
A.5 Chapter conclusion . . . 239
Curriculum Vitae 241
CHAPTER 1
Introduction
1.1 The significance of information on the presence of molecules and their interactions to life
Molecules and their interactions are the basis for life. Cells and multicellular organ-
ism can only function when they precisely monitor and control their cellular pro-
cesses. [2] It starts with the negative feedback loops that regulate the expressions of
proteins to the ones that maintain homeostatis of complex organisms. [3] In humans,
chemoreceptors in concert with hormonal substances are key to regulate all internal
body processes such as the immune system, digestion, mood and emotions, energy
storage, body temperature, blood pH and glucose concentration. [4] Besides these in-
teroceptors that monitor the body’s internal state, exteroceptors such as olfactory and
taste buds give rise to the sense of smell and taste and allow living beings to interact
with and react to chemical cues in the environment. Such sensors are key for success-
ful survival and reproduction and therefore the oldest senses that have evolutionary emerged.
1.2 Molecular sensors
Humans have a long tradition of emulating and augmenting the senses nature has evolved over billions of years. The technological equivalent of chemoreceptors and taste or olfactory buds are molecular sensors. Molecular sensors transmit chemi- cal information into the digital domain and allow the monitoring of chemical cues and processes. [5,6] Molecular sensors rely on molecular recognition. [7] Thus, they operate based on the binding affinity between a molecule of interest and the affin- ity probe, e.g. an antibody. [8] The binding affinity between the molecule of interest and the affinity probe is stronger than the affinity between probe and background molecules. [9] The main challenge is to translate molecular binding into a quantity that can be measured physically and to maintain the selectivity of the molecular recognition in the transduction. A common subtype of molecular sensors are biosen- sors. According to Anthony P.F. Turner:
Biosensors are analytical devices comprising a biological element (tis- sue, microorganism, organelle, cell receptor, enzyme, antibody) and a physico-chemical transducer. Specific interaction between the target an- alyte and the biological material produces a physicochemical change de- tected by the transducer. The transducer then yields an analog electronic signal proportional to the amount (concentration) of a specific analyte or group of analytes. Anthony P. F. Turner [10]
Together with molecule emitting/releasing devices molecular sensors could in principle enable digital feedback loop control of chemical and biological systems.
However, as of 2020 this still remains in the realm of science fiction and systems
that comes closest to such a concept are artificial pancreatic systems. [11] Neverthe-
less, the availability of advanced molecular sensors by itself will already have a
tremendous impact for our daily life and well-being.
1.3. T
OWARDS THE TECHNICAL EMULATION OF ALL SENSES3
1.3 Towards the technical emulation of all senses
How close are we to such advanced molecular sensors? Unfortunately, not as ad- vanced as we are with the emulation of other senses. [10] Especially, if these devices should emulate the human counterpart at a similar form factor and performance. The human sensory system can be subdivided into six subsystems: The visual system, the auditory system, the somatosensory system (sense of touch and pressure), the gusta- tory system, the olfactory system and the vestibular system. [4] Historically, with the invention of the giroscope (1817 [12] ) and microphone in 1877 the vestibular and the auditory system were the first to be emulated technically. [13] Yet only much later, the true miniaturization of sensing devices began. First, there was the urge to solve the "tyranny of numbers" problem that arose due to ever more complex electronical circuits. Only when Jack Kilby and Robert Noyce invented the integrated circuit in 1958 this was finally overcome. [14] It took another decade until the first human sense, the sense of vision was miniaturized to chip size. The invention of the CCD chip (charge coupled device) in 1969 and its brother the CMOS (complementary metal oxide semiconductor) chip were the basis for digital photography and computer vi- sion that are nowadays included in pocket sized devices that we call smartphones. [15]
The device is not restricted to vision, a smartphone also includes a miniaturized gyro-
scope, an accelerometer, a barometer, a touchscreen and a miniaturized microphone -
all in one device. [16] Thus, the MEMS (Micro-electromechanical system) revolution,
that started in the 1980s, managed to emulate and miniaturize all the human senses
except the sense of olfaction and the sense of gustation. [17] This is not a surprise,
since these senses can only be emulated with molecular sensors, whereas the other
senses require "just" physical sensors. Nevertheless, there were a few concepts of
molecular sensors based on the MOSFET already proposed in the 1980s, but there
were significant stability and cross-reactivity problems. [18]
1.4 Why are molecular sensors hard when it was easy for evolution?
Molecular sensors were easy for evolution because life is built on complex chem- istry, whereas electronics and modern information processing is built on physical processes in a very narrow set of semiconducting materials. In addition, biosensing is a challenging field because it is extremely interdisciplinary. It lives at the intersec- tion of physics, engineering, chemistry and biology. [19] Unfortunately, a meaningful biosensor requires fundamental as well as expert knowledge in almost any of these subfields. Usually, this is only obtained in a rigorous study of the subject. While (organic) chemists and biologists or physicists and engineers still somewhat share an overlapping jargon and mutual understanding, a physicist and a biologist usu- ally require an interpreter and even then it is hard to communicate. This is widely seen in academia, with physicist groups developing ever more sophisticated sensing concepts that fail to address the needs of the biologist and vice versa the biologist groups knowing what the problems are but not how to solve them. Only in the last two decades interdisciplinary curricula such as nanoengineering, material science or bioengineering were initiated that educated scientists with sufficiently broad back- grounds to advance this field.
1.5 Molecular sensors today
Molecular sensors today are not yet in our smartphones but they do exist. [20] Most
of the time as bulky lab-scale instruments that require precise temperature stabiliza-
tion and sophisticated read-out equipment. Devices to measure the thermodynam-
ics and kinetics of biomolecular interactions are particularly popular and are one
of the key pillars of (bio-)analytics. They are widely used in drug screening and
molecular diagnostics. [21,22] These are devices that detect the binding of molecules
label-free, i.e. without any signal amplifying label such as a fluorophore or nanopar-
ticle. [23] Label-free detection requires the detection of a property that is shared by
all biomolecules, e.g. the mass density or the electromagnetic polarizability. [23] A
property that can be detected with high sensitivity is the relatively high refractive
1.5. M
OLECULAR SENSORS TODAY5
index of biomolecules compared to water. [24] It comes therefore at no surprise that the most sensitive biosensing methods are optical methods.
1.5.1 State of the art - refractometric molecular sensors
Refraction is the de facto standard optical method to detect biomolecular binding. [25]
Surface plasmon resonance (SPR) is most widespread, mainly because of a good
combination of sensitivity, a relative simple read-out/chip fabrication and also his-
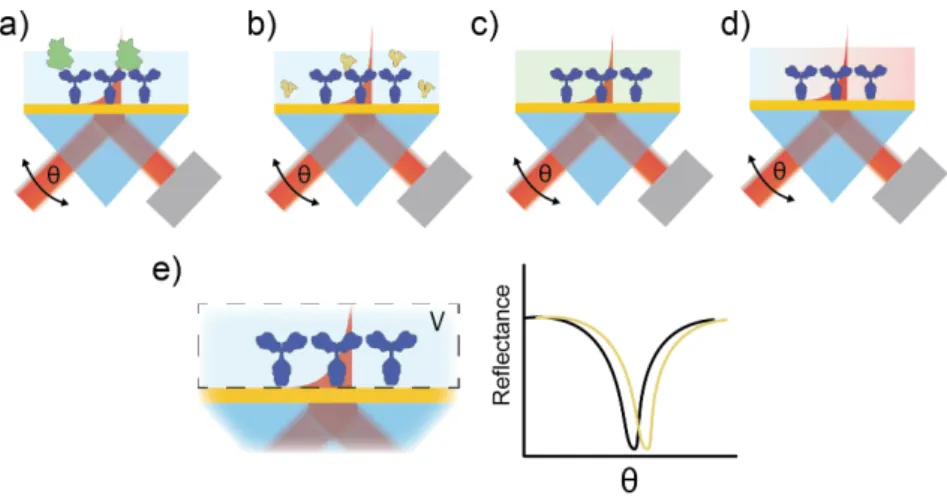
torical reasons. [26] The operating principle is summarized in Figure 1.1.
Figure 1.1: Principle surface plasmon resonance.
[27]A TM (transverse magnetic) polarized beam of light is incident on a gold coated glass slide via a prism. At a certain angle the in- plane momentum of the incident beam and the surface plasmon polariton match and energy transfer can occur. The in-plane momentum of the surface plasmon polariton is dependent on the cover refractive index within the evanescent field of the plasmon. When the refractive index of this adlayer changes the resonance condition and by this the angle of the surface plasmon resonance condition changes. The surface is functionalized by capture molecules.
When the analyte binds, the refractive index and hence the resonance angle is altered. Plotting the resonance angle as a function of time yields a binding curve. (Figure adapted from the Master thesis of Katharina Kübrich
[28])
In the past three decades, scientist and engineers have developed a plethora of
other advanced refractometers that measure the refractive index close to the surface
of a functionalized substrate. [25,29–32] The high surface sensitivity is mediated by
evanescent waves of surface plasmons or waveguide modes that confine the electro-
magnetic field to a few 100 nm above the substrate. [33] Figure 1.2 gives an overview
of the broad field of refractometric sensing by guided evanescent waves. Despite
their complexity and different architecture these sensors underlie the same physical
1.5. M
OLECULAR SENSORS TODAY7
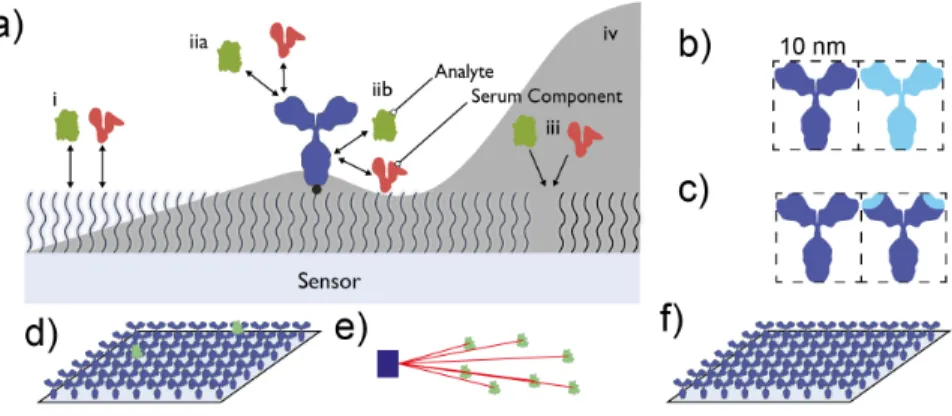
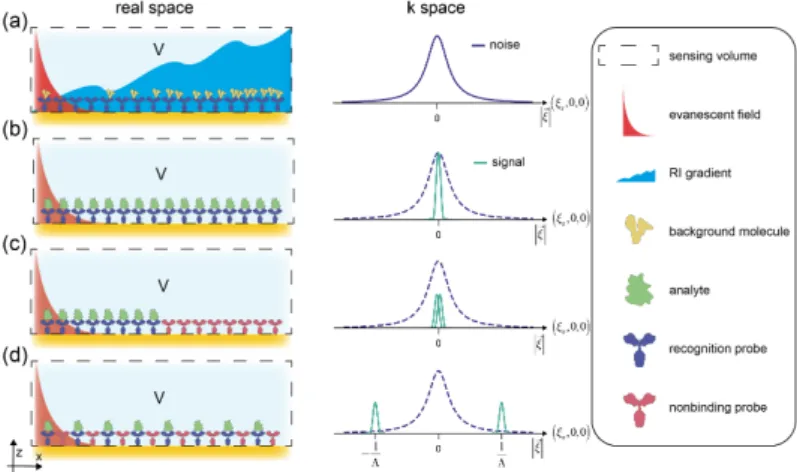
principle in that they integrate the refractive index in a volume close to the sur- face. This integrative property is problematic. First, because the sensing volume is much larger than the size of a molecule and second because the cause of the re- fractive index change of the sensing volume cannot be discriminated (Figure 1.3).
Besides the molecule that binds specifically to the capture probe (Figure 1.3a), in complex biological media there are other molecules present. Since the concentra- tion of these background molecules is much higher than the analyte’s, already a low affinity (mM) is sufficient to cause substantial surface binding (Figure 1.3b). In ad- dition, experimental and environmental noise sources, such as buffer changes and temperature gradients (Figure 1.3c,d), also alter the refractive index and affect the sensing response (Figure 1.3e). Therefore, most refractometric biosensors can only be operated under stable conditions (continuous flow of buffer and temperature stabi- lization), which precludes any meaningful miniaturization of these devices. [34] In ad- dition, despite impressive short term resolutions of 10
−8 refractive index units (RIU) (approximately 10 fg/mm 2 ) [35] , even stabilized devices experience significant drift, which over the timescale of an experiment limits the resolution to 1-5 µRIU (1-5 pg/mm 2 ). [36] It is not an insufficient sensitivity that has impeded the miniaturization and widespread adoption of molecular sensors. It is their cross-sensitivity especially to environmental influences. It stems from the large ratio of the sensing volume compared to the size of a molecule. It comes therefore at no surprise that even re- fractometric biosensors with reference channels require stabilization. [37] However, it was demonstrated that refractometric biosensors become increasingly more robust the closer together and the more numerous the reference and signal regions are. [38]
The solution to the environmental noise susceptibility problem of current biosensors
is therefore straightforward: perform referencing at or close to the molecular length
scale.
Figure 1.2: Selection of refractometric (bio-)sensing principles (Figures reproduced with per- mission from
[31,32]) a) surface plasmon resonance
[20]b) in- and output grating couplers
[39,40]c) interferometric principles
[25,31,41,42]d) ring resonantors
[43]e) fiber-bragg gratings
[32,44,45]f) photonic crystals
[32,46]1.6. T
HE IDEAL MOLECULAR SENSOR9
Figure 1.3: Refractometric biosensors cannot discriminate the cause for the refractive index change in the sensing volume: a) specific binding signal b) nonspecific binding signal c) buffer changes d) temperature gradients all affect the refractive index in the control volume e) and in the case of surface plasmon resonance lead to a change in the resonance angle θ .
1.6 The ideal molecular sensor
Typical biosensors are surface based devices where the capture probe is immobi- lized onto a non-fouling polymer coating (Figure 1.4a). This capture probe is in contact with a complex biological sample. This constitutes the molecular sensing problem and by this define the constraints and the potential interferences that can occur in such a system. They are summarized in Figure 1.4. By knowing the con- straints and the interferences one can design a system for optimized performance.
It starts with the polymer coating being non-fouling such that it reduces the adsorp- tion of biomolecules by introducing an entropic penalty. [47] However, there is still a remaining affinity of background molecules to this sensor surface ((i) in Figure 1.4a) that leads to the ubiquitous nonspecific adsorption of molecules to the sensor.
In addition, there are always defects present in non-fouling polymer coatings ((iii)
in Figure 1.4a). [48] These two types of interferences as well as environmental noise
sources due to temperature gradients can be efficiently rejected by referencing on the
molecular length scale. However, the surface of the capture molecule is also a poten- tial origin of an affinity difference compared to the reference probe. [49] Therefore, the capture molecule and the reference probe should be chemically as similar as pos- sible in order to reduce any remaining nonspecific binding difference ((iib) in Figure 1.4a and c). At the example of antibodies this implies that an engineered point mu- tation at the epitope of the reference antibody should destroy the affinity towards the target. [49] This reduces the potential nonspecific binding to cross-reactive binding to the epitope ((iia) in Figure 1.4). The environmental noise and nonspecific bind- ing are not the only interference/constraint on molecular sensors. Molecular sensors rely on transport phenomena as well as molecular interactions for their operation.
Squires et al. wrote an excellent paper on this second issue. [50] The conclusions are rather straightforward, molecular sensors need a certain size and a certain amount of receptors to sense molecules in reasonable timescales and with sufficient precision.
Essential for molecular sensors is also the ability to detect low receptor occupancy
because the affinity of the capture probe is typically limited to roughly 1 nM, whereas
interesting biomarker concentrations are in the sub pM regime (Figure 1.4d). [51] This
leads to only 1 in every 1000 capture probes carrying an actual molecule in thermo-
dynamic equilibrium. These constraints are well met by state-of-the art SPR systems
but not by many nano sensor concepts that are proposed by some academic research
groups. [50] In addition, in order to measure the concentration of a molecule or a
thermodynamic property with the desired precision one always needs to observe a
sufficiently large ensemble of molecules (Figure 1.4e). [52] This is due to Poisson
noise and when a low absolute number of molecules is detected, the uncertainty of
the measurement is √ n (n is the number of detected molecules). For instance, for a
coefficient of variation of 10%, one needs to detect at least 100 molecules. Together
with the requirement to detect low receptor occupancy this implies the simultaneous
observation of close to a million of capture probes (Figure 1.4f).
1.6. T
HE IDEAL MOLECULAR SENSOR11
Figure 1.4: Interferences and constraints in a molecular recognition systems and how they dictate the design of an ideal molecular sensor a) environmental noise sources on a sensor in contact with a biologically complex medium (i) nonspecific binding to the nonfouling polymer layer on the sensor, (iia) crossreactive binding to the epitope of the antibody, (iib) nonspecific binding to the surface of the antibody, (iii) nonspecific binding of analyte and background molecules to defects in the nonfouling polymer layer, (iv) temperature gradient. An ideal molecular sensor should therefore apply b) referencing at the molecular length scale, c) exhibit chemical similarity of most of the surface of the capture and reference probe, d) the ability to detect low receptor occupancy e) as well ensemble detection of molecules and f) simultaneous observation of millions of capture probes.
The requirements of an ideal molecular sensor can therefore be summarized as follows:
1. Referencing at the molecular length scale
2. Chemical similarity of capture probe and reference probe for affinity equaliza- tion towards background molecules
3. Detection of low capture probe occupancy 4. Detection of an ensemble of biomolecules
5. Simultaneous observation of millions of capture probes
Thus, the key for robust molecular sensors is to find an effective transduction
principle that allows referencing close to the molecular scale on mm-scale sensing
devices. Unfortunately, due to intrinsic limits such as the surface plasmon propa- gation length or diffraction blurring, refractometric principles such as SPR cannot perform referencing smaller than a few tens of microns. [38,53,54]
1.7 Molecular holograms as the ideal transduction principle for molecular sensors
In the coming sections we motivate why observing binding sites holographically is a close to optimal way to incorporate sub-micron referencing in 0.1 mm - mm-scale molecular sensors and how this overcomes the cross-sensitivity issues of refracto- metric transducers.
1.7.1 A brief history of holography
In 1801, a scientist named Thomas Young discovered something astonishing. The illumination of a double slit aperture by a candle through a pinhole produced an os- cillating pattern of intensity on a distant screen. The phenomenon of interference was discovered. [55,56] Interference of (electromagnetic) waves is the basis for holog- raphy, invented by Dénes Gàbor some 150 years later. [57] Gàbor’s motivation was merely to overcome the aberration problems of electron lenses and to improve elec- tron microscopy. He recorded the hologram with an electron beam and recreated the image at optical frequencies. Generally, a hologram is the recording of an in- terference pattern that uses a reconstruction beam and diffraction to recreate a three dimensional image. [58] Optical holograms were only recorded and recreated effi- ciently once humanity discovered and built a light source of sufficient coherence, i.e.
the laser in 1960. [59] Coherence is the basis for interference and the two phenomena
are inherently linked. [58] The laser allowed the creation of large holograms and fu-
elled the field. [60,61] In 2020, we are finally at the point were images produced by
optical holograms might become ubiquitous in wearable holographic displays that
augment our reality. [62]
1.7. M
OLECULAR HOLOGRAMS AS THE IDEAL TRANSDUCTION PRINCIPLE FORMOLECULAR SENSORS
13
1.7.2 Diffraction and diffraction gratings
Diffraction of a reconstruction beam is the basis for holography. [58] Diffraction de-
scribes the phenomena of a wave bending around obstacles. [56,63] In optics, such
obstacles can be described by the difference in refractive index (n + iκ ) compared
to the refractive index of the propagation medium. This can be a difference in the
real (phase) or imaginary (absorption) part of the refractive index. For significant
diffraction, the size of the obstacle must be of the same order of magnitude as the
wavelength. By arranging sub-wavelength obstacles in a spatially regular, i.e. coher-
ent pattern, the diffraction from the pattern can be precisely tailored and enhanced
in specific directions. For example, a periodic pattern diffracts coherent light of
a given wavelength into specific directions that are determined by the diffraction
equation. [56] Such coherent patterns are commonly used in the form of diffraction
gratings. A regular diffraction grating is nothing but an extremely simple hologram,
namely the one of a plane wave of finite extent. As described above, optical diffrac-
tion can be due to a disturbance of phase or amplitude. Phase gratings, which modu-
late the refractive index n, find various applications in spectrometers [64] , as coupling
elements in integrated optical chips [65] , as phasemasks in photolithography [66] and
even for refractometric sensing [67] . An important parameter to asses the performance
of gratings is the diffraction efficiency. It is the ratio between the power diffracted
into a certain order and the incident power, which is relatively easy to measure ex-
perimentally. However, its mathematical description for a given diffractive set-up
is elaborate and no generally applicable formulas exist, in particular for strongly
modulated gratings. [64] Nevertheless, for weak phase modulations, it holds that the
diffraction efficiency increases with the area, the thickness and the refractive index
contrast of a diffractive structure [64] . It is the dependence on the refractive index
contrast or modulation that allows one to build a diffractometric biosensor that de-
tects binding in real-time through the assembly of a molecular hologram. Since this
grating is weak we shall see that it is possible to arrive at closed analytical formulas
for the diffraction efficiencies for certain diffractometric arrangements.
1.7.3 Molecular holograms and diffractometric biosensors
Most label-free diffractometric sensors make use of the same bio-physical property as refractometric sensors for the detection of molecules: the relatively high refrac- tive index of biomolecules compared to the one of water. [49] The difference is that in a diffractometric sensor the molecules bind in the form of a molecular hologram.
The blueprint of this molecular hologram, namely the spatial arrangement of affin- ity probes such that their combined binding state is encoded in a predefined three- dimensional intensity distribution when illuminated by a suitable reconstruction beam, is called "mologram". [49] Preferentially, the arrangement of affinity probes is chosen such that the binding information is condensed in one single diffraction- limited voxel in three dimensional space. Ideally, the molecular hologram has no or very little diffractive power in the unbound state. Binding of the target analyte changes the properties of the hologram such as the thickness or the refractive index contrast. This results in a measurable change of the diffraction efficiency. Thus, bio- molecular interactions can be analyzed and quantified by monitoring the intensity of the hologram. The major benefit of diffractometric sensors arises from the fact that the fluctuations that limit refractometric sensors (temperature variations, changes in sample composition and non-specific binding) are not spatially coherent. In other words, they do not occur in a regular pattern. Thus, they contribute very little to the intensity of the hologram because the scattered power is radiated mostly uniformly in all spatial directions. 1 The power diffracted by the molecular hologram therefore represents the integrated and reference subtracted binding information of all recep- tors. The remarkable thing is that the coherence and wave nature of light does all the necessary signal processing. Coherence performs the sub-micron reference subtrac- tion, because the phase of light naturally oscillates over one signal and one reference region and the free space propagator creates the Fourier plane to observe all recep- tors in one point. [69,70] Molecular holograms therefore perform referencing close to the molecular length scale (few 100 nm) and can simultaneously monitor millions of receptors in a mm-scale diffraction grating at one diffraction-limited region in three
1
The concept of molecular holograms should not be confused with refractometric sensing based on
diffraction gratings (holographic sensors or photonic crystal sensors
[68]), where the spectral response
(such as the direction of a certain diffraction order) is measured due to a change in the refractive index
surrounding the grating.
[67]Such a sensor is purely integrative and does not have the sub-micron refer-
encing built in.
1.7. M
OLECULAR HOLOGRAMS AS THE IDEAL TRANSDUCTION PRINCIPLE FORMOLECULAR SENSORS
15
dimensional space. Despite this inherent advantage, the field of diffraction based biosensing is not equally well explored as refractometric sensing.
History of diffractometric biosensing
Almost three decades ago, a year after the commercial release of the first surface plasmon resonance device [26] , Tsay et al. [71] introduced the concept of diffractomet- ric sensing by detecting choriogonadotropin, a hormonal biomarker, in serum. Fur- ther development of the technology enabled the detection of volatile compounds [72]
and multiplexed signal readout. [73,74] Labeled approaches for signal enhancement were developed using gold nanoparticles or enzyme amplification. [75,76] These ef- forts resulted in DotLab TM , a commercial device based on diffractometric sens- ing. [77–79] Further approaches to enhance the signal were applied by using differ- ent optical configurations. [80–82] Others have focused on an indirect diffractometric approach, by forming a coherent pattern in a hydrogel, which changed its shape upon target exposure. [83–85] The shape change resulted in a change of diffraction efficiency. More recently, the technology has been applied to monitor bacterial growth [86] or to detect low molecular weight organic compounds by means of a competitive assay [87] . In addition, a low-cost diffractometric readout and pattern- ing system based on compact disk technology [88] has been demonstrated. As of 2020, Axela Biosciences, who commercialized the DotLab technology, was bought by Angle and included into their Parsortix technology. Therefore, there exists no commercially available diffractometric instrument.
1.7.4 Challenges in the implementation of diffractometric biosensors
Diffractometric biosensors represent only a niche in the sensing field, despite the
promise of solving the cross-sensitivity problem. Why have diffractometric biosen-
sors not yet entered the market on a scale similar to refractometric biosensors? The
answer is rather simple, diffractometric biosensors demonstrated in literature were
not as sensitive as refractometric ones and there is no rigorous theory for the quan-
tification of the diffractometric signal. [35] The sensitivity issue is mainly because it is
easy to build a bad diffractometric biosensor but it is extremely challenging to build
a good one. The quality of the pattern and the sub-micron periodicity of the affinity modulation is crucial to efficiently reduce environmental noise. The surface chem- istry is crucial to preserve the functionality of the immobilized capture molecule as well as to reduce nonspecific adsorption. Darkfield illumination and straylight re- duction are crucial, because of the detrimental effect of interference with the signal.
Observation in the far field (i.e. focusing) is crucial to efficiently separate the sin- gle Fourier component of the signal from the scattering background. [89] All diffrac- tometric biosensors described in literature are compromised in at least one, often multiple of these pillars (Figure 1.5). Especially, the darkfield illumination and the sub-micron affinity modulation are often not met. This is the reason why diffrac- tometric biosensors are not yet as sensitive as refractometric ones, not because the transduction principle is inferior.
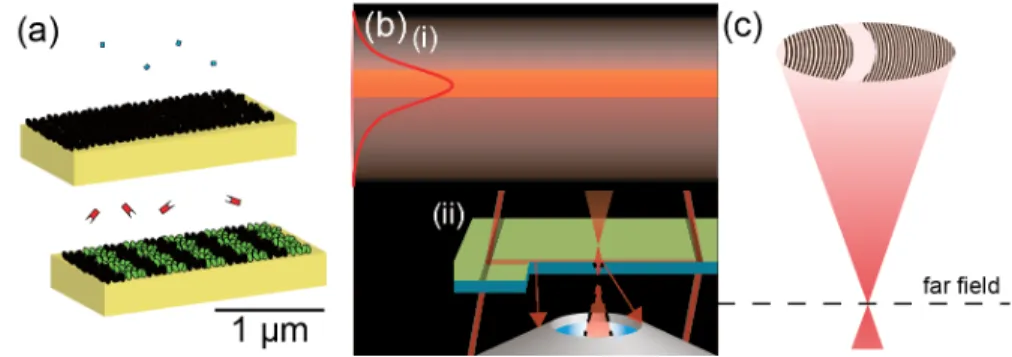
Figure 1.5: The three pillars of a sensitive diffractometric biosensor: a) a submicron affinity modulation b) i) darkfield illumination by the evanescent field of guided or totally internally reflected modes ii) efficient straylight reduction in the detection path by matching the aperture of the mologram to the optical system c) observation in the far field (near to far field transfor- mation through diffraction-limited focusing) such that the Fourier component of the signal is clearly separated from all other Fourier components that constitute the noise.
1.7.5 Focal molography - or how to implement diffractometric biosensors
Focal molography was introduced as a theoretical concept by Christof Fattinger
in [49] . Briefly, in waveguide based focal molography, the mologram is situated on a
high-refractive-index slab waveguide and illuminated by the fundamental TE mode
1.7. M
OLECULAR HOLOGRAMS AS THE IDEAL TRANSDUCTION PRINCIPLE FORMOLECULAR SENSORS
17
(Figure 1.6). The evanescent field of the waveguide assures that only the first few 100 nm of the sample is illuminated. In addition, the mologram forms a diffractive lens that produces a Fourier plane image only a few hundred microns away from the surface by focusing the diffracted power holographically onto an Airy disk. Since the first diffraction order is focused, the grating periods of the mologram are only in the range of 290-420 nm. Thus, the affinity modulation is sub-micron. Focal molography is therefore the first diffractometric sensor that fulfills all pillars of a sensitive and robust biosensor and therefore may exhibit resolutions in direct bind- ing assays that are comparable to and likely even better than the best refractometric sensors. [49,66]
Figure 1.6: The principle of focal molography (Figures reproduced from with permission
[66])
CHAPTER 2
Scope of the thesis
This thesis was motivated by my fascination for natural sciences and the interdisci- plinarity that comes with the field of biosensing.
Sometimes the experience of an entire career is required to make significant sci-
entific progress. This is especially true for interdisciplinary fields such as biosensing,
which requires in-depth understanding of physics, engineering, chemistry as well as
biology. After being trained for nearly 10 years in optics and 25 years in the phar-
maceutical industry at Roche, Christof Fattinger brought together the know-how and
experience which lead to the conception of the idea to use holography for molecular
detection. It was simply a theoretical concept back in 2014 and molecular holo-
grams were yet to be created. All that was available was a theoretical paper written
by Christof Fattinger, providing an analytical model as well as a few order of mag-
nitude estimates of the detection limit of this new class of biosensors. At the start of
my PhD, Volker Gatterdam had already been working on the project for half a year
and soon after, on the 19th of December in 2014 the first molecular holograms made
from streptavidin bound to a biotin mologram were created and imaged at Roche Diagnostics in Rotkreuz, Switzerland by an alienated ZeptoReader (Zeptosens AG) (Figure 2.1).
In the introduction, I gave a quick overview of the very few diffractometric biosensors that have been developed. Compared to the refractometric biosens- ing field, which have a solid theory behind almost any device, the diffractometric biosensing field was virtually non-existent when I started my PhD. In order to accu- rately assess the potential of a new technology one needs to have a clear understand- ing of its inner working principles and how it compares to the state-of-the-art. My primary goal was therefore to provide a solid theoretical and experimental basis to prove that diffractometric biosensors can be as sensitive as refractometric biosensors without the need of temperature stabilization. This property together with advances in integrated optics will hopefully enable miniaturized molecular sensors to become ubiquitous and not only restricted to the drug discovery lab. The thesis is subdivided into eight chapters and an appendix. Chapter 1 and 2 are the introduction and the scope of this thesis. In Chapter 3, I summarize a few theoretical concepts which are important for the analysis of diffractometric biosensors and experimental tools, soft- ware and processes I developed during my thesis. It is followed by four chapters that together explain the stability of diffractometric biosensors theoretically, demonstrate the experimental feasibility, verify the analytical equations, compare refractometric and diffractometric biosensors in various experiments and provide fundamental lim- its of label-free biosensors. The thesis ends with a conclusion and an outlook. The content of the chapters and the appendix are briefly described below:
The chapter 4 is purely theoretical and explains the very reason why a sub-micron affinity modulation and Fourier space detection are key to obtain robust and simple molecular sensors. It formulates the spatial affinity lock-in principle, which is analo- gous to the time-domain lock-in that has revolutionized metrology and can be found in almost any experimental physics lab nowadays. [90]
After having established a solid theoretical basis in Chapter 4, Chapter 5 is the
experimental proof that diffraction-limited molecular holograms can be fabricated
and read-out. The read-out setup, the moloreader, is explained and real-time as well
as end-point measurements are shown. A framework for the simulation of Rayleigh
scattering of protein ensembles was developed to simulate the three dimensional
21
electromagnetic field distribution in the focal spot of the mologram. In addition, the quantification formulas and algorithms that are needed for a molographic measure- ment are presented and verified. The chapter also introduces the figure of merit of diffractometric biosensors and explains how they can be optimized in the future. The publication contain an extensive summary of the analytical description of roughness scattering on asymmetric optical waveguides.
While Chapter 5 proves the feasibility of highly sensitive quantitative diffrac- tometric biosensors, Chapter 6 shows in a direct comparison between focal molog- raphy and a state-of-the-art SPR (surface plasmon resonance) machine (Biacore 8k) that the predictions of Chapter 4 indeed hold experimentally. The chapter also shows how waveguide based diffractometric biosensors can function as a combined refrac- tometric/diffractometric biosensor. I used this combined biosensor to demonstrate another fundamental advantage of diffractometric biosensors, namely that at the same measurement precision these devices exhibit a much lower baseline noise than refractometric biosensors.
The last chapter I wanted to understand what the fundamental limits for optical label-free detection are. For this, I derive the fundamental noise limits of optical biosensors from a statistical physics treatment of refractive index fluctuations. Fur- thermore, the current limitations of the setup developed in this thesis are identified and highlighted. The impact of environmental noise sources, shot noise limitations and quantization/algorithm noise are investigated.
In appendix A, I briefly describe how molograms are fabricated. The basis of mologram fabrication is the reactive immersion lithography (RIL) process that was developed at the beginning my PhD and is summarized in [66] . A large part of my contribution was to better understand the physics of phase masks that are used in RIL.
The chapter therefore summarizes the resonance effects that occur in such optical
"tuning forks", how they can be optimized and what physical limits are imposed on the performance of the phase shift mask by the fabrication process. In addition, in collaboration with Yves Blickenstorfer I developed a clean room process to fabricate phase shift masks.
In summary, this thesis provides the theoretical explanations and experimental
proofs of the inherent advantages of diffractometric biosensors over established re-
fractometric devices. At the end of the day it all boils down to the fact that the
binding signal in diffractometric biosensors is locked to a high spatial frequency and
that the measurement is performed in Fourier space. I am convinced that the dis-
covery of the spatial affinity lock-in principle is a disruptive step and will lead to a
sustainable change of the molecular sensing field.
23
Figure 2.1: The team that created and sighted the very first molecular holograms on Dec. 19 2014: From left to right: Volker Gatterdam, Michael Glauser, Nenad Milicevic, Christof Fat- tinger, Andreas Drechsler and in the second picture the author of this thesis Andreas Frutiger.
It was obviously also before the advent of the selfie stick, thus we had to take two pictures
to image the entire team and from the yellow light it is obvious that we were dealing with
photosensitive molecules. Two people (Janos Vörös and Klaus-Peter Stengele) that also had a
substantial contribution to this result were not present at this historical moment, unfortunately.
CHAPTER 3
Theory, methods and instrumentation
3.1 Mathematical and physical tools
Most of the necessary theoretical tools to describe molecular holograms have already been derived in the last century. Therefore, we will not repeat what is textbook knowledge but rather point the reader to the appropriate literature. A great summary of most of the necessary concepts is given in part I of the Book of David Nolte:
Optical Interferometry for Biology and Medicine. [91]
3.1.1 Theory of dielectric waveguides
The arrangement of focal molography investigated in this thesis makes use of a single
mode slab waveguide for the illumination of a molecular hologram. [49] A dielectric
waveguide confines and guides electromagnetic waves due to continuous total inter-
nal reflection at the optical interfaces analagous to the well-known telecommunica-
tion fibers. The field distribution of the ideal slabwaveguide is accessible analytically for TE and TM modes alike and extensively discussed in [92] .
3.1.2 Coupled mode theory
Coupled Mode theory is a perturbation theory that is used to describe different op- tical elements such as grating couplers [93] or directional couplers [94] . For diffrac- tometric biosensors it is of fundamental importance because it allows the derivation of the quantification formulas for any diffractometric arrangement. [1] With the re- lationships obtained from coupled mode theory one can compute the coherent mass density on the molecular hologram from the measured diffraction efficiency. [1,89]
Coupled mode theory is based on the fact that an electromagnetic field configuration can be written as a linear combination of orthogonal basis functions (modes). Modes are linearly independent monochromatic (single-frequency) solutions of Maxwell’s equations in a particular system. Often, it is complicated to solve Maxwell’s equa- tions and to determine the electromagnetic fields for the system at hand. Therefore, an ideal system is considered, in the case of focal molography, a planar substrate with a high refractive index layer on top of it. The ideal system should be similar to the real system, but allow for Maxwell’s equations to be solved more easily. In our case, by virtue of the translational invariance of the ideal system in the xy-plane, the solutions of Maxwell’s equations can be labeled by in-plane momentum and polar- ization (and propagation direction perpendicular to the plane for freely propagating modes). Those solutions provide a complete orthogonal set of modes, into which the electromagnetic field of the real system can be expanded [92] . Mathematically,
~ E = ∑
ν
c
νe
−i~βν·~r~ E
ν(z)
~ H = ∑
ν
c
νe
−i~βν·~rH ~
ν(z)
(3.1)
where c
νis the expansion coefficient of mode ν. 1 It should be noted that compared to Ref. [92] , Eqn. (3.1) has been generalized to two dimensions with ~ β
νbeing the
1cν
varies slowly in space (on length scales much larger than 1/|
~βν|),cν=cν(x,y). Note that theset of modes is labelled by a continuum of in-plane wave-vectors
~βν, and thus the sums must actually be
thought of as integrals.
3.1. M
ATHEMATICAL AND PHYSICAL TOOLS27
projection of the wavevector ~ k onto the xy-plane and~ r ≡ (x, y) is the position vector in that plane. The expansion coefficient c
νis directly related to the power carried by the mode ( [92] Eqn. (5.2-1)).
P
ν= | c
ν| 2 (3.2)
where || stands for the absolute value.
The difference between the real and the ideal system is treated as a perturbation.
Due to their mutual orthogonality the modes are uncoupled and thus cannot exchange energy between one another in an ideal system. The perturbation, however, induces a coupling between the modes and leads to an exchange of energy between them. This is described by coupled mode theory. In order to determine the diffraction efficiency between certain modes one can simply apply Eqn. (3.2) and analyze the (spatially averaged) ratio between the expansion coefficients of the incoming and the diffracted modes. An extensive description of the formalism and the quantification formulas for any two dimensional diffractometric biosensor are given in [1] .
3.1.3 Fourier optics
Fourier optics can compute the field distribution in the far-field as long as the field distribution is known at a certain plane by a simple two dimensional Fourier trans- formation. It is based on the superposition principle of plane waves. Fourier optics is a mature field and Goodman wrote an excellent book about it. [69] Fourier optics is important for molography because the focal plane of the mologram is a Fourier space representation of the refractive index distribution on the surface of the waveg- uide. Thus, because of the superposition principle every point in this plane can be attributed to a spatial in-plane grating vector of the refractive index distribution or in other words one of its Fourier components. Fourier analysis is therefore mainly used in the context of the spatial affinity lock-in and the noise analysis chapter.
3.1.4 Scattering
The signal as well as the background in focal molography stem from an ensem-
ble of scatterers. These scatterers can be distinct molecules (δ -peaks) or extended
fluctuations of the refractive index distribution at interfaces or within homogeneous dielectrics.
Scattering at molecules/particles
Scattering at molecules and small particles (<10 nm radius) is convenient from an analytical perspective since radiated field distribution is accurately described by Rayleigh scattering. [95] The theory of scattering of protein particles is summarized in [89] .
Scattering of isotropic media
Scattering in isotropic media is due to minuscule fluctuations in the refractive in- dex that are itself caused by fluctuations of the intrinsic thermodynamic quantities, density and temperature. These fluctuations have static and dynamic components.
In the case of glasses the majority of the scattering is due to static components of
"frozen" density fluctuations that were present at the glass transition temperature of the material. [96] In the case of fluids like water most of the components are dynamic.
Near phase transitions these fluctuations can become very extended, a phenomenon known as critical opalescence. [97] A good introduction into molecular scattering is provided by the book of Fabelinski. [98]
Scattering at surface roughness
At the interface of two materials of different refractive index, the height variation of the interface also leads to scattering. For waveguides, the theory is summarized in the two papers [99,100] .
3.1.5 Speckles
Scattering at a random ensemble of molecules or at surface roughness leads to a
characteristic distribution of the intensity at a distant plane - a speckle pattern. [101]
3.1. M
ATHEMATICAL AND PHYSICAL TOOLS29
Speckles arise because the scattering process is a random walk of individual scat- tering phasors in the complex plane. A phasor is a vector description of the electro- mangetic field’s amplitude and phase in the complex plane. The statistics of speckles is important for the detection limit of focal molography in endpoint measurements and also to determine the uncertainty in a molographic measurement. [89] Goodman wrote an excellent book on the statistics and properties of speckles. [101]
3.1.6 Random processes and power spectral density
Here we summarize some basic connections between the autocorrelation function, the power spectral density and the power in random processes. For more information on the topic see the two excellent books. [102,103] Continuous time random processes are usually described by their mean function and their autocorrelation function. This is however not a complete description, but a practical solution. [102] Throughout this thesis I will assume wide sense stationary random processes, which indicates that the mean µ
Xof the random process is constant in time or space and the autocorrelation function R
X Xis only a function of the distance in space and time.
µ
X(t) = h x (t) i = µ
X= const (3.3) R
X X(t ,t + τ) = h x (t) x(t +τ) i = R
X X(τ) (3.4) The time averaged normalized power in a random process is equal to the autocor- relation function evaluated at τ = 0, which is also equal to the variance of the random process provided that the mean is zero. In addition, the Wiener-Khinchine-Einstein Theorem [102] states that the autocorrelation function and the power spectral density (PSD) form a Fourier transform pair and from Plancherel’s theorem it follows that the integrated PSD is equal to the average normalized power. [104]
P ¯ = R
X X(0) = x 2 (0)
= σ
X2 + µ
x= Z
∞−∞
S ( f ) d f (3.5)
An important power spectral density is the one of a low pass filtered white
noise random process. The autocorrelation function of such a process is a decay-
ing exponential with a correlation length L
cor a correlation time τ
c. The resulting
Lorenzian power spectral density is a solution to the Langevin equation (Chapter 13 in [105] ), which represents common random processes of diffusion or generation- recombination phenomena. [106,107] We will see that it can be used to model most of the intrinsic noise processes of biosensors in Chapter 7.
R
X X(τ) = g 4 exp
− τ τ
cS ( f ) = gτ
c1 + (2π τ
cf ) 2 (3.6) g is the stochastic source term of the white noise process and τ
cis the characteristic time constant. The power spectral density in this thesis is always one sided (only frequencies from 0 to ∞). Thus the stochastic source term and the average power are related by:
P ¯ = Z
∞0
τ
cg
1 + (2π τ
cf ) 2 d f = g
4 (3.7)
Since a biosensor usually samples with 1 Hz [35] and a typical biosensing experiment lasts from a few mins to tens of mins, one wants to know the noise power in a certain frequency band. For the power spectral density of the low pass filtered process this is available in closed form:
Z
ba
![Figure 1.1: Principle surface plasmon resonance. [27] A TM (transverse magnetic) polarized beam of light is incident on a gold coated glass slide via a prism](https://thumb-eu.123doks.com/thumbv2/1library_info/3903066.1524782/22.629.69.558.76.405/figure-principle-surface-resonance-transverse-magnetic-polarized-incident.webp)
![Figure 1.2: Selection of refractometric (bio-)sensing principles (Figures reproduced with per- per-mission from [31,32] ) a) surface plasmon resonance [20] b) in- and output grating couplers [39,40]](https://thumb-eu.123doks.com/thumbv2/1library_info/3903066.1524782/24.629.70.565.65.354/figure-selection-refractometric-principles-figures-reproduced-resonance-couplers.webp)