Policies/Str
How to Derive BATAELs from Operational Values for the Waste Incineration BREF Revision?
– A Proposal –
Hubert de Chefdebien and Guillaume Perron-Piché
1. Setting the background: the IPPC Directive ...18
2. First BREFs under the IPPC ...19
3. The IED: a strengthened approach ...19
4. Waste incineration under the IED ...20
5. Evolution of waste incineration since 2006 ...20
6. What are the challenges for the WI BREF revision? ...22
7. First conclusion: specific BATAELs derivation method is needed ...24
8. Second conclusion: data-driven BATAELs derivation ...24
9. A race to the bottom? ...25
10. Deriving air BATAELS from plants implementing BATs: our proposal ...25
10.1. Among the sets of data provided by the plant operators, identify the lines with a well-performing flue gas cleaning system ...25
10.2. Choosing the 95th percentile to remove potential bias ...26
10.3. Setting up the ½-hour average Column B and daily average BATAELs ...26
10.4. Setting up the ½-hour average Column A BATAELs ...26
10.4.1. The lower end of the ½-hr average Column A BATAELs range ...26
10.4.2. The upper end of the ½-hr average Column A BATAELs range ...27
11. Derivation method in summary ...27
11.1. For each of these lines, identify the candidate values ...27
11.2. Derive BATAELs ...28
Policies/Str 12. Testing the method ...28 13. Conclusion ...29 14. Glossary and References ...29 For many years European industrial emissions policy has taken an integrated approach, with the use of Best Available Techniques at its heart. While not originally mandatory, by 2010 the conclusions of the reference document outlining best practice for waste incineration became legally-binding. Now however, those reference documents are to be revised, along with the emission limits they set. How will this be done? This ma- nuscript presents a method to derive BATAELs, detailed further.
1. Setting the background: the IPPC Directive
Europe leads the world in environmental protection policies, in particular thanks to the Best Available Techniques (BATs) and BAT Reference Document (BREFs) which seek to minimise industrial activities’ environmental impacts through the use of proven techniques and technologies. With the new approach under the Industrial Emissions Directive (IED), where BREFs become legally-binding, the way they are written needs to be adapted.
With the ongoing revision of the Waste Incineration (WI) BREF, it is important to note that the European waste incineration industry already achieves very good emission results.
Since the mid-1990s, the cornerstone of the European industrial emissions policy has been an integrated approach. Simply put, it is not wise to protect an environmental media, such as air, by shifting the burden elsewhere – for example through greater use of energy or water.
The integrated approach was outlined in 12 criteria listed in the Integrated Pollution Prevention and Control (IPPC) Directive from 1996. These criteria include for instance the emissions to air and water, the consumption of raw materials, the energy efficiency, the need to prevent risks or accidents and the use of low-waste technology.
The IPPC Directive became the leading Europe-wide legislation assessing industrial activities’ impacts while also balancing each industry’s specific realities and costs rela- ted to environmental protection. It brought this integrated approach to the permitting process, and all EU industrial installations were henceforth required to have an environ- mental permit to operate and to implement BATs to reduce their environmental impact, while however stopping short of mandating uniform limits for all industries at the Euro- pean level. Some sectors, such as waste incineration, were already covered at a European level and many Member States of the then EU15 had stringent requirements on other industries.
Identifying these Best Available Techniques for various industries was to be laid down at a later stage in BAT Reference Documents, the well-known BREFs.
Policies/Str
2. First BREFs under the IPPC
The IPPC Directive created an Information Exchange Forum, managed by the European Commission’s Joint Research Centre’s Seville location, called the European IPPC Bu- reau (EIPPCB). The Forum, convened by the Commission and comprising Industries, Member States and Non-Governmental Organisations, also created sector-specific Technical Working Groups (TWGs).
These were set-up to exchange and identify BATs based on input from the involved parties, and agree on what could be done, for example, to minimise air emissions. From this exchange, 33 BREF documents were written covering all the industry sectors in the scope of the IPPC Directive. These massive technological textbooks, each hundreds of pages long (precisely 638 pages for the WI BREF published in 2006), include a list of Best Available Techniques, some of them with related BAT Associated Emission Levels (BATAELs), which indicate the average emission levels reachable under normal operation.
The existing BREFs, which are available freely online, were to give operators and com- petent authorities information on what can be considered BAT for the sector and what levels of emissions can be reached when implementing them.
However applying the BATs from these BREFs was not mandatory and there was no direct link between the levels of these IPPC-BATAELs and the Limits set up as Emission Limit Values (ELVs) in the permits.
3. The IED: a strengthened approach
Between 2007 and 2010, the EU Institutions recast the IPPC Directive, keeping the Integrated Approach and merging it with six other Directives, including the Waste Incineration Directive (WID), the Large Combustion Plants (LCP) Directive (covering the thermal power plants sector) and four other sectorial directives under the IED.
Moreover, the ELVs laid down in the former directives for incineration and a few other industries were copied in the IED. The difference is that they became considered as maximum ELVs, a kind of safety net. The new general rule is that the ELVs to be set up in the operating permit by the competent authority must not be higher than the sector’s BATAELs.
There is therefore a major change in the BATAELs’ essence since, instead of a typical level as it was under the IPPC, it will from now on be a ceiling value for Emission Limit Values in the permit (Figure 1). This is actually recognised by Article 13.7 of the IED, implying that the existing (IPPC) BATAELs are not to be used to set ELVs with the legally-binding nature of the new Directive. And, therefore, new IED-com- patible BATAELs must be elaborated.
Policies/Str
Figure 1:
Under the IPPC Directive, BATAELs were typical average values obtained in operation when implementing the Best Available Techniques. The new IED-compatible BATAELs, which aim at capping the ELVs set up in the permits, must be elaborated differently
IPPC IED
(mg/Nm3)
ELVs (LIMIT) according to WID 2000
The same values became Max ELVs (Safety net) under IED
IED-BATAELs = ceiling for ELVs to be set up in permit
New ceiling for ELVs IPPC-BATAELs = Typical
LEVELS obtained in operation when using BATs
4. Waste incineration under the IED
In 2010, when the IED was published, waste incineration had already been complying for years with very strict requirements, in stark contrast to other sectors that demanded and obtained transitional plans in the IED to continue emitting more than their ELVs.
Indeed, waste incineration has been regulated by the WID since 2000, itself a follow-up of two directives from 1989 on prevention of air pollution from municipal waste incine- ration plants. For example, despite the large fluctuations in the pollutants load upstream of the Flue Gas Cleaning systems, waste incineration plants are controlled on a much larger number of substances than any other industry.
For the few substances also regulated in other industries (such as SOX or Dust), waste incinerators have lower ELVs and with much less possibility to derogate or exceed them.
Finally, ELVs for incineration plants must be complied with, not only in Normal Operating Conditions (NOCs) like for other industries, but during Effective Operating Time (EOT) which includes NOCs and most Other Than Normal Operating Conditions (OTNOCs).
The generalised compliance with these very stringent requirements was the result of a combination of a dynamic industry supplying Flue Gas Cleaning equipment guaranteeing compliance with ELVs, and of the widespread use of such equipment in the EU plants.
5. Evolution of waste incineration since 2006
When examining government-issued emission reports compiling all emission sources, it is clear that waste incineration is not a problem for air quality. This was even recog- nised by leading decision-makers such as Jürgen Trittin from the Green Party, who was Minister for the Environment in Germany. These declarations were also supported by scientific studies, all recognising that the current emissions from waste incinerators in the EU are so low that they are not a key issue for environment or health.
Policies/Str
On the other hand, unlike many other sectors that still have room for reducing their emissions – and for which the IED was designed – there is nearly no margin to lower limits for incinerators because the levels currently obtained result from the use of Best Available Techniques for decades. In short, since operation already is at the optimum trade-off between releases and consumptions, further lowering air emissions at the stack would increase environmental impacts elsewhere.
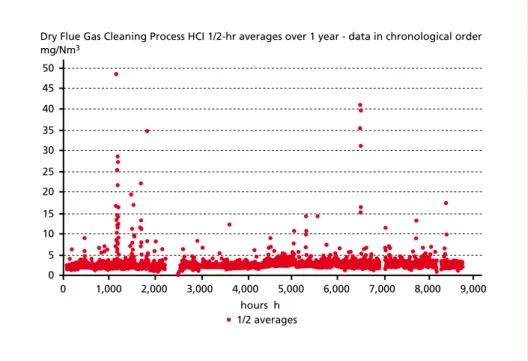
Figure 2: In chronological order all the ½-hr average values of HCl measured over a year after treatment in a typical and efficient Flue Gas Cleaning system of the Dry type installed on a Municipal Solid Waste incinerator line. When looking at this graph, the typical LEVEL of emissions to consider (i.e. BATAELs according to the IPPC Directive) for this line would be, let us say, between 1 and 6 mg/Nm3. However, the value from this line to consider in order to establish a ceiling value not to be exceeded by Emission Limit Values (i.e. BATAELS according to the IPPC directive) will be around 50 mg/Nm3.
Source: Graph by L. Kosior, SITA
For instance, in some cases it is possible to slightly reduce the emission of a certain pollutant by overdosing a reagent. But at the low emission level already reached by incineration (Figure 2), a slight improvement for air will require consuming far more resources (Figure 3), thus generating more waste. This is because each extra quantity to capture beyond the optimum is exponentially more difficult and costly to abate than the first ones in a raw gas. Would it not have been better to use this extra reagent on other sectors where such pollutants are poorly or not abated?
2,000 3,000 4,000 40
35 30
15 10 5
Dry Flue Gas Cleaning Process HCI 1/2-hr averages over 1 year - data in chronological order mg/Nm3
0 1,000
hours h 0
25 20 50 45
5,000 6,000 7,000 8,000 9,000
1/2 averages
Policies/Str
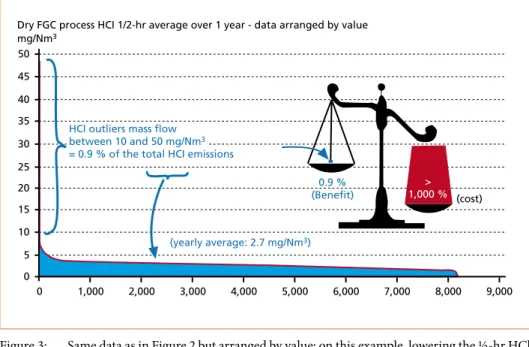
Figure 3: Same data as in Figure 2 but arranged by value; on this example, lowering the ½-hr HCl ELV from 60 to 10 mg/Nm3 would reduce the already very low HCl emitted flow by 0.9
% but would require over 1,000 times more reagent in mass
Source: Original graph by L. Kosior, SITA
Plants are approaching the limit of the emission abatement capabilities and of the measurement systems. Emissions are so low that they are around the detection and quantification limits of even the most sophisticated measurement equipment. With emissions so low (e.g. 1), the instrument can validate compliance with reasonable Emission Limit Values (e.g. 10), but if such limits were brought to the current levels of emission (in this case, e.g. 2 or 3), uncertainty would be too great to ascertain com- pliance with the new, very low limits, in accordance to CEN measurement standards.
Still, technology suppliers keep on seeking improvements to minimise environmental impacts.
Plants built today reach low long-term emission levels more efficiently in terms of reagents and energy: less residues are produced and operation is cheaper. But the heterogeneous nature of waste still implies that some emission peaks will occur, jus- tifying, inter alia, the need to keep a margin between typical operation and Emission Limit Values.
6. What are the challenges for the WI BREF revision?
The IED recognises the need to reset the BREFs, the BAT Conclusions and the BATAELs to adapt to the new approach of the IED. The BREFs upon which the legally- binding ELVs will now be based must all be revised. The TWG (Technical Working
45 40 35 30 25
15
5
Dry FGC process HCI 1/2-hr average over 1 year - data arranged by value mg/Nm3
0 20
10 50
2,000 3,000 4,000
0 1,000 5,000 6,000 7,000 8,000 9,000
(yearly average: 2.7 mg/Nm3) 0.9 % (Benefit)
>
1,000 % (cost) HCI outliers mass flow
between 10 and 50 mg/Nm3
= 0.9 % of the total HCI emissions
Policies/Str
Group) for waste incineration was reactivated in May 2014 with the update of its members consisting of technical specialists from the Industry, NGOs and Member States. The initial positions were shared in autumn 2014 and the Kick-off Meeting took place in January 2015. ESWET is a member of this TWG and collaborates with other stakeholders in various TWG sub-working groups and informal shadow groups.
According to the IED’s Annex VI, Part 3, point 1.2, compliance with ½-hourly Emissi- on Limit Values for waste incineration can be assessed in two ways: either 97 percent of the ½-hourly average values over the year do not exceed any of the ELVs set out in Column B of the table given under point 1.2, or none of the ½-hourly average values exceeds any of the ELVs set out in Column A of the same table.
Comparing incineration and Large Combustion Plants (LCPs), for instance, the so- called Column B conditions, which are applied in a few European Member States, are more stringent than the conditions applied for short-term ELVs for LCPs.
Indeed, LCPs can discard up to 5 percent of the measured values (instead of 3 percent for waste incineration plants) and the short-term ELVs are set at 200 percent of the daily average ELVs (instead of being equal to them in the case of waste incineration plants).
The so-called Column A conditions, which are applied in the majority of Member States, refer to higher ELVs than Column B, but conditions are much more demanding since none of the values can be discarded. As shown e.g. Figure 2, nearly all ½-hr average values achieved by waste incineration plants are noticeably low and only a few are higher.
It is important to note that two different sets of BATAELs will be needed in the revised WI BREF to match conditions of Column A and conditions of Column B of the IED, while there is only one set of ½-hourly average BATAELs in the current WI BREF.
This is an example of the impact of the new meaning of BATAELs introduced in the IED: according to previous legislation (IPPC Directive), BATAELs were typical average values achieved when implementing the Best Available Techniques whereas, according to the IED, they are capping values to be used when setting up the ELVs in the permits.
The standard IED requirement for all industries is that compliance with ELVs is re- quested only in Normal Operating Conditions (NOC). However as already mentioned, for waste incineration, the IED sets up much stricter requirements: compliance with ELVs is demanded in Effective Operating Time (EOT), which includes also most OTNOCs (Other Than Normal Operating Conditions), such as start-up and shut- down periods when waste is combusted and some breakdown situations.
Despite the fact that waste incineration plants are designed and operated so as to comply with the ELVs during the 8,760 hours in a year, a few exceedances of the short-term average values are accepted by the IED, reflecting the reality of industrial processes. Waste incineration plants are only granted up to 4 uninterrupted hours of exceedance and a total of 60 hours per year. As a comparison, for LCPs the allowance is 24 uninterrupted hours and 120 hours per year.
Policies/Str
7. First conclusion: specific BATAELs derivation method is needed
In the light of the above considerations, a specific method to derive BATAELs from operational data is needed for waste incineration plants since the ones used for other sectors are not replicable. For example in the data collection developed for the review of the LCP BREF, high values, such as outliers, were discarded. For waste incineration plants this would imply a mistake, because for daily ELVs and, as stated before, in conditions of Column A, compliance must be continuously assessed at these facilities.
Why must we refer to the raw data of numerous and identified plants? As outlined, the EU sets strict requirements on waste incineration. However, it leaves leeway for com- petent permitting authorities (Member States and sometimes local authorities) when it comes to details. In addition to the already mentioned Column A and Column B conditions, the definitions of EOT, OTNOC and of the 60 hours allowance are not uniform within the EU and in some cases there is no definition at all.
In the same way, practices in respect of the treatment of data (instrument calibration, value taken when above the range of the instrument or below the detection limit, con- fidence interval, etc.) can vary significantly between Member States.
Representativeness of the data
As explained above, under the IED the BATAELs are now ceiling values for the ELVs to be set up in the permits. For this reason, maximum values which were obtained by the well-performing techniques candidate to the BAT status (and not the minimum or average values) are needed.
Two questions then arise:
Which maximum value is to be considered? The maximum maximorum or the 2nd maximum, the 10th...?
How to be sure that the maximum chosen among the data of a single reference year is representative of the maxima observed on the same plant over many years?
8. Second conclusion: data-driven BATAELs derivation
Due to the compliance assessment rules being different for the various plants, it would be difficult to choose in advance a handful of supposedly well-performing plants.
In order to receive operational data that can be analysed and used in a standardised manner by the members of the TWG they have to be delivered as raw data, with only primary corrections made. And all the average values of the reference year must be provided (i.e. for each continuously monitored substance, 17,520 ½- hourly and 365 daily average values), since only 1 year is used for a BREF.
Therefore the representativeness of the results can be achieved by maximising the sample of the collection, i.e. the number of plants participating.
Policies/Str
To ensure their representativeness, data for substances subject to periodic measure- ments must be collected over a period of at least 5 years. And in order to give the opportunity to the TWG to crosscheck the data, neither anonymous nor aggregated data can be accepted.
9. A race to the bottom?
It is tempting to say that the best plant is the one with the lowest emissions and declare these emissions to be the benchmark.
However the need to account for other environmental criteria associated with specific emissions performance – an integrated approach – is a cornerstone of the IED which defines best as the most effective in achieving a high general level of protection of the environment as a whole.
It has to be considered that lowering air emissions usually has a negative influence on some of the other integrated approach criteria (Annex III of IED). Some impacts are:
potential increase in the emission of other substances, increased resources consump- tion, higher production of residues, production of liquid effluent, etc. The question of costs must not be overlooked either.
Since the impact of the emissions of waste incineration plants is negligible, what is the benefit to spend resources and money to reduce the emissions a little more, when this money could be spent elsewhere to significantly improve the environment as a whole?
Therefore, is a well-performing plant one with minimised emissions to air, or one with overall optimisation of integrated criteria, e.g. minimised consumption of scarce re- sources such as water? An integrated approach allows local conditions to be considered:
jurisdictions with abundant water may call for plants with high water consumption because they show excellent emission results, while others may choose one with little water consumption and zero water discharge.
10. Deriving Air BATAELS from plants implementing BATs: our proposal
Based on the information given above, air BATAELs can be derived according to the following method.
10.1. Among the sets of data provided by the plant operators, identify the lines with a well-performing flue gas cleaning system
Well-performing waste incineration Flue Gas Cleaning systems are implementing BATs and have not exceeded, during the reference year, the ½-hourly Column A ELVs in EOT for more than 60 hours for all continuously monitored pollutants as provided for in the IED.
Policies/Str
10.2. Choosing the 95
thpercentile to remove potential bias
For both the lower and the higher ends of the candidate BATAEL, it is important not to get a bias from a few well-performing lines with abnormal values. Among all the candidate values stemming from all the well-performing lines, the 95th percentile of each line’s 17th and 3rd maximum values should become the lower and upper ends of the BATAEL range (Figure 4).
95th percentile BATAEL
candidate values (1 per ‘well performing‘ line)
Figure 4:
Theoretical distribution of the BATAEL candidate values provided by each well-performing line for each continuously monitored substance and corresponding to each ELV requested by the IED.
As commonly accepted in statistics, the retained BATAEL value should be the 95th percentile of all the candidate values.
10.3. Setting up the ½-hour average Column B and daily average BATAELs
The proposal for ½-hour average Column B and daily average BATAELs is also to take the 95th percentile of the candidate values of all well-performing lines corresponding to Column B conditions (i.e. the maximum value remaining after having discarded 3 percent of the data) (Figure 5).
And for the daily average BATAELs, the proposal is to also take the 95th percentile of all the maximum daily averages of the well-performing lines.
10.4. Setting up the ½-hour average Column A BATAELs
The 60 hours counter from the IED is the tool to set up the ½-hourly average Column A BATAELs. The principle is to gather a set of operational values for each waste incine- ration line that provided data and was recognised as well-performing. Then, lower and higher ends of a BATAEL correspond to the maximum recorded emission value from a BAT plant, with (lower end), and without (higher end), using the 60 hours counter.
10.4.1. The lower end of the ½-hr average Column A BATAELs range
The IED requires 7 substances to be continuously monitored in waste incineration plants. Assuming that the 60 hours are equally shared between them, each of the 7 substances’ ELV can be exceeded a bit more than 8 hours per year (7 x 8 = 56). The 17th maximum value (16 x ½-hours + 1) of each substance is then the lower end of that substance’s BATAEL for that plant. This is the strictest level where an ELV can be set for the considered well-performing line on the basis of the values it reported while expecting compliance with ELV through use of the 60 hours allowance (Figure 5).
Policies/Str
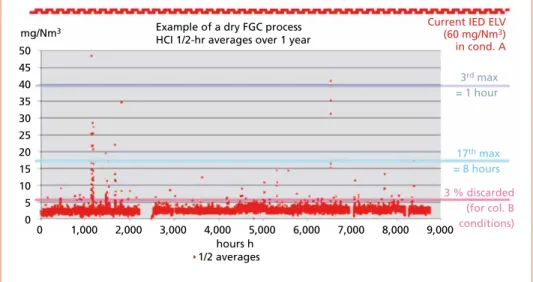
10.4.2. The upper end of the ½-hr average Column A BATAELs range In principle, for each substance, the upper end of the candidate BATAEL value of each well-performing line should be the maximum ½-hour average of the year. However, in order not to get a bias from a few possibly abnormal values, the 2 first maxima of the year should be discarded and only the 3rd maximum should be taken into account (Figure 5).
Figure 5: Set of data showing the ½-hourly averages of HCl for an individual line over one year.
For this line, the candidate BATAEL values are respectively 40 mg/Nm3 and 17 mg/Nm3 (upper and lower ends of the range in Column A conditions, 1 hour and 17 hours of exceedance in dark and pale blue) and 6 mg/Nm3 (in Column B conditions, 3 % of the data being discarded in pink). Note that all these values are below the current ELVs given in the IED which are set up at 60 mg/Nm3 in column A and 10 mg/Nm3 in column B.
11. Derivation method in summary 11.1. For each of these lines, identify the candidate values
For each continuously-monitored substance, gather:
• the maximum daily average value over the year.
• the 3rd and the 17th maximum ½-hourly average values of the year;
• the 97th percentile ½-hourly average value of the year;
For each periodically-monitored substance, the maximum value over 5 years.
Example of a dry FGC process HCI 1/2-hr averages over 1 year mg/Nm3
50 45 40 35 30 25 20 15 10 5 0
Current IED ELV (60 mg/Nm3) in cond. A
3rd max
= 1 hour
1/2 averages
17th max
= 8 hours 3 % discarded
(for col. B conditions) hours h
0 1,000 2,000 3,000 4,000 5,000 6,000 7,000 8,000 9,000
Policies/Str
11.2. Derive BATAELs
For each continuously-monitored substance, set the BATAEL values for:
• Daily BATAEL: at the 95th percentile of all the candidates (the maximum daily values of the well-performing lines).
• ½-hourly average BATAELs range for Column A ELV (100 percent of values): at the 95th percentile of the candidate values (all 3rd and 17th maximum ½-hourly values of well-performing lines),
• ½-hourly average BATAELs for Column B ELV (97 percent of values): at the 95th per- centile of all the candidate values (all 97 percent ½-hourly values of well-performing lines);
For each periodically-monitored substance: at the 95th percentile of all maximum values of the well-performing lines.
12. Testing the method
In order to test this method, a collaboration between various organisations under the leadership of CEWEP (Confederation of European Waste-to-Energy Plants, operators) and ESWET (European Suppliers of Waste to Energy Technology, suppliers) enabled the gathering of operational data from 32 waste incineration lines of various capacities and Flue Gas Cleaning types in six European countries.
The result is that the daily BATAELs are mostly in line with the current Emission Limit Values. Derived ½-hourly BATAELs, calculated based on Column B (97 percent) would in general be slightly below the current ELVs. And the data shows that the ½-hourly BATAELs based on Column A (100 percent) would in general be at the current ELVs.
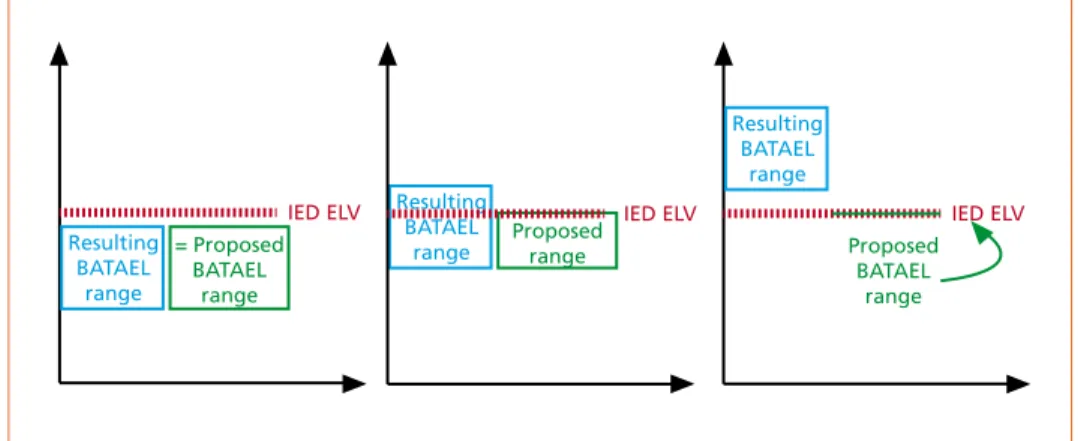
(See the 3 typical cases on Figure 6)
Proposed range Resulting
BATAEL range IED ELV
Resulting BATAEL
range
= Proposed BATAEL
range
IED ELV IED ELV
Resulting BATAEL
range
Proposed BATAEL
range
Figure 6: The BATAEL range resulting from the assessment method can be either below, over- lapping or above the IED ELV. In the 1st case, the proposed BATAEL is the same as the resulting one; in the 2nd case, the proposed BATAEL is limited on top to the IED ELV;
in the 3rd case, the proposed BATAEL is the IED ELV.
Policies/Str
13. Conclusion
When the facts change, I change my conclusions! This famous quote is well-suited to the IED and the need to update the BAT Conclusions and their BATAELs. What previ- ously (under IPPC) was an indicative figure based on aggregated averages will now be a capping limit value, since the IED states that the ELVs to set up in the permits must not exceed the future BATAELs.
In normal operation a waste incineration plant records very low emissions for most of the time intervals, but some recorded values are higher (peaks) because of the changing pollutant load in the incoming waste or for operational reasons.
The method presented here aims at deriving BATAELs which actually reflect the fluc- tuating emission levels recorded when incinerating waste in a well-performing plant in the Effective Operating Time (Normal Operating Conditions plus most Other Than Normal Operating Conditions) when ELVs must be complied with.
The 1st step is to clearly define this Effective Operating Time. The 2nd one is to collect a statistically significant amount of operational data covering various local conditions on this full period of time.
The 3rd step is to apply a non-biased statistical calculation to obtain BATAEL values actually corresponding to the performances of the well-performing plants and achievable in the reality of industrial processes.
It should not be a surprise that the updated BATAEL values will be higher than the current ones – based on the former IPPC Directive – which were typical average ranges of recorded emission levels. It is not that waste incineration is back- tracking on environmental protection, but simply that the meaning of the values has changed.
Nevertheless, the new BATAELs will remain below or equal to the IED ELVs and the actual emissions from the waste incineration plants will remain at scrupulously low levels.
14. Glossary and References
BAT: Best Available Technique
BATAEL: Best Available Techniques Associated Emission Level BREF: BAT Reference Document
EIPPCB: European IPPC Bureau (in Seville) ELV: Emission Limit Value
EOT: Effective Operating Time EU: European Union
IED: Industrial Emissions Directive (2010/75/EU)
Policies/Str IPPC: Integrated Pollution Prevention and Control Directive (96/61/EC, re-codified in 2008)
LCP: Large Combustion Plants NOC: Normal Operating Conditions
OTNOC: Other Than Normal Operating Conditions TWG: Technical Working Group (set up by the EIPPCB) WI BREF: Waste Incineration BREF
WID: Waste Incineration Directive (2000/76/EC)
Bibliografische Information der Deutschen Nationalbibliothek Die Deutsche Nationalbibliothek verzeichnet diese Publikation in der Deutschen Nationalbibliografie; detaillierte bibliografische Daten sind im Internet über http://dnb.dnb.de abrufbar
Thomé-Kozmiensky, K. J.; Thiel, S. (Eds.): Waste Management, Volume 5 – Waste-to-Energy –
ISBN 978-3-944310-22-0 TK Verlag Karl Thomé-Kozmiensky
Copyright: Professor Dr.-Ing. habil. Dr. h. c. Karl J. Thomé-Kozmiensky All rights reserved
Publisher: TK Verlag Karl Thomé-Kozmiensky • Neuruppin 2015
Editorial office: Professor Dr.-Ing. habil. Dr. h. c. Karl J. Thomé-Kozmiensky, Dr.-Ing. Stephanie Thiel, M. Sc. Elisabeth Thomé-Kozmiensky.
Layout: Sandra Peters, Ginette Teske, Janin Burbott-Seidel, Claudia Naumann-Deppe Printing: Universal Medien GmbH, Munich
This work is protected by copyright. The rights founded by this, particularly those of translation, reprinting, lecturing, extraction of illustrations and tables, broadcasting, micro- filming or reproduction by other means and storing in a retrieval system, remain reserved, even for exploitation only of excerpts. Reproduction of this work or of part of this work, also in individual cases, is only permissible within the limits of the legal provisions of the copyright law of the Federal Republic of Germany from 9 September 1965 in the currently valid revision. There is a fundamental duty to pay for this. Infringements are subject to the penal provisions of the copyright law.
The repeating of commonly used names, trade names, goods descriptions etc. in this work does not permit, even without specific mention, the assumption that such names are to be considered free under the terms of the law concerning goods descriptions and trade mark protection and can thus be used by anyone.
Should reference be made in this work, directly or indirectly, to laws, regulations or guide- lines, e.g. DIN, VDI, VDE, VGB, or these are quoted from, then the publisher cannot ac- cept any guarantee for correctness, completeness or currency. It is recommended to refer to the complete regulations or guidelines in their currently valid versions if required for ones own work.