osion
Operation and Use of Sulphur Burner
Sascha Krüger, Rupert Warlo and Jörg Krüger
1. Occurrence of corrosion ...587
1.1. High temperature chlorine corrosion on superheaters ...589
1.2. Molten salts ...590
2. Sulphur as counter measure to chloride induced corrosion...591
2.1. Former investigations ...591
2.2. Own accidental findings ...594
2.3. Sulphation of deposits ...595
2.4. Influence of sulphur injection on deposits ...596
3. Field application of sulphur injection ...596
3.1. Manual testing ...596
3.2. Automated injection system ...597
4. Summary ...599
5. Literature ...600 The corrosive character of deposits in WtE, RDF and biomass boilers is widely known and investigated. Keywords like molten salt corrosion, chlorine induced corrosion as well as dry deposit attack are found in literature and publications. The fact that con- densing and de-sublimating salts cause corrosion and hard deposits is well known to the boiler operators. In this paper, a brief overview shall be given concerning chlorine induced corrosion mechanism. Furthermore, sulphation is described – a mechanism to minimize the corrosive character of deposits. Sulphation is caused by SO3 which is fed to the boiler by injection of elementary sulphur. Moreover, several field applications of the sulphur injection techniques – the sulphur burner – and operational experiences are described. Besides decreasing corrosion rates, the hardness of the deposits could also be decreased, which makes it easier to remove the deposits from heat exchanger surfaces.
1. Occurrence of corrosion
Corrosion effects on refuse fired boilers have already been investigated for a long time.
In many cases, chlorine was found to be one of the major players in the role of corro- sion. It would be too simple to just correlate the corrosion rate to chlorine content in the fuel. Alkali metals and heavy metals contribute to corrosion as well as molten salts.
Various corrosion mechanisms can be triggered. A brief overview is given here [10].
osion
Gaseous corrosion
HCl content in the raw gas varies typically in the range of 1,000 mg/Nm³ or higher. In RDF concentration, it can be much higher. From the investigation described in [1], HCl from raw gas doesn’t contribute to metal chlorination as the above stated content is by far too low to be a major refuse or RDF incinerators. A further reason why HCl is not directly acting from the gas phase is that no condensing conditions are reached.
Mechanisms known from wet chemistry are likely not to be valid for high temperature gas atmosphere. A further compound which is likely to trigger gaseous corrosion would be H2S, triggering sulphide corrosion. This mostly occurs in reducing atmospheres, which is accompanied by higher CO concentration. Therefore, H2S corrosion is widely described as CO corrosion.
Deposit-induced corrosion
The deposit on the boiler tubes consists of ash and salts [11]. The deposition of the salts can occur on ash particles and on other surfaces by vapour condensation, physical desorption or the impact of condensed salts. Depending on the salt composition and the amount of inert ash the melting point of the is influenced and this has an impact on the hardness of the depositions. Corrosion triggered by the deposit can occur un- der dry conditions (see section 1.1 where this topic is specifically discussed) or due to molten salts. The corrosiveness of the salt derives from the characteristic feature that a molten salt contains a high concentration of charge carriers [6]. Molten salts as electrolytes on a metallic surface can be seen as half cells, triggering electrochemical processes. The driving force for electron transfer are concentration gradients of salt and also temperature differences. With increasing heat flux temperature, gradients also increase and thus corrosion effects are also increasing. The correlation between heat flux and corrosion is described in [8]
In [10], melting temperatures of various salts are summarized. The specific melting point is seen as an important factor concerning corrosion – in short: the lower the melting point, the higher the corrosion. It is further stated that the chloride containing compounds are more aggressive in terms of molten salt than sulphate salts. In [2], it is shown that electrochemical corrosion from both, sulphates and chlorine, can occur.
In [17], it is stated that sulphate induced corrosion is more likely at higher material temperatures than corrosion by chloride salts.
In which manner the playing field of corrosion including chlorine, sulphur, oxides metals, temperatures, residence times, type of combustion system, velocity, and turbu- lence of flue gas occurs is quite complex and not jet finally explained and describable.
Mechanically-assisted corrosion
Effects like abrasion and erosion surely assist resp. accelerate corrosion [10]. When inspecting boilers, which were taken out of operation for maintenance, it can be seen that not many parts in the boiler are free from deposits by pure flue gas velocity.
osion
Mechanically-assisted corrosion would be most likely to be found in areas where non-suitable online cleaning measures are in operation. These can in be online water cleaning devices in the radiation passes or soot blowers in the convective part of the boiler. Damaging the stable oxide layers and exposing fresh metal surface to the raw gas would result in high losses of material thickness.
1.1. High temperature chlorine corrosion on superheaters
As described before, a special type of corrosion mechanism will be explained in further details although studied in several objects in the past, e.g. in [2], [3], [4], [9], [16], [17].
deposit: ash and salts e.g. from Zn, Pb, Na, K as oxides and carbonates, chlorides and sulphates deposit: ash and salts e.g. from Zn, Pb, Na, K as oxides and carbonates, chlorides and sulphates
scale
scale e.g. Fee.g. Fe22OO33 + Fe + Fe33OO44 e.g. FeCl2 e.g. FeCl2 tube (Fe)
e.g. 600 slightly below flue gas temp interface layer scale-deposit interface layer tube-scale e.g. 400 ϑ
°C
e.g. 6 % O2, 18 % H2O flue gas conditions
c c
O2 H2O
increasing
extremly low 0 x mm
The scheme from Figure 1 shows temperature and gradient of gaseous species in the scale and deposit on a super heater tube.
It is important to mention that the O2 and H2O concentration is low (basically zero close to the scaling on the tube and increasing until reaching flue gas conditions.
Figure 1:
Temperature, oxygen and mois- ture gradient in scale and deposit (qualitative presentation, values are not true to scale)
osion
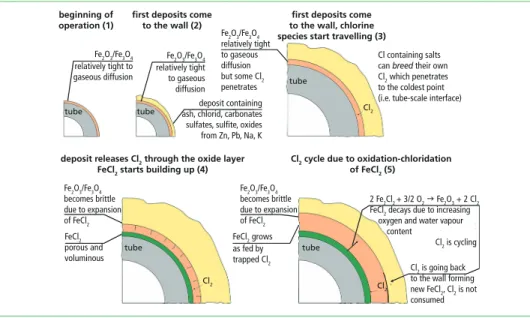
Figure 2: Chlorine cycle in the interface layers between tube scale and deposits (not true to scale) As described before, chlorine can be cycled in the described mechanism. The original source of chlorine is the high partial pressure of chloride salts [10]. In the salt, decom- position occurs and Cl2 is formed due to high temperatures. A substantial amount of chlorine is formed when the partial pressure of the salt reaches more than 1 • 104 atmospheres. It is important to mention that the oxygen and vapour content strongly differ in the scaling and the deposition (Figure 1). The deposit is much less tight to diffusion compared to the scale.
1.2. Molten salts
beginning of operation (1)
first deposits come to the wall (2)
first deposits come to the wall, chlorine species start travelling (3) Fe2O3/Fe3O4
relatively tight to gaseous diffusion Fe2O3/Fe3O4
relatively tight to gaseous diffusion
Fe2O3/Fe3O4
relatively tight to gaseous diffusion Fe2O3/Fe3O4
relatively tight to gaseous diffusion
Fe2O3/Fe3O4
relatively tight to gaseous diffusion but some Cl2
penetrates Fe2O3/Fe3O4
relatively tight to gaseous diffusion but some Cl2
penetrates tube
tube
tube Cl2
Cl containing salts can breed their own Cl2 which penetrates to the coldest point (i.e. tube-scale interface)
tube tube
Cl2 deposit containing
ash, chlorid, carbonates sulfates, sulfite, oxides from Zn, Pb, Na, K deposit containing ash, chlorid, carbonates sulfates, sulfite, oxides from Zn, Pb, Na, K
Cl2 Fe2O3/Fe3O4
becomes brittle due to expansion of FeCl2
Fe2O3/Fe3O4
becomes brittle due to expansion of FeCl2
FeCl2 porous and voluminous FeCl2 porous and voluminous
deposit releases Cl2 through the oxide layer FeCl2 starts building up (4)
Fe2O3/Fe3O4
becomes brittle due to expansion of FeCl2
Fe2O3/Fe3O4
becomes brittle due to expansion of FeCl2
FeCl2 grows as fed by trapped Cl2
FeCl2 grows as fed by trapped Cl2
Cl2 cycle due to oxidation-chloridation of FeCl2 (5)
2 Fe2Cl2 + 3/2 O2 Fe2O3 + 2 Cl2
FeCl2 decays due to increasing oxygen and water vapour content
Cl2 is cycling 2 Fe2Cl2 + 3/2 O2 Fe2O3 + 2 Cl2
FeCl2 decays due to increasing oxygen and water vapour content
Cl2 is cycling Cl2 is going back to the wall forming new FeCl2, Cl2 is not consumed
800
700 600 500
400 410 2 ZnNaCl2• NaCl
Na2SO4• 2 ZnSO4 262 300 322
600 400
700 800
300
305° 415°
330°
314°
410° 398°
480°
312°
400
500
600
700 300
436
(730) 628
884 Na2SO4
minimaler Schmelzpunkt 2 ZnNaCl2• NaCl = 262 °C minimaler Schmelzpunkt Na2SO4 • 2 ZnSO4 = 472 °C ZnSO4 ZnCl2 Na2Cl2
548 478 472 Mol %
542
In [2], [9], [10] and [18], the molten salt attack is described. It is generally stated that sulphate containing salts have higher melting points than the corresponding chloridic salts (Figure 3, the same range of different melting temperatures can be found for lead salts).
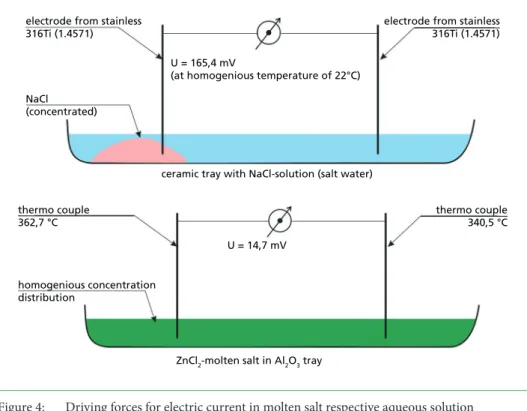
The example of Figure 4 shows that either the temperature or the concentration dif- ference can cause electric current. Both, temperature and concentration can be recognised as non-homogeneous when deposits occur on the tube. The finding in [13] states that higher corrosion rates occur together with higher heat fluxes.
Figure 3: Melting temperatures of sodium zinc chloride and sodium zinc sulphate
Source: Evseeva, N. N., Bergman, A. G. 1952
osion
This finding can be explained when assuming that temperatures gradients in the deposit are increasing by increasing heat flux.
electrode from stainless 316Ti (1.4571)
U = 165,4 mV
(at homogenious temperature of 22°C)
ceramic tray with NaCl-solution (salt water)
electrode from stainless 316Ti (1.4571)
NaCl (concentrated)
thermo couple 362,7 °C
thermo couple 340,5 °C
homogenious concentration distribution
ZnCl2-molten salt in Al2O3 tray U = 14,7 mV
Figure 4: Driving forces for electric current in molten salt respective aqueous solution
2. Sulphur as counter measure to chloride induced corrosion
2.1. Former investigations
As described above, it is recognised that sulphatic deposits are less aggressive in terms of corrosion compared to chloridic deposits. In an early research [9], it was discovered that adding high sulphur containing coals to waste incineration drastically reduces corrosion. The drawing from Figure 5 shows initial corrosion rates discovered during tests performed with different mixtures of waste and coal. Depending on the material temperature, initial rates between 0.15 and 0.2 mm/h can be lowered by the order of one magnitude. The high initial corrosion rate is not only of important concern for new boiler parts being in contact with combustion atmospheres. Moreover, the fresh metal surface can result from online cleaning as mentioned above. If wet online cleaning is performed in a way that the stable oxide layer is removed e.g. by a strong water jet, the high initial corrosion rate would occur by usage of online cleaning. In this case, the usage of the wet cleaning system must be optimised. As a second measure, the use of sulphur in the combustion is beneficial to avoid high corrosion rate.
osion
It is very important to mention that the sulphur can only act in a positive way when occurring as sulphate. When injected in reducing atmospheres, sulphur can occur as sulphide which can trigger corrosion (Figure 6).
Seeing a benefit in terms of minimizing corrosion, a lower SO2/HCl ratio in the raw gas was suggested in [10] (Figure 7).
0.20 corrision rate mm/h
0.15
0.10
0.05
0.000 100 100 % waste
8 % replacement by coal with 3 % S 22 % replacement by coal with 3 % S 74 % replacement by coal with 3 % S
200 300 400 500 600 700 800 950 F 750 F 550 F
900 950 F 510 °C 750 F 399 °C 550 F 288 °C
1,000 - high corrosion on metal-scale contact layer mostly driven by corrosion - with time corrosion rate is reduced - adding sulphur avoids high initial corrosion rate
- important for online cleaning:
stalbe corrosion layer can be destroyed resp. removed and high initial corrosion rate starts again
metal temperature
Figure 5:
Corrosion rates with and with- out sulphur feeding to com- bustion
Source: Krause, H. H.; Vaughan, D.
A.; Boyd, W. K.: Journal of Engineering for Power (now: Journal of Engineering for Gas Turbines and Power, hosted by ASME), 1997, Vol. 3, 448-452 and 1998, Vol. 3, 369-374 and 1999, Vol. 3, 449-459, articles originally from 1975, 1976, 1977
A further interesting finding was discovered and described in [12]. A pyrite injection was performed in a WtE boiler and showed a difference on corrosion probes (Figure 8, test with corrosion monitor). Despite the effect from Figure 7 where an increasing SO2/ HCl ratio positively influences the corrosion, SO3 is seen to trigger a sulphation reaction.
Combined with increasing SO2 content in the raw gas, SO3 would also increase. I.e. the results from [12] and [10] basically do not contradict themselves.
osion initial corrosion rate
(first hours of operation) mm/h
0 400
200 300
temperature °C temperature °F possible sulfidic (S2-)
corrosion
400 500
500 600 700 800 900 1,000
0.01 0.02 0.03 0.1 0.3 0.2
coal with 1 % S coal with 3 % S coal with 5 % S
coal with 3 % S and 28 % refuse coal with 5 % S and 27 % refuse coal with 3 % S and 42 % refuse 100 % refuse
R
Figure 7:
SO2/HCl ratio recommendation to minimize corrosion rate
Sorell, G.: The role of chlorine in high temperature corrosion in waste-to-energy plants. In: Materials at High Temperatu- res Volume 14, 1997 – Issue 3: Corrosion in Advanced Power Plants. Proceedings of the Second International Workshop on Corrosion in Advanced Power Plants, Tampa, Florida, 3–5 March 1997 00
0.2 0.4 0.6 0.8 1.0 1.2
corrosion rate (related to raw gas from waste as delivered)
1.0
316 S.S.
2.0 SO2/HCl ratio
371 °C metal temperature
waste as deliveredSO2/HCl ratio = 0,3 593 °C
3.0 4.0 5.0
316 S.S.
Figure 6:
Initial corrosion rates with and without sulphur feeding to com- bustion
Source: Krause, H. H.; Vaughan, D.
A.; Boyd, W. K.: Journal of Engineering for Power (now: Journal of Engineering for Gas Turbines and Power, hosted by ASME), 1997, Vol. 3, 448-452 and 1998, Vol. 3, 369-374 and 1999, Vol. 3, 449-459, articles originally from 1975, 1976, 1977
osion
2.2. Own accidental findings
From investigations carried out in the WtE plant of Schwandorf, Bavaria (commissioned in 1882), interesting results can be reported. Before revamping activities in 1992 took place, the boilers of the plant were equipped with heavy fuel oil burners. The heavy fuel oil contained approx. 1.5 to 2 % wt.-% of sulphur. HCl concentrations occurred in the raw gas during boiler start-up without waste combustion. The chloride content of heavy oil was checked and was too low to be the cause of HCl emissions. After the conversion of start-up burners to light heating oil, the corrosion rates in the membrane walls sharply increased.
At that time, the operator was not aware of the sulphation (re-salting of chloride salts to sulphate salts). The increasing corrosion was explained as a result of a change in the waste composition. During boiler start-up, 3.5 to 4 t/h heavy fuel oil was used. The sulphur mass flow was thus in the range of app. 60 kg/h.
Further findings occurred accidentally. Performance tests of a new semi-dry flue gas cleaning system were carried out in 1993. To create a high amount of SO2, sulphur
without pyrite injection
with pyrite injection (4 times thick corrosion products)
with pyrite injection lower chloride content without pyrite injection additive test:
operation with and without pyrite injection in a WtE boiler
investigation and evaluation procedure: corrosion monitoring, fin of membrane wall, first radiation pass, above refractory lining
Figure 8:
Corrosion layer on corrosion monitor with and without pyrite injection
Source: Spiegel, W.: Einsatz von Addi- tiven zur Begrenzung der Hochtempe- ratur-Chlorkorrosion als Option neben anderen Korrosionsschutzmaßnahmen.
In: Manfred Born (Hrsg.): Dampferzeu- gerkorrosion. Freiberg i.S.: SAXONIA, S.
osion
powder was injected to the combustion chamber by pneumatic transport. The SO2 in- crease was clearly below the stoichiometrically determined values. The sulphur seemed to vanish from the SO2 measurement which can only take place when the sulphur reacts to SO3 or H2S. As injection took place in oxidising conditions with a high air excess from carrier air, the formation of H2S could be excluded. SO3 would be the only meaningful species to form under these conditions. The same amount of sulphur was added to the waste and burned in the reducing atmosphere on the grate. The increase of SO2 was in the expected range.
The conclusion at this time was that it depends on the condition of dosing sulphur to the boiler. In the case that SO3 is produced from elementary sulphur, it needs to be injected into an oxygen rich environment.
2.3. Sulphation of deposits
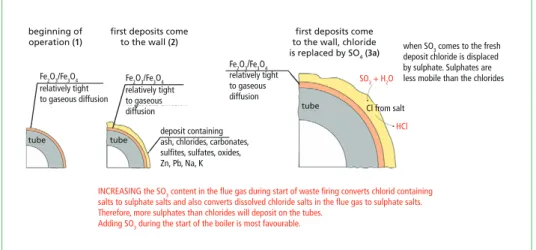
Comparing the results from the above cited researchers and our own findings, many conclusions are congruent. The main difference occurs when taking a closer look on the timing of dosing SO3 to the boiler. From cited research, it is beneficial to have a continuous dosing of sulphur – to form SO3 rather than SO2 – in the boiler to force sulphation of salts before depositing on the walls. From our own findings and inves- tigation, it is sufficient to feed SO3 during the start-up period and after wet online cleaning of boiler. By this means the deposits close to the surface of the tube contain less chlorides. According to Figure 2, chlorine causes the above stated chlorine cycle (Figure 2). Less chlorine in the layer would cause a weaker pronounced chlorine at- tack. The scheme from Figure 9 shows a mechanism where chlorine is removed from the deposit by SO3. This mechanism can only take place in an atmosphere containing small amounts of vapour. In this case, the deposits do not contain diffusion tight layers (compare Figure 1) and moisture is apparent.
beginning of
operation (1) first deposits come
to the wall (2) first deposits come
to the wall, chloride
is replaced by SO4 (3a) when SO3 comes to the fresh deposit chloride is displaced by sulphate. Sulphates are less mobile than the chlorides Fe2O3/Fe3O4
relatively tight to gaseous diffusion Fe2O3/Fe3O4
relatively tight to gaseous diffusion
tube
Fe2O3/Fe3O4 relatively tight to gaseous diffusion Fe2O3/Fe3O4 relatively tight to gaseous diffusion
tube deposit containing ash, chlorides, carbonates, sulfites, sulfates, oxides, Zn, Pb, Na, K deposit containing ash, chlorides, carbonates, sulfites, sulfates, oxides, Zn, Pb, Na, K
Fe2O3/Fe3O4 relatively tight to gaseous diffusion Fe2O3/Fe3O4 relatively tight to gaseous diffusion
tube Cl from salt
SO3 + H2O
HCl
INCREASING the SO3 content in the flue gas during start of waste firing converts chlorid containing salts to sulphate salts and also converts dissolved chloride salts in the flue gas to sulphate salts.
Therefore, more sulphates than chlorides will deposit on the tubes.
Adding SO3 during the start of the boiler is most favourable.
Figure 9: Proposed mechanism of action of SO3 on a chlorine containing deposit
osion
2.4. Influence of sulphur injection on deposits
The influence of non-continuous SO3 injection on the character of the deposits is not yet fully investigated. Thick deposits normally have a high overall concentration of sulphates. Coming closer to the relatively cold surface of the tube the concentration of sulphate is lower, chlorine content is increasing. A finding from operational testing (see section 3.2.) describes that the deposits become softer and more brittle when operating the sulphur injection. One can i.e. imagine that continuous sintering of deposits is disturbed by a discontinuously dosing of SO3. This effect would require more detailed investigation to be fully described.
3. Field application of sulphur injection 3.1. Manual testing
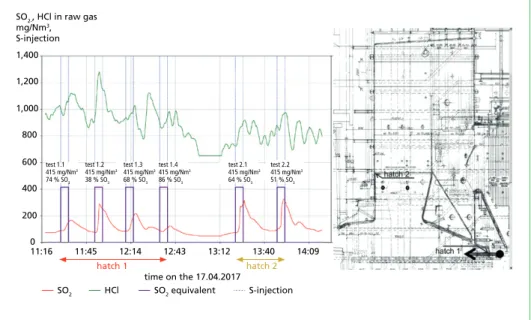
In the WtE plant of Schwandorf, manual tests were conducted where sulphur is injected by a pressurized air jet to the boiler. Two positions in the boiler were available (hatch 1, hatch 2, Figure 10). By measuring the amount of sulphur injected to the boiler and the measured SO2 increase in the raw gas, an evaluation of the conversion process can be conducted. It is assumed that the sulphur which does not react to SO2 is oxidised to SO3. With a good injection setup – which depends not only on the injection settings, but also strongly on the combustion settings – chlorine could be released using sulphation reac- tion. The boiler was in operation several weeks before the manual injection was started.
The chlorine release can be explained with the proposed mechanism from Figure 10.
0 200 400 600 800 1,000 1,200 1,400
SO2-, HCl in raw gas mg/Nm3, S-injection
11:16 11:45 12:14 12:43
time on the 17.04.2017 SO2
test 1.1 415 mg/Nm3 74 % SO3
test 1.2 415 mg/Nm3 38 % SO3
test 1.3 415 mg/Nm3 68 % SO3
test 1.4 415 mg/Nm3 86 % SO3
test 2.1 415 mg/Nm3 64 % SO3
test 2.2 415 mg/Nm3 51 % SO3
hatch 1 hatch 2
13:12 13:40 14:09
HCl SO2 equivalent S-injection
Figure 10: Sulphur injection, manual test, WtE Schwandorf
osion
3.2. Automated injection system
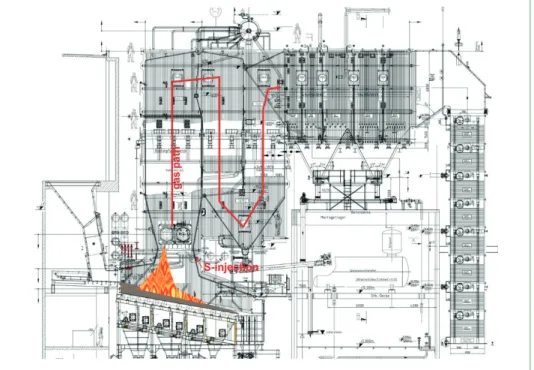
In the Klingele RDF boiler in Weener [14], a prototype of a full automated injection system was constructed and commissioned. The reason forthe installation of the sul- phur injector was strong corrosion. The sulphur injection is done – as proposed above – during the start-up of the boiler and also during resp. after online shower cleaning.
The injection is done through the secondary air nozzles on the rear wall (Figure 11). In [14], the operator reported several findings. E.g. that HCl in raw gas increase after first start of injection and also when the injection is re-started after a longer non-operational period. The increase of HCl basically occurs due to same sulphation mechanism as described before. From the latest reports of the operator, the corrosion became signif- icantly less. A further important finding is related to the characteristics of the deposits:
The condition of the deposits changed from hard sticky character to soft and easy to remove characteristic. The sulphur injection is in operation since 2015.
Figure 11: Sulphur injection, automated prototype, Klingele RDF Plant of Weener
Source: Tappe, T.: 15th VDI Conference, Firing and Boiler; June 2016
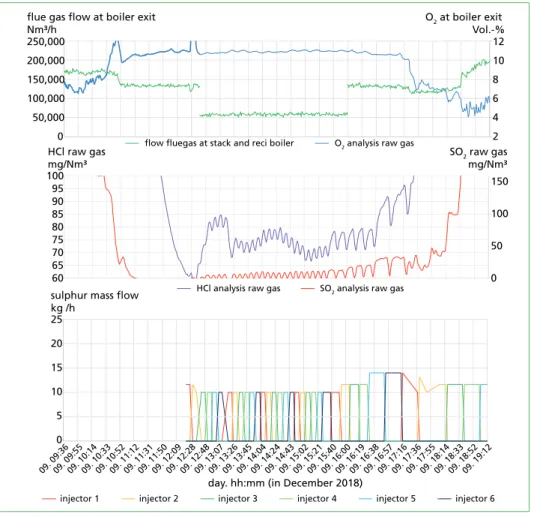
A further installation of a fully automated injection system (Figure 12 left) was done in an MVV’s WtE plant (Devonport). The injection is done – similar as the installation in Weener – through the rear wall secondary air nozzles (Figure 12 right). The injection of sulphur was done during operation with only auxiliary burners (Figure 13) in operation and with waste fired boiler in operation (Figure 14). During operations with oil fired burners, similar findings were achieved as were reported in the mid 80ies in the WtE facility of Schwandorf. HCl occurred during the injection of sulphur. Obviously, the release of HCl occurred from sulphation of remaining the deposits. Operating with a
osion
high oxygen content (app. 11% vol.-% wet at boiler exit) during oil firing, the yield from sulphur to SO3 is relatively high – between 89 and 95 % of the sulphur converts to SO3.
Figure 12: Sulphur injection (sulphur burner), automated injection, MVV Plymouth WtE Plant
!
"!
#!!
!
$!
%!
&!
'!
#!!
#$!
#%!
#&!
#'!
$!!
!()*!(+,& !()*!(+"" !()*#!+#% !()*#!+,, !()*#!+"$ !()*##+#$ !()*##+,# !()*##+"! !()*#$+!( !()*#$+$' !()*#$+%' !()*#,+!- !()*#,+$& !()*#,+%" !()*#%+!% !()*#%+$% !()*#%+%, !()*#"+!$ !()*#"+$# !()*#"+%! !()*#&+!! !()*#&+#( !()*#&+,' !()*#&+"- !()*#-+#& !()*#-+,& !()*#-+"" !()*#'+#% !()*#'+,, !()*#'+"$ !()*#(+#$ ./$*012345673897:;
<=>**012345673897:;
!"#$%&'()*%+,('-*%./%012*/3*4%5678
<=>*?7*012345 ./$*?7*012345
!
"
#!
#"
$!
$"
,!
,"
%!
!()*!(+,& !()*!(+"" !()*#!+#% !()*#!+,, !()*#!+"$ !()*##+#$ !()*##+,# !()*##+"! !()*#$+!( !()*#$+$' !()*#$+%' !()*#,+!- !()*#,+$& !()*#,+%" !()*#%+!% !()*#%+$% !()*#%+%, !()*#"+!$ !()*#"+$# !()*#"+%! !()*#&+!! !()*#&+#( !()*#&+,' !()*#&+"- !()*#-+#& !()*#-+,& !()*#-+"" !()*#'+#% !()*#'+,, !()*#'+"$ !()*#(+#$
.@2ABCB>7455BD5EF17*6G3*82;
H43*?7*IBJ)*$!#'K*22+77 LDMBGE1F*#
LDMBGE1F*$
LDMBGE1F*, LDMBGE1F*%
LDMBGE1F*"
H43K*.SDTB*ULDSEB*?7*91VB7NBF*$!#'
day. hh:mm (in December 2018) 09. 09:3609. 09:5509. 10:1409. 10:3309. 10:5209. 11:1209. 11:3109. 11:5009. 12:0909. 12:2809. 12:4
8
09. 13:0709. 13:2609. 13:4509. 14:0409. 14:2409. 14:4 3 09. 15:0
2 09. 15:2
1 09. 15:4
0 09. 16:0
0 09. 16:1909. 16:3
8 09. 16:5
7 09. 17:1609. 17:3609. 17:5
5 09. 18:1
4 09. 18:3
3 09. 18:5
2 09. 19:12
injector 1 injector 2 injector 3 injector 4 injector 5 injector 6 HCl analysis raw gas SO2 analysis raw gas
flow fluegas at stack and reci boiler O2 analysis raw gas 250,000
200,000 150,000 100,000 50,000 0
flue gas flow at boiler exit Nm³/h
12 10 8 6 4 2 O2 at boiler exit
Vol.-%
SO2 raw gas mg/Nm³
0 50 100 150 85
80 75 70 65 60 90 95 100
HCl raw gas mg/Nm³
25 20
10 5 0 15
sulphur mass flow kg /h
During combustion of the waste, the sulphur injection leads to an increase of SO2 and HCl. By the increase of SO2, it is possible to evaluate the efficiency of the reaction from sulphur to SO3. In the case shown in the diagram of Figure 14, the yield for the oxidation reaction is between 70 and 85 %.
Before and after injection campaign, cor- rosion probes were installed in the boiler in the area of the superheater. The results are not available at that time.
Figure 13: Results of sulphur injection during firing of fuel oil, MVV Plymouth WtE Plant
osion Figure 14: Results of sulphur injection during firing of waste, MVV Plymouth WtE Plant
4. Summary
It is found that chlorine is a major player in the role of corrosion. The way chlorine is acting as a corrosive species is rather complex. Heavy metals like zinc and lead as well as alkalines like sodium and potassium are relevant for molten salt corrosion and also for dry deposit corrosion. Chlorine induced corrosion can be minimized by sulphation, i.e. conversion of chloride salts to sulphate salts. The less corrosive character of sulphate salts in comparison to chlorine salts is widely reported. The re-salting from chlorides to sulphates can be done by SO3. SO2 is not useful for sulphation. In cited publications, the effect of sulphation is described and it is recommended that the sulphation is done permanently and before the salts deposit on the tubes. These details of the proposed injection are contradicting to the cited theories which prefer sulphation in advance of depositing.
day. hh:mm (in December 2018) 11. 12:00
injector 1 injector 2 injector 3 injector 4 injector 5 injector 6 11. 12:1211. 12:2411. 12:3611. 12:4811. 13:0011. 13:1211. 13:2411. 13:3611. 13:4811. 14:0011. 14:1211. 14:2411. 14:3611. 14:4811. 15:0011. 15:1211. 15:2411. 15:3611. 15:4811. 16:0011. 16:1211. 16:2411. 16:3611. 16:4811. 17:0011. 17:1211. 17:2411. 17:3611. 17:4811. 18:00
HCl analysis raw gas SO2 analysis raw gas
25 20 10 5 0 15
sulphur mass flow kg /h
30 35 40
SO2 raw gas mg/Nm³
0 50 100 150 1,100
1,000 900 800 700 600 1,200 1,300 1,400 HCl raw gas mg/Nm³
200 250 300 350 400 450 flow fluegas at stack and reci boiler O2 analysis raw gas
250,000 200,000 150,000 100,000 50,000 0
flue gas flow at boiler exit Nm³/h
12 10 8 6 4 2 O2 at boiler exit
Vol.-%
osion
From the authors´ own investigations it was found that elementary sulphur can be used to produce SO3 in a safe and cost-effective way directly inside the lower first radiation passes of boilers [7]. Furthermore, the field experiments show that a permanent injec- tion of SO3 is not necessary to minimize corrosion. A non-continuous dosing of SO3 causes sulphation of already existing deposits, minimizing their corrosive character.
During test operation of the sulphur injection it was found that the character of the de- posits changed from hard and sticky to softer and more brittle. The detailed mechanism behind this effect is not yet fully explained. One possible theory is that the continuous sintering structure is disturbed.
A relevant SO2 increase – causing an increasing amount of consumables in the flue gas treatment – doesn’t occur. As the sulphur is not injected permanently, of dew point effects on the cold end of the boiler – the economizer – did not occur.
Acknowledgment
The authors would like to thank MVV Environment for the opportunity to implement an installation at the Plymouth power plant (UK).
The thanks go above all to Kevin Souster, Uwe Zickert and James Ashton from MVV Plymouth for their comprehensive support.
5. Literature
[1] Evseeva, N. N., Bergman, A. G. 1952
[2] Herzog, T.; Spiegel, W. Schmidl, W.: Systematik der Korrosionsphänomene – Hinweise für den Betrieb und Korrosionsschutz. In: Born, M. (Herausgeber): Dampferzeugerkorrosion 2007. Frei- berg, Sachsen, Saxonia, S. 99-119
[3] Kautz, K.: Kristallchemische Untersuchungen zu den Ursachen der Korrosionen an Dampfer- zeugern in Müllverbrennungsanlagen, N. Jb. Mineralogische Abhandlungen 123, 3, 1975 [4] Krause, H. H.: High Temperature Corrosion Problems in Waste Incineration Systems, Journal
for Materials for Energy Systems, Vol. 7, No. 4, 322-332, March 1986
[5] Krause, H. H.; Vaughan, D. A.; Boyd, W. K.: Journal of Engineering for Power (now: Journal of Engineering for Gas Turbines and Power, hosted by ASME), 1997, Vol. 3, 448-452 and 1998, Vol. 3, 369-374 and 1999, Vol. 3, 449-459, articles originally from 1975, 1976, 1977
[6] Krüger, S.; Krüger, J.: Betrieb und Nutzen des SO3-Brenners. In: Thiel, S.; Thomé-Kozmiensky, E.; Quicker, P.; Gosten, A. (Hrsg.): Energie aus Abfall, Band 16. Neuruppin: Thomé-Kozmiensky Verlag GmbH, 2019, S. 467-477
[7] Krüger, J. : Patent: DE 10 2006 027 243 and EP 1 865 257.
[8] Magel, G.; Molitor, D.; Bratzdrum, C.; Koch, M.; Aleßio, H.-P. Wie kommt die Wärme in Rohr? – Korrosion ist oftmals ein Symptom hoher Wärmestromdichte. In: Thomé-Kozmiensky, K. J. und Beckmann, M. (Herausgeber): Energie aus Abfall, Band 9. Neuruppin: TK Verlag, 2012, S. 373-390 UND Herzog, T.; Molitor, D.; von Trotha, G.: Chlor allein kann’s nicht sein. Was ist die treibende Kraft hinter der Chlorcorrosion was bremst die Effizenz? In: Thomé-Kozmiensky, K. J. und Beck- mann, M. (Herausgeber): Energie aus Abfall, Band 11. Neuruppin: TK Verlag, 2014, S. 459-473 [9] Miller, P. D. et al.: Corrosion Studies on Municipal Incinerators. Battelle Report to Environmental
Protection Agency, EPA Report SW-72-3-3, 1972
osion [10] Sorell, G.: The role of chlorine in high temperature corrosion in waste-to-energy plants. In: Ma-
terials at High Temperatures Volume 14, 1997 – Issue 3: Corrosion in Advanced Power Plants.
Proceedings of the Second International Workshop on Corrosion in Advanced Power Plants, Tampa, Florida, 3–5 March 1997
[11] Spiegel, W.; Herzog, T.; Jordan, R.; Magel, G.; Müller, W.; Schmidl, W.: Korrosions-Früherken- nung bei Abfall-, Biomasse- und EBS-Kraftwerken. Thomé-Kozmiensky, K.J. und Beckmann, M. (Hrsg.): Energie aus Abfall. Band 3. Neuruppin: TK Verlag, S. 235-258, September 2007 [12] Spiegel, W.: Einsatz von Additiven zur Begrenzung der Hochtemperatur-Chlorkorrosion als
Option neben anderen Korrosionsschutzmaßnahmen. In: Manfred Born (Hrsg.): Dampferzeu- gerkorrosion. Freiberg i.S.: SAXONIA, S. 63-70, 2007
[13] Spiegel et. al: Korrosion in Abfallverbrennungsanlagen, 2010 [14] Tappe, T.: 15th VDI Conference, Firing and Boiler; June 2016
[15] Tappe, T.: Minderung des Korrosionsrisikos im Feuerraum des EBS Kraftwerks der Weener Energie GmbH & Co. KG, WVT Breiding, Rostock, 05.-06.04.2016
[16] Vaughan, D. A.; Krause H. H.; Boyd, W. K.: Ash Deposition and Corrosion due to Impurities in Combustion Gases. In R.W. Bryers: Hemisphere Publishing Corp. Washington ,D.C., pp. 455- 472, 1977
[17] Warnecke, R.: Übersicht über die verschiedenen Modelle zur HT-Korrosion. 051-VDI-Wissens- forum-04-KorrosionsModelle-Manu
[18] Wanecke, R.; Kautz, K.: Übersicht über die verschiedenen Modelle zur HT-Korrosion, https://
gks-schweinfurt.de/images/pdf2004/01-VDI-WF-04-KorrosionsModelle%20-%20War- necke%20-%20Manu.pdf
Contact Person
Dr.-Ing. Sascha Krüger IBK Verfahrenstechnik Robert-Koch-Allee 8
99438 Bad Berka, Deutschland +49 1722069321
s.krueger@ibk-verfahrenstechnik.de
Other institution involved
VWT Ing.-Büro
Download Free Articles
on www.vivis.de
waste incineration
photovoltaic
flue gas treatment
balancing and evaluation
bio waste
biogas
biomass
soil steam generator
dismantling
waste incineration
dismantlingwaste incineration
landfill
emission trading
pyrolysis
solid recovered fuels
logistics
district heating, district cooling, process steam
odour
sewage sludge
corrosion and materials
mechanical-biological treatment
mechanical treatment
mineral by-products and wastes
co-incineration
electricity grids
physical- chemical treatment
planning
legislation
recycling
electricity grids
recycling
electricity grids residues
solar thermal energy
recycling
solar thermal energy
recycling energy storage
photovoltaic
energy storage
photovoltaic
drying
turbine and generator underground storage and backfilling of mines
waste generation
fan and stack
gasification
wind power
profitability
About two thousand technical papers have been published so far from us.Tey will give you a good overview of technical, economic, legal and political developments. Many of these posts you can download without registration.
HOW DO I FIND RELEVANT ARTICLES?
Alternative 1: Search by topic
If you are looking for articles regarding a specific topic, please go to Fachaufsätze (i.e. technicalarticles, in the top right corner of our homepage). On the right side you will find the topics. Just click on your topic of interest, and you will find the available relevant articles with their bibliographical data. In order to open and download the article, click on the blue link.
If you like to open in in a different tab, rightclick the site and choose „open in different tab“.
Alternative 2: Search by conference
If you are looking for articles regarding a specific conference/congress or book, please go to Fachbücher (i.e. textbooks, in the top right corner of our homepage). Here you find a list of the themes, which are covered by our publications. Choose your field of interest. You will then see all relevant books. The latest publications are recapped under the categorie Neuerscheinungen (i.e. new releases). Once you find the right book, follow the link mehr . In order to open and download an article published in the book, click on the articles title.
If you are interested in several articles of the same book, you should consider buying. Available books can be ordered via Buchbestellung (ie. book orders).
Dorfstraße 51
D-16816 Nietwerder-Neuruppin
Phone +49.3391-45.45-0 • Fax +49.3391-45.45-10 E-Mail: order@vivis.de
TK Verlag GmbH
Bibliografische Information der Deutschen Nationalbibliothek Die Deutsche Nationalbibliothek verzeichnet diese Publikation in der Deutschen Nationalbibliografie; detaillierte bibliografische Daten sind im Internet über http://dnb.dnb.de abrufbar
Thiel, S.; Thomé-Kozmiensky, E.; Winter, F.; Juchelková, D. (Eds.):
Waste Management, Volume 9 – Waste-to-Energy –
ISBN 978-3-944310-48-0 Thomé-Kozmiensky Verlag GmbH
Copyright: Elisabeth Thomé-Kozmiensky, M.Sc., Dr.-Ing. Stephanie Thiel All rights reserved
Publisher: Thomé-Kozmiensky Verlag GmbH • Neuruppin 2019 Editorial office: Dr.-Ing. Stephanie Thiel, Elisabeth Thomé-Kozmiensky, M.Sc.
Layout: Claudia Naumann-Deppe, Janin Burbott-Seidel, Sarah Pietsch, Ginette Teske, Roland Richter, Cordula Müller, Gabi Spiegel Printing: Universal Medien GmbH, Munich
This work is protected by copyright. The rights founded by this, particularly those of translation, reprinting, lecturing, extraction of illustrations and tables, broadcasting, micro- filming or reproduction by other means and storing in a retrieval system, remain reserved, even for exploitation only of excerpts. Reproduction of this work or of part of this work, also in individual cases, is only permissible within the limits of the legal provisions of the copyright law of the Federal Republic of Germany from 9 September 1965 in the currently valid revision. There is a fundamental duty to pay for this. Infringements are subject to the penal provisions of the copyright law.
The repeating of commonly used names, trade names, goods descriptions etc. in this work does not permit, even without specific mention, the assumption that such names are to be considered free under the terms of the law concerning goods descriptions and trade mark protection and can thus be used by anyone.
Should reference be made in this work, directly or indirectly, to laws, regulations or guide- lines, e.g. DIN, VDI, VDE, VGB, or these are quoted from, then the publisher cannot ac- cept any guarantee for correctness, completeness or currency. It is recommended to refer to the complete regulations or guidelines in their currently valid versions if required for ones own work.