Physics & Earth Sciences | Physical Oceanography
The circulation and distribution of heat within Warm Deep Water in the Weddell
Gyre: an Argo float perspective
by
Krissy Anne Reeve
A Thesis submitted in partial fulfilment of the requirements for the degree of
Doctor of Philosophy in Geosciences
Approved Dissertation Committee:
Prof. Dr. Rüdiger Gerdes
1,2(chair) Prof. Dr. Laurenz Thomsen
1Prof. Dr. Torsten Kanzow
2,3Prof. Dr. Andreas Muenchow
41Jacobs University Bremen, Germany
2 Alfred Wegener Institute, Bremerhaven, Germany
3 Bremen University, Germany
4 University of Delaware Newark, USA
Date of Defence: December 14
th2018
I | P a g e Statutory Declaration
Family Name, Given/First Name Reeve, Krissy Anne
Matriculation number 20329691
What kind of thesis are you submitting:
Bachelor‐, Master‐ or PhD‐Thesis PhD Thesis
English: Declaration of Authorship:
I hereby declare that the thesis submitted was created and written solely by myself without any external support. Any sources, direct or indirect, are marked as such. I am aware of the fact that the contents of the thesis in digital form may be revised with regard to usage of unauthorized aid as well as whether the whole or parts of it may be identified as plagiarism. I do agree my work to be entered into a database for it to be compared with existing sources, where it will remain in order to enable further comparisons with future theses. This does not grant any rights of reproduction and usage, however.
The Thesis has been written independently and has not been submitted at any other university for the conferral of a PhD degree; neither has the thesis been previously published in full.
German: Erklärung der Autorenschaft (Urheberschaft)
Ich erkläre hiermit, dass die vorliegende Arbeit ohne fremde Hilfe ausschließlich von mir erstellt und geschrieben worden ist. Jedwede verwendeten Quellen, direkter oder indirekter Art, sind als solche kenntlich gemacht worden. Mir ist die Tatsache bewusst, dass der Inhalt der Thesis in digitaler Form geprüft werden kann im Hinblick darauf, ob es sich ganz oder in Teilen um ein Plagiat handelt. Ich bin damit einverstanden, das s meine Arbeit in einer Datenbank eingegeben werden kann, um mit bereits bestehenden Quellen verglichen zu werden und dort auch verbleibt, um mit zukünftigen Arbeiten verglichen werden zu können. Dies berechtigt jedoch nicht zur Verwendung oder Vervielfältigung.
Diese Arbeit wurde in der vorliegenden Form weder einer anderen Prüfungsbehörde vorgelegt noch wurde das Gesamtdokument bisher veröffentlicht.
...
Date, Signature
III | P a g e
Abstract
The Weddell Gyre supplies heat towards the Antarctic ice shelves and regulates the density of water masses that feed the deepest limb of the global overturning circulation, and is therefore a fundamental component in the global climate system. Our understanding of the Weddell Gyre hydrography is limited due to sparse data availability. Furthermore, long-term trends are masked by significant variability, and previous estimates show a large range in the strength of the Weddell Gyre’s horizontal circulation, for reasons that are unclear.
In this thesis, Argo float profile and trajectory data spanning the entire Weddell Gyre from 2002 to 2016 are utilised in order to determine the horizontal circulation and distribution of heat within the Warm Deep Water (WDW) layer, which is the primary heat source to the Weddell Gyre. Objective mapping is applied to Argo float profiles, to provide gridded maps of temperature and salinity on fixed pressure levels from 50 to 2000 dbar. A 3-dimensional grid of the horizontal stream function is obtained, from which horizontal circulation is described. Volume transports throughout the gyre are calculated and placed into context of existing estimates in the literature. The heat budget for a 1000 m thick layer encompassing the core of WDW is presented, to investigate the mechanisms by which heat is redistributed throughout the WDW layer of the Weddell Gyre.
The horizontal sub-surface temperature distribution, i.e. core of the WDW layer, shows the warmest WDW entering the gyre in the southern limb from the east, and the coldest WDW within the interior. The Taylor column situated over Maud Rise is distinguished by a cold, deep WDW core. The circulation describes an elongated, cyclonic, double- cell gyre, in which the western cell is weaker and virtually barotropic, and the eastern cell is stronger and is influenced by baroclinic shear. This is the first time a detailed, comprehensive view of the double-cell structure is obtained purely from in-situ measurements. There is an inflow of 83 ± 22 Sv into the Weddell Gyre, of which 28 ± 7 Sv is WDW. Significant recirculation in the gyre interior is observed (15 ± 8 Sv in the WDW layer, 71 ± 28 Sv in the full water column), owing to the strong eastern circulation cell. It is shown that the large variation in previous estimates of the Weddell Gyre strength is likely due to the zonal variation in the gyre structure. While the heat
IV | P a g e
budget does not close at the resolution of the grid cells, it does almost close when integrated over large areas. In general, there is a balance between mean horizontal advection and horizontal turbulent heat diffusion (representative of eddy processes), whereas the vertical terms contribute relatively little. Horizontal turbulent diffusion contributes towards redistributing heat throughout the gyre, by diffusing heat northward from the southern limb into the interior circulation cell (6.5 ± 3 TW), and coastward towards the ice shelves (inferred as 12.5 ± 10 TW). 20 ± 10 TW of heat enters the gyre across the northern boundary from the Antarctic Circumpolar Current by horizontal turbulent diffusion. The influence of eddy processes is implied in the lee of Maud Rise, where heat divergence due to horizontal turbulent diffusion is observed. This may be due to baroclinic instabilities on the flanks of Maud Rise, which leads to enhanced convection. One outstanding question from this thesis concerns the response of the double-cell circulation to long-term changes in the wind field, and how this might alter the mechanisms by which heat is injected into and subsequently redistributed throughout the Weddell Gyre.
V | P a g e
Table of Contents
ABSTRACT ... III TABLE OF CONTENTS ... V LIST OF FIGURES ... VIII LIST OF TABLES ...XI LIST OF ACRONYMS ...XII
1 INTRODUCTION ... 1
1.1 GLOBAL OCEAN CIRCULATION ... 1
1.2 THE SOUTHERN OCEAN ... 1
1.3 THE WEDDELL GYRE ... 4
1.3.1 Structure, circulation and water masses of the Weddell Gyre ... 4
1.3.2 The role of wind and sea-ice on Weddell Gyre dynamics ... 9
1.3.3 Long-term changes in the Weddell Gyre ... 12
1.4 RESEARCH QUESTIONS AND PROJECT AIM ... 14
1.5 THESIS OUTLINE ... 16
1.6 LIST OF OWN RELEVANT PUBLICATIONS ... 17
2 DATA: ARGO FLOATS, A TOOL FOR OBSERVING LARGE-SCALE PROPERTIES OF THE POLAR SEAS . 19 3 PUBLICATION I: ... 23
ABSTRACT ... 25
3.1 INTRODUCTION ... 26
3.2 SOURCE DATA DESCRIPTION:ARGO FLOAT PROFILES ... 28
3.3 METHODS ... 33
3.3.1 Sub-surface temperature maximum ... 33
3.3.2 Objective Mapping ... 35
3.3.2.1 Approach ... 35
3.3.2.2 Objective Mapping ... 37
3.3.2.3 Choosing appropriate length scales (L, F) and selecting N surrounding data points to a grid point 39 3.4 OBJECTIVE MAPPING PERFORMANCE ... 43
3.4.1 Error sources... 43
3.4.2 Mapping the sub-surface temperature maximum: two approaches compared ... 49
3.4.3 Objective Mapping to float profile locations ... 52
3.5 RESULTS... 57
3.5.1 Sub-surface conservative temperature maximum ... 57
3.5.2 Conservative temperature and absolute salinity at 800 dbar ... 60
3.6 DISCUSSION ... 62
3.6.1 Approach to objective mapping – comparison to climatologies ... 62
3.6.2 Water Mass Properties of the Weddell Gyre: along the Prime Meridian ... 70
3.7 CONCLUDING REMARKS ... 74
3.8 APPENDIX 1:DATA FORMAT: GRIDDED FIELDS OF UPPER WEDDELL GYRE WATER PROPERTIES... 76
ACKNOWLEDGEMENTS ... 78
4 PUBLICATION II ... 79
ABSTRACT ... 81
4.1 INTRODUCTION ... 82
4.2 METHODS ... 86
4.2.1 Argo float data ... 86
VI | P a g e
4.2.2 Baroclinic geostrophic velocity relative to 800 dbar from hydrographic profile data ... 88
4.2.3 Objective mapping of parking depth velocity derived from trajectory data ... 89
4.2.4 Determination of a reference dynamic height field from absolute velocity at 800 dbar .. 91
4.2.5 Calculating volume transports: gyre-scale means and cross-sections for WDW, the upper 2000 m and the full-ocean depth ... 91
4.2.6 Estimating uncertainty through perturbation of the flow field ... 93
4.2.6.1 Sources of error ... 93
4.2.6.2 Estimate of uncertainty of volume transports through “perturbed scenarios” ... 95
4.3 RESULTS... 98
4.3.1 Weddell Gyre circulation in the upper 50-2000 dbar ... 98
4.3.2 Volume transports of WDW throughout the Weddell Gyre ... 103
4.4 DISCUSSION ... 109
4.4.1 Volume transport of the Weddell Gyre: comparison to previous transport estimates ... 109
4.4.2 Weddell Gyre circulation: a gyre scale perspective ... 119
4.4.2.1 The shelf-edge and coastal flow ... 120
4.4.2.2 Deep baroclinic flow ... 121
4.4.2.3 Seasonal and inter-annual variability in the Weddell Gyre circulation ... 124
4.4.3 How consistent are the current estimates of the Weddell Gyre Circulation? ... 125
4.5 CONCLUSIONS ... 128
4.6 APPENDIX: ... 130
4.6.1 Data acquisition and processing ... 130
4.6.1.1 Argo float trajectory data ... 130
4.6.1.2 Argo float profile data ... 134
4.6.2 Methods Flow Chart ... 135
4.7 ACKNOWLEDGEMENTS ... 137
5 PUBLICATION III: ... 139
ABSTRACT ... 141
5.1 INTRODUCTION ... 142
5.2 THE HEAT BUDGET ... 143
5.2.1 Vertical boundary conditions for heat budget integrals: ... 146
5.3 DATA RESOURCES ... 148
5.3.1 Gridded velocity and temperature fields derived from Argo floats: ... 148
5.3.2 Vertical Ekman pumping velocity derived from the wind stress field: Era-interim: ... 150
5.3.3 Air-sea-heat fluxes: ... 152
5.4 RESULTS... 153
5.4.1 Part 1: the large-scale investigation of heat within the Weddell Gyre ... 153
5.4.2 Part 2: zonal variation in the heat budget and temperature ... 158
5.5 DISCUSSION ... 165
5.5.1 Study limitations ... 165
5.5.2 The Weddell Gyre heat budget ... 170
5.6 SUMMARY: INTERPRETATION OF RESULTS ... 178
5.7 ACKNOWLEDGEMENTS ... 182
6 CONCLUSIONS: THE CIRCULATION AND DISTRIBUTION OF HEAT WITHIN THE CORE OF WARM DEEP WATER ... 183
RQ.1.IS IT POSSIBLE TO CREATE GRIDDED DATA SETS OF TEMPERATURE AND SALINITY THROUGHOUT THE ENTIRE WEDDELL GYRE, DESCRIBING THE SPATIAL VARIATION IN THE HYDROGRAPHY OF THE UPPER WATER COLUMN, WHICH INCLUDES THE WDW LAYER? ... 184
RQ.2.CAN THE LARGE RANGE IN HISTORICAL GYRE STRENGTH ESTIMATES BE RECONCILED WITH SPATIAL INHOMOGENEITY OF THE CIRCULATION OF THE WEDDELL GYRE? ... 186
RQ.3.IN BRINGING TOGETHER THE OUTCOMES FROM RQ.1 AND RQ.2, WHAT MECHANISMS CONTRIBUTE TO DISTRIBUTING HEAT WITHIN THE WDW LAYER OF THE WEDDELL GYRE? ... 189
LIMITATIONS OF RESEARCH ... 193
VII | P a g e
6.1 FUTURE OUTLOOK ... 197
6.2 FINAL CONCLUSION ... 203
7 REFERENCE LIST ... 206
8 ACKNOWLEDGEMENTS ... 219
VIII | P a g e
List of Figures
1.1 Schematic of the main Southern Ocean currents, from Rintoul et al., 2001…….. 2 1.2 Schematic of the Weddell Gyre circulation overlying bathymetry……… 6 1.3 Neutral density (kg m-3) for a section along the Prime Meridian from the cruise
ANT-X/4 in 1992, from Fahrbach et al., 2011……….. 8 2.1 A typical Argo profile cycle, where the duration of each cycle is 10 days. From
the Argo project office website, www.argo.ucsd.edu... 20 3.1 Schematic of Weddell Gyre circulation. The underlying 3D map shows ocean
bottom depth………... 27
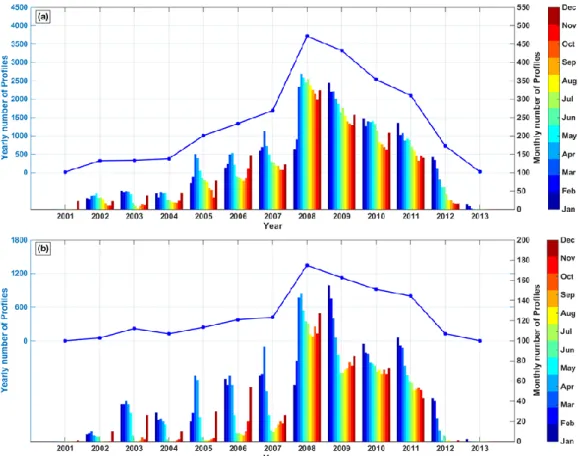
3.2 Argo float profile locations……… 29 3.3 The number of profiles per year (line) and per month (bars) ……… 30 3.4 Argo float profile stations, with interpolated (under-ice) station locations
marked in red, with filled contours of f/H……….. 31 3.5 A random sample of pressure (dbar) – conservative temperature (°C) profiles
from Argo floats………. 34
3.6 Schematic to explain the weighting in objective mapping……… 38 3.7 The fractional distance in potential vorticity (F) as a function of the difference
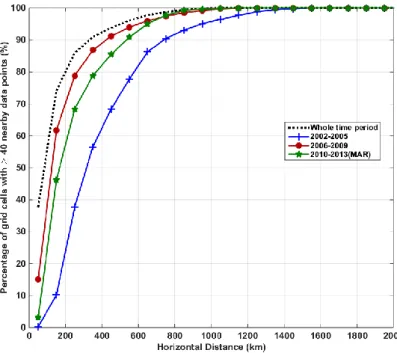
in bottom ocean depth (H) between two locations………. 38 3.8 The percentage of grid cells with at least 40 profiles within an area of different
radii, for different horizontal distances (km)……….. 40 3.9 The e-folding decay scale for two example grid points………. 42 3.10 The e-folding decay scale for an example grid point in the south western
Weddell Gyre………. 42
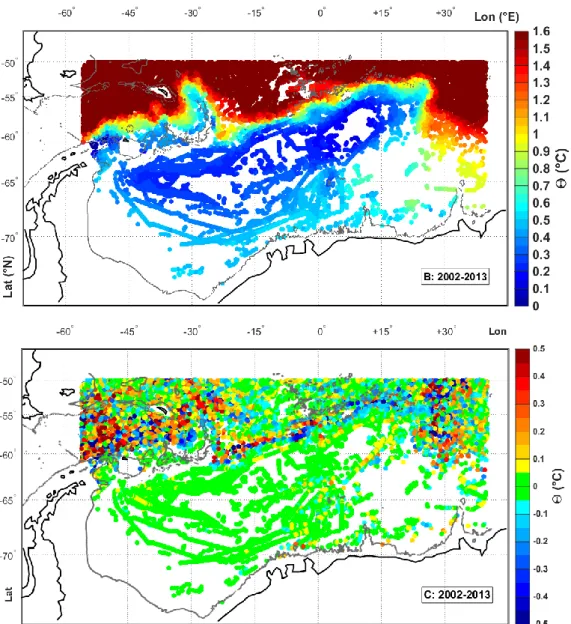
3.11 Conservative temperature (°C) at the sub-surface temperature maximum (a)
original profiles, (b) gridded map and (c) mapping error……….. 44 3.12 Pressure (dbar) at the sub-surface temperature maximum (a) original profiles,
(b) gridded map and (c) mapping error……….. 45 3.13 The vertical pressure profile of the area-weighted mean mapping error for (a)
conservative temperature (°C) and (b) absolute salinity (g kg-1)………... 48 3.14 (a) Conservative temperature (°C) at the sub-surface temperature maximum and
the corresponding mapping error (b)……….. 51 3.15 The temperature difference (°C) between the gridded sub-surface temperature
maximum, where two different approaches were implemented………. 52 3.16 Conservative temperature (°C) at 800 dbar (a) original profiles, (b) objectively
mapped to the profile locations and (c) the difference between panels (a)-(b)….. 53 3.17 A histogram showing the percentage of data points binned by temperature
residuals (°C) at 800 dbar………... 54 3.18 A histogram showing the percentage of data points binned by temperature
residuals (°C) at the sub-surface temperature maximum………... 55 3.19 The percentage of data points binned by pressure residuals (dbar) at the level of
the sub-surface temperature maximum……….. 56 3.20 (a) Mean meridional sub-surface temperature maximum (°C) and the
meridional gradient of the sub-surface temperature maximum (b)……… 58 3.21 Conservative temperature (°C) at 800 dbar (a) original profiles, (b) gridded map
and (c) mapping error………. 59
IX | P a g e 3.22 Absolute salinity (g kg-1) at 800 dbar (a) original profiles, (b) gridded map and
(c) mapping error……… 61
3.23 Time spans of a list of climatologies, including the time spans of the data set
provided here……….. 63
3.24 Conservative temperature (ºC) at 800 m from the WOA13 climatology during 2005 to 2012, and the difference between panel (a) and the data provided in
Chapter 3 (Fig. 3.21b)……… 64
3.25 Absolute salinity (g kg-1) at 800 m from the WOA13 climatology during 2005 to 2012, and the difference between panel (a) and the data provided in Chapter
3 (Fig. 3.22b)……….. 66
3.26 Conservative temperature (ºC) at 800 m from the global WOCE climatology during 1900 to 2000, and the difference between panel (a) and the data provided
in Chapter 3 (Fig. 3.21b)……… 67
3.27 Absolute salinity (g kg-1) at 800 m from the WOCE climatology during 1900 to 2000, and the difference between panel (a) and the data provided in Chapter 3
(Fig. 3.22b)………. 68
3.28 Potential temperature (ºC) - salinity diagram of data extracted from the entire
time span data set (WG_all) from along the Prime Meridian……… 70 3.29 (a) Potential temperature (ºC) and mapping error (b) for a section from 56º S to
the coast along the Prime Meridian……… 71 3.30 (a) Absolute salinity (g kg-1) and mapping error (b) for a section from 56º S to
the coast along the Prime Meridian……… 72 3.31 Neutral density (kg m-3) (a) and mapping error (kg m-3) (b) for a section from
56º S to the coast along the Prime Meridian……….. 73 3.32 Potential temperature (ºC) (a) and salinity (b) for a section from 56º S to the
coast along the Prime Meridian from the WOA13 climatology……… 73 4.1 Schematic of the Weddell Gyre circulation overlying bathymetry…………...… 84 4.2 Map of sub-surface temperature maximum (ºC), with Argo float profile
positions and a T-S diagram showing the WDW layer in the upper 2000 dbar…. 85 4.3 Percentage of profile and trajectory data taking place seasonally and yearly…… 87 4.4 Maps of the stream function (m2 s-1) at various depth levels………. 99 4.5 Baroclinic shear between 50 and 2000 dbar (m2 s-1)……….. 102 4.6 Volume transports (Sv) along the inflow, central gyre axis and outflow for the
WDW layer………. 104
4.7 Volume transports (Sv) along the inflow, central gyre axis and outflow for 50-
2000 dbar……… 105
4.8 Volume transports (Sv) along the inflow, central gyre axis and outflow for the
full water column……… 106
4.9 Schematic to explain how quadrants of the Weddell Gyre were defined for
calculation on the mean volume transports in each sector of the gyre…………... 108 4.10 Map of cross-sections and corresponding graphs presenting an in-depth direct
comparison between Argo-derived volume transports and those available in the
literature (Sv)……….. 111
4.11 Velocity vectors of Argo float trajectories, southeast Weddell Gyre (m s-1)……. 120 4.12 Stream function at 800 dbar (m2 s-1) with f/H (thick black) contours……… 123 4.A1 Percentage histogram of the median time delay (in hours) between float
surfacing (diving) times and the time at which connection to satellite was
established (ended)………. 130
X | P a g e
4.A2 An example Argo float trajectory with surface satellite-fixed positions and
estimated positions when the float first arrives and last leaves the surface……... 132 4.A3 Distance and velocity difference between first (last) satellite fix and the
predicted positions for JAE (JDS)……….. 133 4.A4 Example profile of dynamic height relative to 800 dbar, to demonstrate how the
profiles were extrapolated using ship-based CTD data, to the full-ocean depth… 134 4.A5 Flowchart of the methods implemented for Chapter 4………... 136 5.1 Sub-surface conservative temperature maximum (Θmax) with streamlines of the
vertically integrated stream function for 50-2000 dbar……….. 143 5.2 Vertical temperature profile (ºC), mid-thermocline depth (m) and temperature
difference between vertical boundaries (ºC), with original float positions …….. 147 5.3 Surface wind stress (N m-2) and vertical Ekman pumping velocity (m/year)
from the Era-Interim ECMWF reanalysis product………. 151 5.4 Net-air-sea-heat-flux (W m-2) from Era-Interim ECMWF reanalysis product…... 154 5.5 Maps of the heat budget terms described in Eq. 1 (W m-2)……… 156 5.6 Depth-averaged temperature (ºC) for the 1000 m thick layer defined in Chapter
5.2.1……… 158
5.7 The mean temperature (ºC), the heat budget terms from Eq. 1 (W m-2) and the cumulative sum of the heat budget terms (TW), for the southern limb of the
gyre, where the region is provided in a map in panel (a)………... 160 5.8 The mean temperature (ºC), the heat budget terms from Eq. 1 (W m-2) and the
cumulative sum of the heat budget terms (TW), for the interior circulation cell
of the gyre, where the region is provided in a map in panel (a)………. 163 5.9 Mapping error for the sub-surface temperature maximum, with 0.5, 0.8, and 1.1
ºC contours………. 170
5.10 Zonal variation (W m-2) and cumulative sum (TW) of the horizontal turbulent
heat flux across the southern boundary of the interior circulation cell………….. 176 5.11 As with Fig. 5.11, but along the northern boundary of the Weddell Gyre………. 178 5.12 Schematic of the proposed mechanisms by which heat is distributed within the
WDW layer throughout the Weddell Gyre……… 179 6.1 Distribution of profiles from Argo floats and animal-borne sensors in the Ross
Sea region, from www.coriolis.eu.org... 203
XI | P a g e
List of Tables
3.1 Standardized pressure levels (dbar) to which all profiles are linearly
interpolated………. 32
3.2 List of climatologies discussed in Section 3.6, along with their corresponding grid resolutions, number of interpolation passes, the first-guess fields and radii of influence for each interpolation pass……… 62 3.A1 List of netCDF filenames where the mapped field variables for the different
time-composite periods are found………. 76 3.A2 List of variable names in the accompanying netCDF file………. 77 4.1 Mean volume transport estimates for the Weddell Gyre for full depth and for
WDW………. 108
4.2 The citation, position, instrumentation and time period of volume transport
estimates in the literature………... 113 5.1 Explanations of the abbreviations used in Fig. 5.7-5.8……….. 160 5.2 Total heat budget contribution (TW) of the different terms in Eq. 1 for the
southern limb of the Weddell Gyre (Fig. 5.7a)……….. 162 5.3 Total heat budget contribution (TW) of the different terms in Eq. 1 for the
interior circulation zone of the Weddell Gyre (Fig. 5.8a)……….. 165
XII | P a g e
List of Acronyms
Antarctic Bottom Water AABW
Antarctic Circumpolar Current ACC
Antarctic Coastal Current ACoC
Antarctic Slope Current Antarctic Slope Front
ASC ASF
Circumpolar Deep Water CDW
Full depth FD
Horizontal Drift HD
Julian Day Ascent End JAE
Julian Day Descent Start JDS
Northern Limb NL
Prime Meridian PM
Southern Limb SL
Warm Deep Water WDW
Weddell Sea Deep Water WSDW
Weddell Sea Bottom Water WSBW
Sub-surface temperature maximum Tmax, Θmax Temperature mean for the WDW layer ΘWDW
Depth-Averaged temperature ΘAVE
World Ocean Atlas WOA
World Ocean Circulation Experiment WOCE
Surface drift SD
Full depth (of the water column) FD
Volume transport VT
Cross-section CS
Southern Annular Mode SAM
Mid-thermocline depth mT
Net air-sea-heat flux Qnet
1 | P a g e
1 Introduction
1.1 Global ocean circulation
The ocean plays an important role in the Earth’s climate system through the regulation, transport and storage of heat, freshwater, carbon and oxygen (i.e. Rhein et al., 2013). As such, understanding the drivers and pathways of large-scale ocean circulation is a fundamental component of climate science.
The thermohaline circulation (THC) describes the component of ocean circulation driven by density differences that arise from heat and freshwater fluxes at the sea surface (Sandström, 1916; Jeffreys, 1925). However, at steady state on a global scale, surface buoyancy fluxes alone will not sustain the Meridional Overturning Circulation (MOC): a mechanical energy input is required to mix heat downwards in order to maintain horizontal pressure gradients necessary to drive the MOC. Turbulent mixing of heat and salt in the ocean interior, driven, for example, by the initiation of internal waves from winds, tides and bathymetry, and wind-driven upwelling play an important role in sustaining the MOC (Munk & Wunsch, 1998; Rahmstorf, 2003). At the global scale, the MOC is characterised by (1) the sinking of water-masses in localised deep-water formation regions, (2) the spreading of these deep-water masses, for example, within deep western boundary currents, and (3) the wind-driven upwelling of deep waters. Wind-driven upwelling in the Southern Ocean and diapycnal upwelling in the deep Indian and Pacific Oceans are essential for allowing the deep and bottom water masses formed in the North Atlantic (North Atlantic Deep Water; NADW) and the Southern Ocean (Antarctic Bottom Water; AABW) to once again return to the surface (Marshall & Speer, 2012; Talley, 2013). The focus here is on the Southern Ocean.
1.2 The Southern Ocean
The Southern Ocean is a unique feature of the Earth’s climate system, in that it links all major ocean basins and has no meridional boundaries. It is also the region of the so-called roaring forties, furious fifties and screaming sixties; strong westerly winds which dominate the wind stress field between 40 and 60º S, for the most part unhindered by landmass. Meridional temperature gradients and the strong westerly winds drive the Antarctic Circumpolar Current (ACC), the world’s strongest ocean current, whose eastward transport has been estimated to be stronger than 150 Sv (Park
2 | P a g e
et al., 2009; Koenig et al., 2014). The ACC has a banded jet-like structure, where the bulk of the transport is concentrated within a series of fronts that run along the ACC (Deacon, 1937; Baker et al., 1977; Nowlin & Klinck, 1986; Orsi et al., 1995). The northern boundary of the ACC is identified by the Subantarctic Front, north of which the downwelling of surface waters occurs due to Ekman convergence (e.g. Koshlyakov
& Tarakanov, 2011). Within the central ACC there is the Polar Front, characterised by the onset of a sub-surface temperature minimum layer southwards of the Polar Front (Taylor et al., 1978; Orsi et al., 1995). South of the ACC, Ekman divergence results in the upwelling of water masses at the interface between the strong westerly winds and the polar easterly winds at the Antarctic coast (Taylor et al., 1978; Deacon, 1982;
Hayakawa et al., 2012). Other fronts include the Southern ACC Front and the southern boundary of the ACC. Poleward of these fronts, along the continental slope of Antarctica, the Antarctic Slope Front is distinguished by a westward counter flow, which protects the continental shelf seas from being breached by warmer waters from the north (Jacobs, 1991; Orsi et al., 1995; Whitworth et al., 1998; Chevanne et al., 2010). A basic schematic of the Southern Ocean circulation is provided in Fig. 1.1, originally from Rintoul et al., 2001.
Figure 1.1. Schematic of the main Southern Ocean currents, from Rintoul et al., 2001. Grey regions indicate bottom depths of less than 3500 m. The Polar Front and Subantarctic Front present the main cores of the banded structure of the ACC. The Weddell and Ross Gyres are labelled, in the Atlantic and Pacific sectors of the Southern Ocean respectively.
3 | P a g e Since there are limited meridional boundaries in the upper 2000 m (the depth of the water column within Drake Passage is below 2000 m), there are no east-west pressure gradients within the latitude band of Drake Passage, which means that within this upper layer, there can be no meridional geostrophic flow. Thus, Ekman upwelling is able to occur from great depths, driving a northward flow that can only be returned below 2000 m, where meridional boundaries enable an east-west pressure gradient, which can drive a southward return flow (Gill & Bryan, 1971; Cox, 1989; Toggweiler &
Samuels, 1995). Thus, the Southern Ocean is the only place in the global ocean where direct large-scale upwelling of deep water (Circumpolar Deep Water; CDW) to the sea surface occurs, helping to connect the upper and lower cells of the MOC (Marshall &
Speer, 2012; Talley, 2013). The impact of this large-scale upwelling is most distinct in maps of near-surface nutrient concentrations, such as nitrate (Levitus et al., 1993;
Sarmiento et al., 2004). CDW is formed by modification of North Atlantic Deep Water (NADW), which is drawn into the ACC. While circulating the ACC, NADW interacts with water from other ocean basins, forming CDW. There are two classes of CDW characterised by their density; the lighter component of CDW, upper CDW (UCDW) is upwelled and transported northwards, whereas the denser component, lower CDW (LCDW) is advected southwards towards the poles (Callahan, 1972; Whitworth &
Nowlin, 1987; Smith et al., 1999).
The ACC has previously been described as ―equivalent barotropic‖, which essentially means unidirectional, but with shear reducing velocity magnitude with increasing depth (Killworth, 1992; Killworth & Hughes, 2002; Gille, 2003). Thus, at 2000 dbar, the ACC shows a similar circulation to the surface, with weaker magnitudes (Gille, 2003). However, topographic obstacles below 2000 m result in strong topographic steering of the circulation (Gille, 2003), and the meridional boundary below 2000 m at Drake Passage results in horizontal pressure gradients. This leads to deep western boundary currents as a distinctive feature of the circulation at 4000 dbar through the Scotia Sea, which transport deep and bottom water masses northward to begin the return journey to the source location in the North Atlantic (Sloyan & Rintoul, 2001; Talley, 2013).
Peña-Molino et al., (2014) challenge the view of the ACC as ―equivalent barotropic‖, except within jet centres, where flow rotation is weak. Conversely, on the flanks of these jet streams and at depth, rotation is large. They show that, if we consider
4 | P a g e
the zonal flow of the ACC in terms of its barotropic and baroclinic components, the geostrophic transport is predominantly baroclinic, with the barotropic component of flow not exceeding 25% at any point in the ACC. Away from the ACC, the barotropic/baroclinic ratio is strongest in the centre of basins, at 10/90%, and least pronounced within the vicinity of complex topography (50/50%). The barotropic and baroclinic components act in opposite directions, and supports significant cross-stream transports (Peña-Molino et al., 2014). More recent research highlights topographic features as regions of enhanced upwelling of deep waters into the surface Southern Ocean, which has been associated with heightened mesoscale eddy activity (Tamsitt et al., 2017). These findings suggest that surface velocity data alone are not enough to determine the circulation and mass transports within the Southern Ocean (Peña-Molino, 2014).
South of the South ACC Front, polar gyres are a distinct feature of the Southern Ocean circulation. The two most prominent polar gyres are found to either side of the Antarctic Peninsula: the Ross Gyre and the Weddell Gyre, located in the Pacific and Atlantic sectors of the Southern Ocean respectively. These gyres play a pivotal role in the MOC (e.g. Mazloff et al., 2010), through the modification of LCDW, which is advected into the polar gyres, supplying heat to the continental ice shelves at the Antarctic coastline. In this thesis, the focus will be on the Weddell Gyre.
1.3 The Weddell Gyre
1.3.1
Structure, circulation and water masses of the Weddell Gyre
The Weddell Gyre is located in the Atlantic sector of the Southern Ocean, south of the ACC (Fig. 1.1). The gyre is cyclonic and encompasses the Weddell and Enderby basins, with open boundaries to the north and east, and closed boundaries of the Antarctic continent to the south and west. The open boundaries pose a substantial challenge in observing the mean state of the Weddell Gyre circulation, due to the dynamic, highly variable nature of the ACC (Fahrbach et al., 2004; Klatt et al., 2005;
Donnelly et al., 2017), and the sensitivity of the ACC and gyre peripheries to the wind field (Armitage et al., 2018). A basic schematic of the Weddell Gyre circulation in provided in Fig. 1.2. The presence of sea-ice and the bathymetric feature Maud Rise further contribute towards the challenge of observing the mean state of the Weddell Gyre circulation (Leach et al., 2011; Donnelly et al., 2017). Regardless, we have a good
5 | P a g e understanding of the general structure of the gyre, thanks to observations from as far back as the early 1900’s, when Brennecke (1918) first described the cyclonic nature of the Weddell Gyre, through combining measurements within the region from expeditions of several countries between 1901 and 1912.
The Weddell Gyre is primarily wind-driven, driving a cyclonic (clockwise) circulation, where eastward flowing westerly winds are superimposed over the northern limb of the gyre, and westward flowing easterly winds are superimposed over the southern limb of the gyre (Schwerdfeger, 1970; Fahrbach et al., 2011). The wind forcing results in upwelling in the gyre centre due to the Ekman divergence of surface waters, and downwelling at the gyre periphery, in particular along the Antarctic coast due to the easterly winds ―piling‖ the water up onto the coast (Deacon, 1979). Thus, when looking at meridional cross-sections of potential density, the Weddell Gyre is characterised by the doming of its isopycnals; the isopycnals shoal towards the surface along the central axis of the gyre and deepen along the gyre periphery (Schröder &
Fahrbach, 1999; also see Figs. 3.29-3.31). The upwelling at the surface along the gyre axis and the downwelling along the gyre periphery establishes an overturning circulation within the Weddell Gyre, where the upwelling of the upper cell acts as a source of carbon dioxide and loss of heat to the atmosphere, whereas the downwelling of the lower cell acts as a sink for carbon dioxide and heat (Naveira Garabato et al., 2016; Jullion et al., 2014; Brown et al., 2015). Thus, the Weddell Gyre contributes towards the lower limb of the global overturning circulation and plays an important role in the regulation of climate, in supplying heat to the global ocean interior (Jullion et al., 2014; Naveira Garabato et al., 2016).
Defining the eastern boundary of the gyre is not straightforward, and estimates range from 30 to 60° E (Gouretski & Danilov, 1993; Schröder & Fahrbach, 1999; Ryan et al., 2016). The ACC turns sharply southwards at about 26° E due to the topographic boundary of the mid-ocean ridge (Gouretski & Danilov, 1993). Some of this water is deflected westwards and forms the inflow region at the open eastern boundary of the Weddell Gyre. It is a highly dynamic region where topographic constraints result in an intense mesoscale eddy field between 15 and 30° E (Schröder & Fahrbach, 1999; Ryan et al., 2016; Donnelly et al., 2017), which poses a challenge in quantifying the inflow of heat into the Weddell Gyre. Ryan et al. (2016) show that the inflow of warm water to the Weddell Gyre occurs through two different pathways, which are distinct as separate
6 | P a g e
cores at 20° E but become indistinguishable at 0° E. Eddy-mixing in the north-eastern corner of the Weddell Gyre drives an inflow at about 60° S, while horizontal advection drives an inflow closer to the coast, which first extends eastwards past 30° E before turning westward into the Weddell Gyre (Ryan et al., 2016). This area remains an under-sampled region and the long-term mean of the inflow east of the Prime Meridian represents an important gap in our knowledge from an observational viewpoint.
Figure 1.2. Schematic of the Weddell Gyre circulation overlying bathymetry (IOC, IHO and BODC, 2003). The red arrows indicates the relatively warm and salty Circumpolar Deep Water, which enters the Weddell Gyre to the east from the ACC. As CDW enters the gyre, where it is named WDW (orange), it undergoes modification as it circulates the gyre (light orange arrow). WSBW spills into the Weddell Gyre basin from underneath the ice shelves in the southwestern Weddell Sea (purple arrows).
The dark blue arrows indicate the export routes of WSDW. The legend provides the names of prominent bathymetric features. The grey contours provide the 1000 and 2000 m isobaths. From Reeve et al. (in review).
LCDW is injected westwards into the southern limb of Weddell Gyre at a depth of about 800 to 1000 dbar (Orsi et al., 1993; Donnelly et al., 2017), though intrusions of CDW from the ACC also occurs to a lesser extent along the northern boundary (Klatt et al., 2005). Upon entering the Weddell Gyre, LCDW is locally known as Warm Deep Water (WDW), and is gradually modified, through entrainment and mixing of the underlying and overlying water masses as it circulates the Weddell Gyre (Orsi et al., 1993; Leach et al., 2011). It is also gradually upwelled towards the surface in the centre of the gyre, where it has been identified at its shallowest point at about ~100 dbar (Orsi et al., 1993; Reeve et al., 2016; Donnelly et al., 2017). WDW is distinguished by a sub- surface temperature and salinity maximum at its core (for example, see Figs. 3.28 to 3.30). WDW is the primary source water mass, which supplies heat towards the ice shelves in the western sector of the Weddell Gyre, leading to the formation of Antarctic
7 | P a g e Bottom Water (AABW). Intrusions of WDW onto the continental shelf through submarine troughs leads to basal melting of the Filchner Ronne Ice Shelf, the largest ice sheet in terms of volume surrounding Antarctica (Artun et al., 2012; Ryan et al., 2017).
Directly above WDW is the surface mixed layer, which experiences large seasonal variation due to air-sea-ice interaction. A sequence of feedback events that are relevant for the role of the Weddell Gyre in the climate system occurs throughout the year. In the approach to Austral winter, the atmosphere cools, and gradually becomes cooler than the surface of the ocean, resulting in a heat flux from the ocean to the atmosphere, i.e. surface cooling. Due to surface cooling, convective overturning leads to a relatively deep surface mixed layer. As the atmosphere continues to cool, and the surface of the ocean cools, a critical point is reached where sea-ice begins to form.
When sea-ice is formed, salt is rejected from the ice and brine water is released to the underlying water. The temperature of this water is close to its freezing point. Then, as the atmosphere begins to warm in the approach to Austral summer, the surface of the ocean is heated and sea-ice melts, creating a surface lens of relatively warm and fresh water. Owing to the stratification of the water column, the heat is unable to penetrate far into the water column. Thus, the cold and fresh water formed at the surface in the winter persists at the sub-surface throughout the summer months, and is easily recognisable by a sub-surface temperature minimum layer from the surface to about 50 to 150 m (Behrendt et al., 2011). The salinity of this sub-surface water mass, Winter Water (WW), plays a role in the stability of the upper Weddell Gyre, directly influencing the amount of convective overturning (Gordon & Huber, 1990; Behrendt et al., 2011). WW is entrained by the underlying WDW, and is also sensitive to freshwater fluxes due to variations in sea-ice formation (Behrendt et al., 2011).
Weddell Sea Deep Water (WSDW) and Weddell Sea Bottom Water (WSBW) are the water masses found below WDW. WSBW is the coldest and densest water mass in the Weddell Gyre, primarily produced within the vicinity of the Filchner-Ronne ice shelves, and the ice shelves that line the eastern flank of the Antarctic Peninsula, where plumes of cold High Salinity Shelf Water (HSSW) cascade down the continental slope to fill the bottom of the Weddell basin with WSBW (Foster & Carmack, 1976; Foster et al., 1980; Foldvik et al., 2004). WSDW is formed both by entrainment of WDW into WSBW as it cascades down the continental slope, and more directly through the mixing
8 | P a g e
of WDW with shelf waters at the shelf edge (Farhbach et al., 1995; Fahrbach et al., 2011).
WSBW is too dense to be able to directly escape the Weddell Gyre as a result of topographic constraints to the north (Gordon et al., 2001). WSDW is able to directly escape the Weddell Gyre, by flowing northwards along the continental slope towards the tip of the Antarctic Peninsula, where it is able to exit the Weddell Gyre through gaps in the South Scotia Ridge and the eastern flank of the Scotia Arc (Locarnini et al., 1993;
Gordon et al., 2001; Naveira Garabato et al., 2002; Schodlok et al., 2002). Here, WSDW feeds into AABW, which is then dispersed throughout much of the global ocean abyss. The water that does not escape the Weddell Gyre continues its circulation along the northern limb of the gyre, forming the return flow to the northeast of the Weddell Gyre, continuing to cool on-route. The WDW that reaches the northeastern quadrant of the Weddell Gyre cools considerably, forming the so-called ―cold regime‖
east of the Prime Meridian (Gordon & Huber, 1984), which partially recirculates about the easternmost part of the gyres central axis, mixing with the warmer incoming WDW, i.e. the ―warm regime‖ waters (Gordon & Huber, 1984). A cross-section along the Prime Meridian showing the Weddell Gyre water masses as indicated by their neutral density ranges is provided in Fig. 1.3, from Fahrbach et al. (2011).
Figure 1.3. Neutral density (kg m-3) for a section along the Prime Meridian from the cruise ANT-X/4 in 1992, from Fahrbach et al., 2011. The water masses are indicated by their neutral density ranges:
Circumpolar Deep Water (CDW) at the northern boundary, Winter Water (WW), Warm Deep Water (WDW), Weddell Sea Deep Water (WSDW) and Weddell Sea Bottom Water (WSBW).
The strongest currents within the Weddell Gyre are found at the periphery of the gyre. As much as 90% of the volume transport along the Kapp Norvegia-Joineville Island transect has been attributed to boundary currents along the shelf edge in Fahrbach et al., (1994). The Antarctic Coastal Current (ACoC) is a westward fast-flowing current over the continental shelf, with a primarily barotropic transport (Núñez-Riboni &
9 | P a g e Fahrbach, 2009). While poorly observed, observations have shown that the ACoC displays significant seasonal variability, with the strongest transports occurring during the Austral winter (Núñez-Riboni & Fahrbach, 2009; Cisewski et al., 2011). The ACoC is primarily driven by the wind field, but thermohaline forcing as a result of heating/cooling and sea-ice formation/melt are also driving mechanisms which contribute towards the seasonal variability of the ACoC (Núñez-Riboni & Fahrbach, 2009). The Antarctic Slope Front (ASF) sits at the continental shelf-edge, which separates the cold and relatively fresh coastal waters from the warmer, saltier waters farther offshore (Heywood et al., 2004). A barotropic jet is located at the ASF, and constitutes a powerful component of flow within the boundary currents, which can be twice as strong during austral autumn than other seasons (Armitage et al. 2018). The ACoC and ASF are found all around the coast of Antarctica. The ASF allows for the export of WSDW through the Weddell-Scotia Confluence, some of which continues westwards north of the Weddell Gyre (Heywood et al., 2004). The ACoC plays an important role in protecting the ice shelves surrounding Antarctica from direct contact with CDW, or in the Weddell Gyre, WDW. The amount of WDW that is able to cross the shelf break governs the amount of heat that is supplied to beneath the ice shelves.
Studies have shown that the wind, in combination with the seasonally varying thermocline depth, plays an important role in controlling the amount of WDW that reaches the shelves (Arthun et al., 2014; Zhou et al., 2014; Darelius et al., 2016).
However, the actual pathways of WDW under the ice shelves are still poorly understood (Meredith et al., 2016). A modelling study by Hellmer et al., (2012, 2017) suggests that thinning of sea-ice in the southwestern Weddell Gyre could induce changes to the ocean surface stress, resulting in a redirection of the coastal current into the Filchner Trough, bringing WDW into direct contact with the Filchner-Ronne ice shelf. This could result in a substantial increase in basal melting under the ice shelf, from the current average of 0.2 m/year, to over 4 m/year, potentially contributing to sea-level rise (Hellmer et al., 2012).
1.3.2
The role of wind and sea-ice on Weddell Gyre dynamics
In addition to driving the gyre-scale ocean circulation, the wind also drives spatial variability in sea-ice cover within the Weddell Gyre. The presence of sea-ice influences the underlying ocean in two main ways:
10 | P a g e
1. ―shielding‖ the ocean from the direct influence of the wind 2. contributing towards driving the freshwater budget.
The transport of sea-ice from the Antarctic coast northwards towards the ACC results in a freshwater conveyor belt, where sea-ice formation/brine rejection at the coast and sea- ice melt/freshwater input further north results in horizontal gradients in salinity, driving freshwater fluxes (Holland & Kwok, 2012). These freshwater fluxes influence seawater density and subsequently the stratification and circulation of the Southern Ocean (Abernathey et al., 2016). The katabatic winds play a role in driving sea-ice away from the continental shelf around Antarctica, driving/sustaining polynyas and leads (Zwally et al., 2013). Numerical model studies have linked meridional sea-ice transports with the strength of the lower branch of the Southern Ocean overturning circulation cell (Stoessel et al., 1998; Komuro & Hasumi, 2003). Other studies suggest that the sea-ice component of the freshwater budget contributes to Antarctic Intermediate Water formation (AAIW; Saenko et al., 2002), and that wind-driven sea-ice transport is tightly coupled to the upper branch of the overturning circulation cell (Abernathey et al., 2016).
Additionally, anomalies in the wind forcing entering over the Weddell gyre from the west, can lead to perturbations in sea-ice circulation, causing the accumulation of sea- ice in the south eastern part of the Weddell Gyre every 4-6 years, which is then circulated north-north-eastwards, joining the northern limb of the Weddell Gyre circulation (Venegas et al. 2001).
The wind has also been shown to control the export of WSDW (AABW) from the Weddell Gyre (Jullion et al., 2010). Decadal variability in AABW properties in the Scotia Sea has been linked to the baroclinic adjustment of the Weddell Gyre in response to changes in the wind stress field, where vertical variations in the density structure influences the export of AABW over the South Scotia Ridge (Jullion et al., 2010). The wind-controlled regulation of the export of AABW from the Weddell Gyre therefore has important implications on the long-term changes in AABW properties, where observed AABW warming (Coles et al., 1996; Zenk and Morozov, 2007; Meredith et al., 2008;
Johnson et al., 2008) has been attributed to changing density classes of AABW exported from the Weddell Gyre (Meredith et al., 2008). Indeed, a seasonal cycle in the export of AABW from the Weddell Gyre has been suggested by Gordon et al. (2010), based on 8 years of observations south of the South Orkney Islands. Gordon et al. (2010) found a pronounced seasonal cycle in bottom waters where a warm pulse occurred in May/June,
11 | P a g e followed by a cold pulse in October/November, which the authors suggest is due to seasonal changes in the wind-forcing over the Weddell Gyre. The wind-controlled export of AABW from the Weddell Gyre has, through correlation studies, been linked to large-scale climate phenomena; the two largest within the Southern Ocean region being the Southern Annular Mode (SAM) and the El Niño Southern Oscillation (ENSO) (Jullion et al., 2010). Jullion et al. (2010) suggests that the positive tendency of the SAM in recent decades has a causal link with the warming trends of AABW, and show that spatial variation of the correlation between AABW temperature and the SAM index exhibits a ―SAM-like‖ pattern in the Scotia Sea. A more recent study by Armitage et al.
(2018) highlights a correlation between sea-surface-height (SSH) variability in the Southern Ocean and SAM. Since the Weddell Gyre is largely barotropic, the SSH provides an indication of the Weddell Gyre circulation, where changes in the Weddell Gyre circulation is strongly linked to month-to-month variability in the local wind stress curl (Armitage et al., 2018).
Wind forcing variability induced by SAM and ENSO has also been linked to the volume of High Salinity Shelf Water (HSSW) that can be formed, and is able to exit the continental shelf, in a study based on mooring observations by McKee et al., (2011).
McKee et al. (2011) show that stronger winds push the sea ice away from the shelf edge, allowing for more sea ice and subsequently brine rejection to form on the continental shelf. This also links to the amount of AABW that is formed within the Weddell Gyre, since HSSW is a precursor to AABW formation (Foldvik et al., 2004).
Wind forcing is also important in the large-scale dynamics of the Weddell Gyre, owing to the open boundaries to the north and to the east. Fahrbach et al. (2011) show that the wind stress is not symmetric over the Weddell Gyre, i.e. the central axis of the Weddell Gyre circulation is centred over 60° S at the Prime Meridian, whereas the low air pressure system over the Weddell Gyre is centred at about 65° S. This means that the northern part of the westward flowing southern limb of the Weddell Gyre flows against the direction of the wind. Thus, when the easterly winds are strong, the southern limb of the gyre exhibits strong westward flow, and vice versa. When the westerly winds are weak, the eastward flowing northern limb of the Weddell Gyre is weak, and the northern part of the westward flowing southern limb is relatively strong. When the westerly winds are strong, the northern limb is also strong, but the northern part of the southern limb is weak, owing to its direction being against the direction of the wind
12 | P a g e
(Fig. 11 in Fahrbach et al. 2011). Owing to the open boundaries to the north and the east, the northern and southern limbs of the Weddell Gyre are unsynchronised, influencing the variability of the inflow of water masses into the southern limb from the east, and the outflow of water masses in the northern limb in the west (Fahrbach et al.
2011). The inflow controls how much heat is advected into the gyre, where it can potentially reach the Filchner-Ronne ice shelf cavities (Hellmer et al., 2012, 2017) and the outflow controls how much AABW is exported to the rest of the global ocean, resulting in the storage of heat in the extensive reservoir of the global abyss (Orsi et al., 1999; Johnson et al., 2008). Thus, the role of wind forcing in controlling the out-of- phase relationship of the Weddell Gyre circulation has important implications on the global ocean heat budget (Fahrbach et al., 2011).
1.3.3
Long-term changes in the Weddell Gyre
Like many other regions throughout the global ocean, the Weddell Gyre has been undergoing changes in recent decades. Large variability, sparsity of data, and a summer bias of data for a periodically sea-ice covered environment renders significant challenges in determining long-term trends due to anthropogenic forcing. Furthermore, the longest time-series exists for a section in a dynamically complex region, in close proximity to Maud Rise. Fahrbach et al., (2004) report significant levels of decadal variability in Weddell Gyre water masses, masking long-term trends. In a follow up paper, however, Fahrbach et al., (2011) shows that the mean temperature and salinity for the whole water column along the Prime Meridian displays a positive trend over 24 years, from 1996 to 2004. Despite this, long-term trends within the individual water masses are not clear in Fahrbach et al., (2011), and subject to significant variability.
WDW shows decadal variability in both temperature and salinity, with no clear long- term warming trends. WSDW displays a warming trend between 1984 and 2005, but is cooler again in 2007. After an initial cooling from 1984 to 1992, WSBW is more or less warming until 2003, after which, no obvious change occurs in temperature (whereas salinity appears to begin a freshening trend after a positive trend from 1998 to 2005).
The long-term temperature trends of the Weddell Gyre water masses are shown in Fig. 5 in Fahrbach et al., (2011). Fahrbach et al., (2011) suggest that the long-term trend of the whole water column may be the result of an accumulation of heat and salt that has been advected into the gyre during wind-driven ―warm pulse‖ events, which is then
13 | P a g e distributed into the deeper layers within the Weddell Gyre. The implications of this finding is that the Weddell Gyre plays a role in the Earth’s climate system by bringing atmospheric heat into the deep ocean (Fahrbach et al., 2011; Heywood & Stevens, 2007). Naveira Garabato et al., (2016) and Jullion et al., (2014) show, through inverse modelling, that the Weddell Gyre indeed contributes towards closing the southern limb of the global overturning circulation. Naveira Garabato et al., (2016) highlights the existence of two interlinked overturning cells within the Weddell Gyre, where the deep overturning cell results in cooling-driven densification of deep and bottom waters. This deep overturning cell leads to the export of both locally and externally sourced AABW (also see Meredith et al., 2000) from the Weddell Gyre. In contrast to the cooling-driven deep overturning cell within the Weddell Gyre, an upper overturning cell exists, driven by freshening, which results in an increase in the buoyancy of the upper ocean, converting WDW into lighter upper ocean waters (Naveira Garabato et al., 2016).
The WW layer, found above WDW within the upper overturning cell, also exhibits decadal variation, which cannot be attributed to variations in sea-ice formation and entrainment of the underlying WDW alone (Behrendt et al. 2011). Behrendt et al.
(2011) points out that the horizontal advection of both seawater and sea-ice also plays an important role in influencing WW variability. Thus, changing properties in WW might be expected to have occurred in the time period of 2016 onwards, due to the recent record-low in sea-ice cover in the Weddell Gyre in the Austral spring of 2016 (Turner et al. 2017). In November 2016, sea-ice loss in the Weddell Gyre was double the climatological change (Turner et al., 2017). Turner et al. (2017) show that the record sea-ice retreat coincided with record atmospheric circulation anomalies leading to northerly atmospheric flow in several regions throughout the Southern Ocean, indicating a role of wind-forcing in advecting sea-ice northwards out of the Weddell Gyre. They also speculate that ocean would have also played a role in sea-ice loss, while also acknowledging that this is difficult to quantify.
The most recent study of the temporal variability of water mass properties comes from Kerr et al. (2017), who analysed three decades of ship-based data collected within the Weddell Gyre, from 1984 to 2014. In fig. 5 of Kerr et al. (2017), WDW shows a warming from 1984 to 1996 along the Prime Meridian, and from 1988 to 1996 along the SR4 transect from Kapp Norvegia to Joineville Island. The WDW warming was followed by a cooling until 2011 along the SR4 transect, and a cooling until 2005 along
14 | P a g e
the Prime Meridian, after which a slight warming occurs up to 2014. Again, WDW exhibits strong decadal variability, and, if anything, suggests an overall cooling trend, at least after 1996. Long-term salinity trends in WDW are even less clear. However, the changes in temperature and salinity appear not to be density compensated, as neutral density suggests a lightening of WDW occurs along both transects until 1996-1998, after which, WDW undergoes some densification. The long-term trends in WSDW and WSBW are also exhibiting significant variability, though WSDW along section SR4 appears to be undergoing density-compensating increasing temperature and salinity.
After 1992, WSDW along the Prime Meridian shows a generalised positive trend in temperature and salinity, though somewhat masked by the variability. Along the Prime Meridian, from 1984 to 1992, WSBW temperature and salinity initially both decrease, causing a lightening of the WSBW layer, after which, there is warming and increasing salinity. With the exception of a spike between 1990 and 1998, caused by a drop in temperature and salinity, WSBW appears to be undergoing a shift towards lighter waters, which, Kerr et al. (2017) suggest, is due to less WSBW being formed over time.
This results in a reduction of WSBW volume observed until 2005, after which WSBW probably recovered. Kerr et al. (2017) also suggest that the increase in WSBW in the eastern Weddell Gyre, along the Prime Meridian, is likely driven by pulses of inflowing Dense Shelf Waters (DSW) and AABW sourced from the Indian sector of the Weddell Gyre. Regarding locally sourced WSBW, Kerr et al. (2017) show that WSBW is primarily composed of 71 ± 4 % modified WDW (mWDW), and 29 ± 4 % DSW, again highlighting the importance of WDW in transporting heat into the deeper layers of the Weddell Gyre (Fahrbach et al., 2011).
1.4 Research questions and project aim
While WSBW in the interior of the Weddell Gyre has been generally warming (Kerr et al., 2017, Fahrbach et al., 2011), the main source of locally formed WSBW, WDW, shows high decadal variability and no distinct long-term change. Furthermore, AABW throughout the global ocean has been displaying clear warming signals (Schmidtko et al., 2014; Purkey & Johnson, 2013; Meredith et al., 2011; Zenk et al., 2007; Kawano et al., 2006). To understand the role of the Weddell Gyre in the Earth’s climate system, it is paramount to understand how heat might be distributed throughout the Weddell Gyre. Fahrbach et al. (2011) suggest that ―warm pulse‖ events lead to an