LETTER • OPEN ACCESS
High potential for loss of permafrost landforms in a changing climate
To cite this article: Olli Karjalainen et al 2020 Environ. Res. Lett. 15 104065
View the article online for updates and enhancements.
This content was downloaded from IP address 79.140.121.164 on 13/10/2020 at 17:01
Environmental Research Letters
OPEN ACCESS
RECEIVED
20 April 2020
REVISED
12 August 2020
ACCEPTED FOR PUBLICATION
17 August 2020
PUBLISHED
2 October 2020
Original content from this work may be used under the terms of the Creative Commons Attribution 4.0 licence.
Any further distribution of this work must maintain attribution to the author(s) and the title of the work, journal citation and DOI.
LETTER
High potential for loss of permafrost landforms in a changing climate
Olli Karjalainen1, Miska Luoto2, Juha Aalto2,3, Bernd Etzelmüller4, Guido Grosse5,6, Benjamin M Jones7, Karianne S Lilleøren4and Jan Hjort1
1 Geography Research Unit, University of Oulu, P.O. Box 3000, Oulu 90014, Finland
2 Department of Geosciences and Geography, University of Helsinki, P.O. Box 64, Helsinki 00014, Finland 3 Finnish Meteorological Institute, P.O. Box 503, Helsinki 00101, Finland
4 Department of Geosciences, University of Oslo, P.O. Box 1047, Oslo 0316, Norway
5 Alfred Wegener Institute, Helmholtz Centre for Polar and Marine Research, Potsdam 14773, Germany 6 University of Potsdam, Institute of Geosciences, Potsdam 14776, Germany
7 Institute of Northern Engineering, University of Alaska Fairbanks, P.O. Box 755860, Alaska, 99775, Fairbanks, United States of America E-mail:olli.karjalainen@oulu.fi
Keywords:permafrost, climate change, ground ice, environmental change, environmental space, geodiversity, statistical ensemble modelling
Supplementary material for this article is availableonline
Abstract
The presence of ground ice in Arctic soils exerts a major effect on permafrost hydrology and ecology, and factors prominently into geomorphic landform development. As most ground ice has accumulated in near-surface permafrost, it is sensitive to variations in atmospheric conditions.
Typical and regionally widespread permafrost landforms such as pingos, ice-wedge polygons, and rock glaciers are closely tied to ground ice. However, under ongoing climate change, suitable environmental spaces for preserving landforms associated with ice-rich permafrost may be rapidly disappearing. We deploy a statistical ensemble approach to model, for the first time, the current and potential future environmental conditions of three typical permafrost landforms, pingos, ice-wedge polygons and rock glaciers across the Northern Hemisphere. We show that by
midcentury, the landforms are projected to lose more than one-fifth of their suitable environments under a moderate climate scenario (RCP4.5) and on average around one-third under a very high baseline emission scenario (RCP8.5), even when projected new suitable areas for occurrence are considered. By 2061–2080, on average more than 50% of the recent suitable conditions can be lost (RCP8.5). In the case of pingos and ice-wedge polygons, geographical changes are mainly
attributed to alterations in thawing-season precipitation and air temperatures. Rock glaciers show air temperature-induced regional changes in suitable conditions strongly constrained by
topography and soil properties. The predicted losses could have important implications for Arctic hydrology, geo- and biodiversity, and to the global climate system through changes in
biogeochemical cycles governed by the geomorphology of permafrost landscapes. Moreover, our projections provide insights into the circumpolar distribution of various ground ice types and help inventory permafrost landforms in unmapped regions.
1. Introduction
The presence of ground ice in the surface layers of permafrost is central to the geomorphic and hydro- ecological functioning of high-latitude and altitude permafrost landscapes (Rowland et al 2010, Kokelj et al2014, Liljedahlet al2016). Involved geomorphic processes give rise to permafrost landforms, such as
ice-cored pingo mounds (Mackay1988), ice wedges that form distinctive polygonal patterned ground (Washburn 1980), and slowly creeping rock gla- ciers in mountains (Barsch1996). Ice-rich permafrost landforms are responsive to climatic perturbations as indicated by the intensified permafrost degradation during the past decades (Liljedahl et al 2016, Far- quharson et al 2019). Relict permafrost landforms
found in temperate climates (e.g. pingo remnants and ice-wedge casts in western and central Europe (Vandenberghe and Pissart1993) imply that distri- butions of permafrost landforms have changed before and are likely to change in future climates (Washburn 1980, Grosse and Jones2011, Liljedahlet al2016).
Projected increases in air temperatures and precipitation with Arctic amplification (Hoegh- Guldberget al2018) are anticipated to intensify per- mafrost warming (Biskaborn et al 2019) and asso- ciated thermokarst processes, i.e. thawing and set- tling of ice-rich permafrost (Jorgenson et al 2006, Grosse et al2016, Douglaset al 2020). Landscapes with current thermokarst features or susceptibility to future thermokarst are estimated to cover up to 20% of circumpolar permafrost regions (Olefeldt et al2016). Rising air and ground temperatures pose a potential constraint for pingo persistence across northern Siberia (Grosse and Jones 2011), Alaska (Joneset al2012), and Canada (Mackay 1988), for example. Degradation of ice-wedge polygons has been observed across the Arctic, including continu- ous permafrost regions (Jorgensonet al2006,2015, Grosse et al 2016, Liljedahl et al 2016, Steedman et al2017, Fraseret al2018, Farquharsonet al2019).
Moreover, downslope creeping of rock glaciers due to ground ice deformation has shown increased sur- face velocities related to increased air temperatures in some regions (K¨a¨abet al2007, Joneset al2019). The degradation of ground ice in permafrost landforms can induce thermokarst or mass-movement hazards (K¨a¨abet al2007) and thereby threaten infrastructure development (Rowland et al 2010, Kanevskiyet al 2017, Hjortet al2018, Streletskiyet al2019).
Permafrost landforms bear local-scale geo- morphic (Humlum 2000, Knight et al 2019, Ward Joneset al2019), hydrological (Liljedahlet al2016, Brighenti et al 2019, Nitzbon et al 2019) and bio- logical (Laraet al2018) significance, but also affect global systems through alterations in atmospheric (Schuuret al2015) and aquatic (Serikovaet al2018) greenhouse gas fluxes from permafrost regions. These landforms also contribute to local biodiversity (Jor- genson et al 2006) by serving as highly specialized ecosystems for flora (Jorgensonet al2015) and fauna (Fountain et al 2012). In some regions they also provide a freshwater supply for human use (Jones et al2018).
At present, the information on current and poten- tial future distributions of permafrost landforms at the circumpolar scale is sparse. This is despite an increasing amount of circumpolar to global perma- frost extent simulations conducted both with process- based (e.g. Guo and Wang2016) and empirical/stat- istical approaches (Chadburnet al2017, Aaltoet al 2018, Obuet al2019). The lack of spatially detailed knowledge on geomorphic features poses a limita- tion to the assessments of climate change impacts on permafrost environments. We aim to reduce these
knowledge gaps by applying statistical distribution modelling. Statistical modelling methods have been used in geomorphological contexts (Luotoet al2010, Aaltoet al2014, Rudyet al2017, Fewsteret al2020).
In our previous work (Aalto et al 2018), we have demonstrated that a statistical approach produces similar permafrost extents with process-based mod- els (e.g. Guo and Wang2016) and other empirical models (Chadburnet al2017, Obuet al2019), and have relatively small prediction errors. The advant- age of the approach over physically based models which require extensive parameterization of physical soil properties, for example, is that statistical mod- elling allows for predicting landform occurrence at high spatial resolution across the circumpolar region using readily available geospatial data on climate, soil and topography. Thus, our approach does not con- sider various processes affecting heat fluxes or ground ice accumulation in permafrost but is suitable for examining how different environmental factors affect the distribution of permafrost landforms across the circumpolar region.
Our objective is to model, for the first time, the potential environmental spaces for the occur- rence of pingos, ice-wedge polygons and rock gla- ciers across the Northern Hemisphere. These spaces encompass conditions where climate, topography and soil properties are suitable for landform presence.
In the modelling we assumed the landforms to be in equilibrium with climate conditions for the con- sidered period, that is, we did not make assump- tions concerning whether the landforms are degrad- ing or still growing. Based on the statistical model- ling results, we present the circumpolar coverages of potential environmental spaces for the studied land- forms during a recent period (1950–2000) and predict their regional changes for two future periods (2041–
2060 and 2061–2080) using representative concen- tration pathway RCP4.5 (stabilization scenario) and RCP8.5 (rising radiative forcing pathway) climate- change scenarios. Moreover, the results offer insights into the fine-scale distribution of various ground ice types and help inventory permafrost landforms in unmapped regions.
2. Materials and methods
2.1. Permafrost landform observations
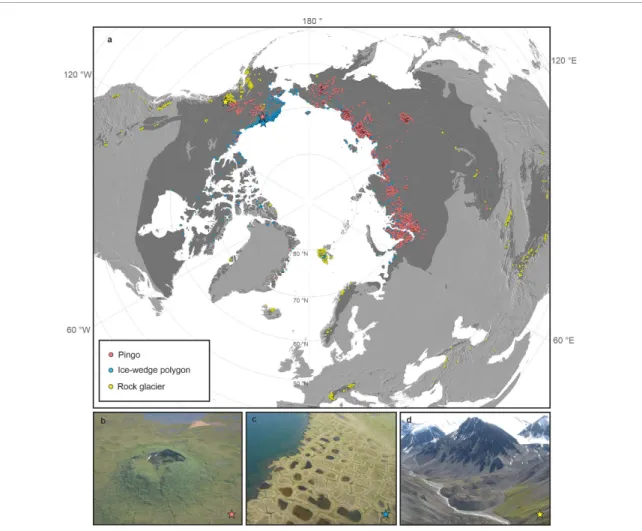
Observations of pingos, ice-wedge polygons and rock glaciers across the Northern Hemi- sphere (i.e. presence data, figure 1(a)) made since late 20th century were compiled from available inventories, published studies and geomorpho- logical maps (see section S1 (available online at stacks.iop.org/ERL/15/104065/mmedia) in supple- mentary material). Ice-cored pingo mounds (figure 1(b)) form in permafrost environments by injec- tion and freezing of pressurized water in the soil, and results in massive-ice formation and upheaving
of overlying surface material (Mackay 1988). Two primary pingo types are often distinguished: hydro- static, predominantly occurring in low-lying con- tinuous permafrost regions, and hydraulic, which are more typical to discontinuous permafrost and depend on water moving under a hydraulic gradi- ent (Mackay1988, Grosse and Jones2011, Joneset al 2012). Distinct patterned ground features, ice-wedge polygons (figure1(c)), occur nearly ubiquitously in unconsolidated deposits across the Northern Hemi- sphere permafrost domain and wedge ice is the most common form of ground ice in continuous perma- frost (Bernard-Grand’Maison and Pollard2018). The polygon shape results from the cyclical growth of ice wedges in thermal contraction cracks formed in sus- ceptible soils during cold spells in wintertime (Wash- burn1980, Kokeljet al2014).
Rock glaciers are bodies of poorly sorted debris and ice that move due to deformation of internal ice (Barsch1996, Berthling2011, figure1(d)) in per- mafrost environments. They occupy most moun- tain regions in both continental and maritime cli- mates including high-Arctic conditions (Evans1993) and high elevations in warmer climates in, e.g. the Middle East (Gorbunov 2013). We included both active (flowing or creeping downward) and inact- ive (stagnant) rock glaciers that contain ice (Barsch 1996) regardless of whether they were primarily influ- enced by talus slope dynamics or by glacier dynam- ics (moraine-derived rock glaciers) (see section S1, supplementary material) but excluded relict land- forms. In addition to presence data, the applied mod- elling required information on environments where the landforms are not present. Thus, we compiled datasets with 1349 absence grid cells for pingos, 494 for ice-wedge polygons and 1549 for rock glaciers (section S1, supplementary material).
2.2. Environmental data
In general, the formation of ground ice and associated landforms require permafrost conditions with effi- cient wintertime freezing and reasonably cool sum- mers (Washburn 1980, Mackay 1988). Moreover, rainfall, topography, and properties of snow, veget- ation and soil layers affect ground ice accumulation and preservation potential in the landforms (Barsch 1996, Boeckliet al2012, Bernard-Grand’Maison and Pollard2018, Knightet al2019, Douglaset al2020).
We used geospatial data on physically relevant factors (climate, soil and topography predictors) at 30 arc- second (~1 km) spatial resolution to examine their effects on landform occurrence.
To account for the assumed seasonal effects of climate we computed freezing and thawing degree- days (FDD and TDD,◦C-days) and amounts of solid (Snowfall, mm) and liquid (Rainfall, mm) precipita- tion. Snowfall was defined as the sum of precipitation
for months with average air temperature below 0◦C, and rainfall for those above 0 ◦C. The variables were computed separately for each considered time period and climate scenario using interpolated cli- mate surfaces from the WorldClim database (Hij- mans et al 2005). The database includes monthly air temperature averages and precipitation sums for the baseline period 1950–2000 (note that the major- ity of the permafrost landform observations were from this period) and for two future periods (2041–
2060 and 2061–2080), for which we used RCP4.5 and RCP8.5 radiative forcing scenarios (van Vuuren et al 2011). Future climate projections included in the WorldClim database (Hijmanset al2005) derive from an ensemble of 18 global climate models in the Coupled Model Intercomparison Project phase 5 archive (Tayloret al2012).
The GMTED2010 digital elevation model (Danielson and Gesch 2011) at 30 arc-second spa- tial resolution (~1 km) was employed to compute the topography predictors, which were used to rep- resent the amount of incoming solar energy, and the transport of ground material and moisture across the landscape. Potential incident solar radiation (Mccune and Keon2002) (PISR, MJ cm−2a−1) was computed using slope, aspect and latitude, of which slope angle (Slope,◦) was used also as an independent predictor in the modelling. PISR was omitted from pingo and ice-wedge polygon modelling, because in flat areas it is argued to reflect the latitudinal gradient rather than local topography-mediated insolation condi- tions (Karjalainenet al 2019). Topographic wetness index (TWI) was computed in SAGA GIS (System for Automated Geoscientific Analyses, Conradet al 2015) with the SAGA Wetness Index tool (Böhner and Selige2006), all the other predictors in ArcGIS 10.5.
Averaged proportions of coarse sediments (Coarse, grain size > 2 mm) and fine sediments (Fine, [sum of clay and silt] < 50µm) as well as the con- tent of soil organic carbon (SOC, g kg−1) within 2 m from the surface were derived from the Soil- Grids database (Henglet al2017). These factors were assumed to characterize the varying hydro-thermal conditions of permafrost soils. Finally, we determ- ined water coverage (%) in the 30 arc-second grid cells using a 150 m resolution dataset on water bod- ies (Defourny2016) to account for the proportion of thawed ground (lakes and taliks) in each grid cell.
There also exist site-specific factors that we could not directly consider with geospatial data at a circum- polar extent. Pingo and ice-wedge polygon forma- tion depends on groundwater flow, and the thickness and water flow permeability soil deposits (Joneset al 2012), while debris availability, lithology and melt- water dynamics are central for rock glaciers (Lilleøren and Etzelmüller2011, Knightet al2019).
Figure 1.Compiled occurrences of pingos, ice-wedge polygons and rock glaciers across the Northern Hemisphere permafrost domain. Symbols indicate pingo (N=9709), ice-wedge polygon (N=861) and rock glacier (N=4035) presence in a 30 arc-second grid cell (a). The shaded area depicts the circumpolar permafrost region (Brownet al2002). Field photos showing a pingo near Umiat, Alaska (b), ice-wedge polygons on the Colville River delta, Alaska (c) and a rock glacier reaching valley bottom near Kluane Lake in Yukon, Canada (d). Photo credits: Benjamin M. Jones (b), (c) and Bernd Etzelmüller (d).
2.3. Statistical modelling
We modelled the suitable environmental spaces for landform occurrence and factors affecting their dis- tribution by relating the compiled observations of landform presence and absence to environmental conditions using multivariate statistical methods. We used four methods and model-averaging techniques (Aaltoet al 2017) to reduce the prediction uncer- tainty related to the choice of a single modelling method (Thuilleret al2009). Generalized linear mod- elling (GLM), generalized additive modelling (GAM), generalized boosting modelling (GBM) and random forest (RF), were implemented within BIOMOD2 environment (Thuilleret al2009) in R (version 3.5.2, see model calibration details in section 2, supple- mentary material). Model evaluation was performed using 100-fold cross validation that at each run used a random sample of 70% of observations in the data- sets to calibrate a model and to validate it with the remaining 30%. Model performance was evaluated at each round with the adjusted coefficient of determ- ination (R2) and two prevalence-independent statist- ical measures of classification accuracy; area under
the receiving operating characteristic curve (AUC) and true skill statistic (TSS, Allouche et al 2006).
Ensemble predictions were then formed by using the committee-averaging algorithm (Thuilleret al2009, section 2, supplementary material). We evaluated the spatial reliability of the predictions by mapping the modelling agreement between the four methods (Luotoet al2010).
To examine the environmental controls and sens- itivities of permafrost landforms we estimated a modelling technique-independent variable import- ance score for each predictor (Thuilleret al2009), and created response curves with each of the four meth- ods to examine the shapes of relationships between each landform and predictors (Elithet al2005) using response.plot2 function in BIOMOD2 environment (Thuilleret al2009).
Projections for 2041–2060 and 2061–2080 were performed by substituting the climate parameters in the calibrated models with respective climate change scenario-based predictors (Hijmanset al2005). Other predictors were not modified (Aaltoet al2017,2018) but used as they were in the baseline modelling
in order to constrain suitable topography, surficial deposits and drainage conditions for landform occur- rence in changing climatic conditions. These factors were considered to remain relatively unchanged within the study period, while vegetation properties that affect permafrost-climate responses (Shur and Jorgenson2007) were assumed to change unpredict- ably, and thus not accounted for. Finally, areal cover- ages of projected environmental spaces were clipped and computed inside a recent permafrost zonation (Obu et al 2019). This delineation considers isol- ated permafrost areas in higher detail than the Inter- national Permafrost Association map (Brownet al 2002).
3. Results
Based on the predicted environmental spaces for current and future time periods, we classify three pathways of suitability for landform occurrence; 1) persisting conditions with suitable topographic and soil conditions for landform occurrence and climate remaining favourable, 2) environmental space loss, in which climatic conditions become unsuitable, and 3) new environmental spaces with potential for occur- rences outside current distribution (i.e. suitable topo- graphy, soil and newly formed climatic conditions).
Finally, we examine the factors affecting landform occurrence and evaluate the reliability of the predic- tions.
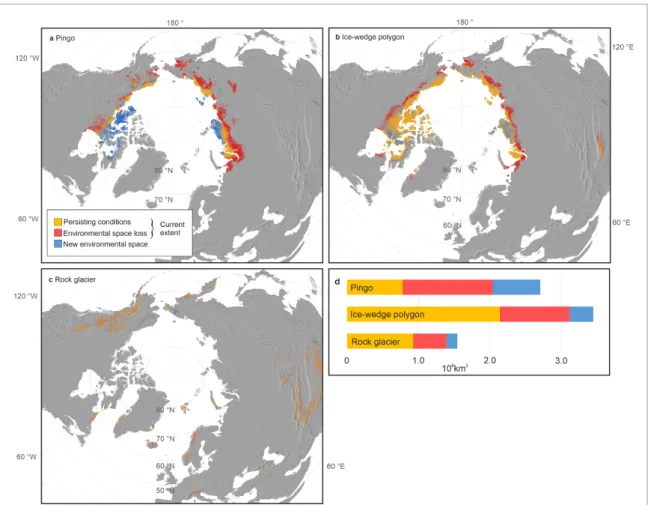
3.1. Regional changes in environmental spaces Based on ensemble modelling, the predicted cur- rent coverage of environmentally suitable spaces is 2.04 × 10⁶ km2 for pingos, 3.12 × 10⁶ km2 for ice-wedge polygons and 1.40 × 10⁶ km2 for rock glaciers (figure2, union of orange and red zones).
Under the moderate 2041–2060 climate-forcing scen- ario (RCP4.5), the total areas of potential environ- mental spaces for the studied permafrost landforms are predicted to reduce to 1.44×10⁶km2(by 29%), 2.47×10⁶km2 (21%) and 1.08×10⁶ km2 (23%), respectively (figure 2, supplementary tables 2 and 3). By 2061–2080, assuming the RCP8.5 scenario, on average over 50% of recent environmental spaces may be lost.
The largest losses of environmental spaces for pingos and ice-wedge polygons are concentrated on northwestern Russia and the middle reaches of major Arctic rivers (figures2(a) and (b)). In the zone of dis- continuous permafrost, suitable conditions for rock glacier occurrence show a distinctive shift towards higher elevations. As a result, areal losses are projected in most areas of current occurrences (figure2(c)). In continuous permafrost regions, the projected losses are generally small.
New environmental spaces are projected to emerge where air temperatures and precipitation attain suitable levels for occurrence and other factors
are favourable. For pingos and ice-wedge poly- gons, new suitable areas (circumpolar totals of 0.67 and 0.33× 10⁶ km2) predominantly situate across Canada’s Arctic Archipelago and in the Taymyr Pen- insula (figures 2(a) and (b)). Pingo environments show a poleward shift, while suitable conditions for ice-wedge polygons are predicted in diverse land- scapes amidst the recent occurrences. However, suit- ability for recent pingos, also, is predicted in many locations on Canadas’s Arctic islands even though not visible in the small-scale map (figure2(a)). The largest areal increases in potentially suitable condi- tions for rock glacier occurrence (0.15×10⁶ km2) appear in northern Alaska, high-Arctic Canada, east- ern Greenland and Far-Eastern Russia (figure2(c)).
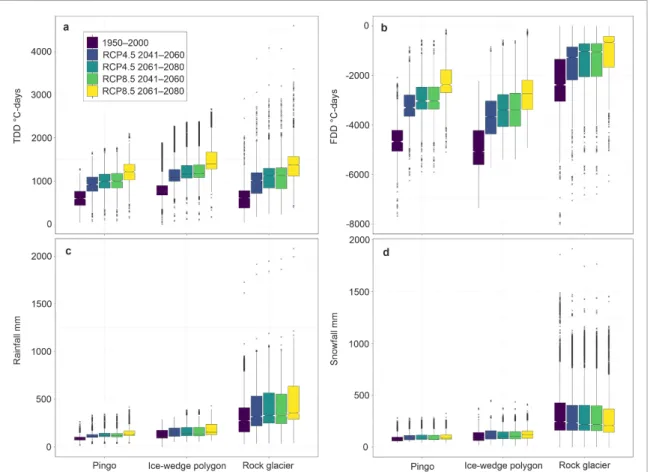
The general trajectory of the changes is towards colder regions of continuous permafrost. Based on the climate-change scenarios, both air temperature and rainfall show distinct increases at grid cells with observed landform occurrences (figure3). Snowfall is projected to decrease at rock glacier sites, in contrast to the increase in rainfall (figures3(c) and (d)).
3.2. Climatic controls and sensitivity of permafrost landforms
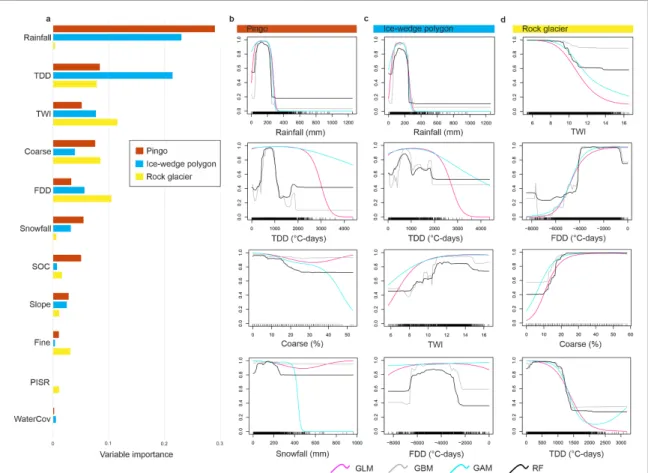
According to the analyses of variable importance and response shapes, the optimal conditions for pin- gos and ice-wedge polygons at a circumpolar scale are similar (figures 4(a)–(c), supplementary figure 3) and characterized by flat topography with mod- erately high soil moisture, low rain- and snowfall (<~300 mm), and TDD (◦C-days) of less than ~2000.
For ice-wedge polygons, FDD also have a notable con- tribution indicating that their occurrence requires at least ~2500◦C-days. Notably, figure 3suggests that FDD will drop below 2000 at many pingo and ice- wedge polygon sites regardless of the climate-change scenario.
Rock glacier occurrence increased on coarse- sediment slopes with low wetness index, TDD less than ~1200◦C-days, and FDD between ~1000 and 4500◦C-days (figure4(d)). Increased probability of occurrence towards minimum FDD values in the dataset suggests that rock glaciers exist across a wide range of cold climates although most landforms in the dataset have relatively high FDD values (figure 3(b)). Each landform shows a clear decline in prob- ability of occurrence when TDD exceeds ~1000◦C- days (figures4(b)–(d)). The response of rock glaciers to increasing TDD is especially sharp. An even more abrupt threshold is found between rainfall and both pingos and ice-wedge polygons.
3.3. Statistical and spatial evaluations
To assess model fit and predictive performance we used a split-sample approach; the models were calib- rated using 70% of the data and evaluated against the remaining 30% of observations. Based on 100-fold
Figure 2.Predicted changes in potential environmental spaces of the studied landforms across the Northern Hemisphere permafrost domain. Potential environmental spaces are depicted for pingos (a), ice-wedge polygons (b) and rock glaciers (c) in 2041–2060 under a moderate representative concentration pathway (RCP4.5) climate-change scenario. Bars (d) depict the predicted areas of persisting conditions for landform occurrence as well as potential lost and new environmental spaces in the given scenario. The remaining scenarios are presented in the supplementary material as follows: RCP4.5 for 2061–2080 (supplementary figure 5), RCP8.5 for 2041–2060 (supplementary figure 6) and 2061–2080 (supplementary figure 7).
cross-validation, our approach predicted well the per- mafrost landform occurrences (figure5). Ensemble method yielded the highest classification accuracy (AUC and TSS) in all cases and thus superior per- formance. Rock glacier models had the highestR2, AUC and TSS values, yet respective ensemble aver- ages in pingo and ice-wedge polygon models also indicated excellent predictive performance. Moder- ate between-model variability was observed. GBM and RF best explained the variation in each land- form occurrence havingR2 values at or above 0.90 (figure5).
In key regions of landform distribution, the mod- els largely agreed (figure6). High inter-model vari- ability was encountered in poorly sampled regions, such as the Tibetan Plateau where GLM and GAM predicted notably larger ice-wedge polygon dis- tributions than GBM and RF, which both yiel- ded more constrained environmental spaces (fig- ure 6(d)). The lower evaluation statistics of GLM and GAM in pingo modelling (figure 5(a)) may explain the model disagreement in many regions (fig- ure6(a)). In cases like these, the ensemble method facilitates controlling for prediction uncertainty by
allowing for a conservative model agreement-based assessment. Despite superior model performance, ensemble models failed to identify a few known regions for observed occurrence. For example, only GBM and RF predicted pingo occurrence potential in Svalbard and eastern Greenland (figure 6(a)).
Evaluations of spatial uncertainty such as presen- ted here help identifying regions and environmental conditions where additional investigations should be made and thereby improve future model performance.
4. Discussion
The predicted losses of environmental spaces are largely associated with regions of projected near- surface permafrost thaw in the near future due to warming climate (e.g. Slater and Lawrence 2013, Chadburnet al 2017), but not exclusively, as areas of continuous permafrost in, e.g. northern Siberia may also become unsuitable for pingos and ice-wedge polygons. Based on our analyses, the environmental suitability for these landforms will be foremostly constrained by increasing TDD and rainfall. These
Figure 3.Changing climatic conditions at the sites of observed permafrost landforms. The graphs show the distribution of thawing degree-days (TDD) (a), freezing degree-days (FDD) (b), rainfall (c) and snowfall (d) at the observation sites of each studied landform under representative concentration pathways RCP4.5 and RCP8.5 and for two periods; 2041–2060 and 2061–2080. Box margins depict the first and third quartiles of respective values with black line placed at median. Notches show confidence intervals around the median. Outliers (>1.5 times the inter-quartile range away from the quartiles) are indicated with cross markers.
findings suggest that warmer and wetter summers, and the projected thickening of the active layer (Aalto et al 2018, Peng et al 2018) can melt pingo ice (Grosse and Jones 2011) and ice wedges close to the ground surface in these regions, as observed elsewhere in the Arctic (e.g. Fortier et al 2007, Liljedahlet al2016, Bernard-Grand’Maison and Pol- lard2018, Farquharsonet al2019). First studies con- sidering thermokarst-inducing processes in a numer- ical model indeed project substantial surface perma- frost degradation and widespread landscape collapse even for the currently still cold North-East Siberian permafrost region under a strongly warming climate scenario (RCP8.5) (Nitzbon et al 2020), which is largely in line with our findings. Alongside increasing air temperatures, increased rainfall has been shown to stimulate permafrost thaw (Douglaset al2020).
Importantly, predicted losses do not imply com- plete thaw of permafrost at depth but rather that the permafrost landforms can be lost due to conditions becoming unfavourable for their occurrence. How- ever, ground ice in the landforms can be still pro- tected from thaw by ecosystem properties, such as insulation by thick layers of peat (Shur and Jorgen- son 2007) or cooling effect of cold air circulation in blocky rock glacier surfaces (Jones et al 2019).
Local hydro-topographical and ecological properties can also determine whether prolonged degradation leads to drainage or wetting of landscape, and thus the potential release of greenhouse gases (Jorgen- son et al 2015, Liljedahl et al 2016, Nitzbon et al 2020).
Rainfall was the most important single vari- able delineating suitable conditions for pingos and ice-wedge polygons at the circumpolar scale, while TWI and FDD foremostly affected rock glacier occur- rence potential. Even though these were central factors, the results implied that local topography and soil properties hold notable roles in constraining finer scale environmental suitability for the landforms.
Based on the findings, it is suggested that increases in the amount of rainfall to above ~200 mm (figures 4(b) and (c)) can severely limit pingo and ice-wedge polygon occurrence potential. In the case of ice-wedge polygons, TDD had nearly as an important of a con- tribution suggesting that air temperature is the central factor for their occurrence. Pingos also showed a sec- ondary relation to TDD yet rainfall was more domin- ant in their case.
The effect of rainfall is due arguably to the increased conduction of heat into the ground (Jor- genson et al 2006, Iijima et al 2010) but also the
Figure 4.The relative importance of environmental factors for the studied landforms and response curves for the key predictors.
Variable importance scores for individual environmental predictors based on average over four models (results from generalized linear model (GLM), generalized boosting method (GBM), generalized additive model (GAM), and random forest (RF)) are presented for pingos, ice-wedge polygons and rock glaciers (a). Response curves show the fitted response shapes of four most important predictors with pingos (b), ice-wedge polygons (c) and rock glaciers (d), i.e. when other predictors are held constant at their mean value (Elithet al2005). The response curves for the remaining predictors are presented in supplementary Figure 3.
Abbreviated predictors are thawing- and freezing degree-days (TDD and FDD,◦C-days), topographic wetness index (TWI), soil organic carbon content (SOC, g kg−1), coarse and fine sediment proportions (Coarse and Fine, %), slope angle (Slope,◦), coverage of water bodies (WaterCov, %), and potential incident solar radiation (PISR, MJ cm−2a−1).
Figure 5.Statistical evaluation metrics by modelling technique. The averages of true skill statistic (TSS) and area under the receiving operating characteristic curve (AUC) values with one standard deviation (whiskers) based on 100-fold cross validation are shown for pingos (a), ice-wedge polygons (b) and rock glaciers (c). The denoted modelling techniques are generalized linear models (GLM), generalized boosting method (GBM), generalized additive models (GAM), random forest (RF) and
committee-averaging-based ensemble of the former. Also displayed are model-wise adjusted coefficient of determination (R2) values for each permafrost landform.
introduction of advective heat (Kane et al 2001).
Rainfall also has been shown to induce abrupt thaw processes in ice-rich permafrost terrain (Kokeljet al 2015). Owing to the nonlinear response shape, the
found effect also applies the other way; suitable condi- tions can emerge if currently very dry areas begin to receive higher rainfall (>~100 mm, figures4(b) and (c)) in the future, provided that air temperature and
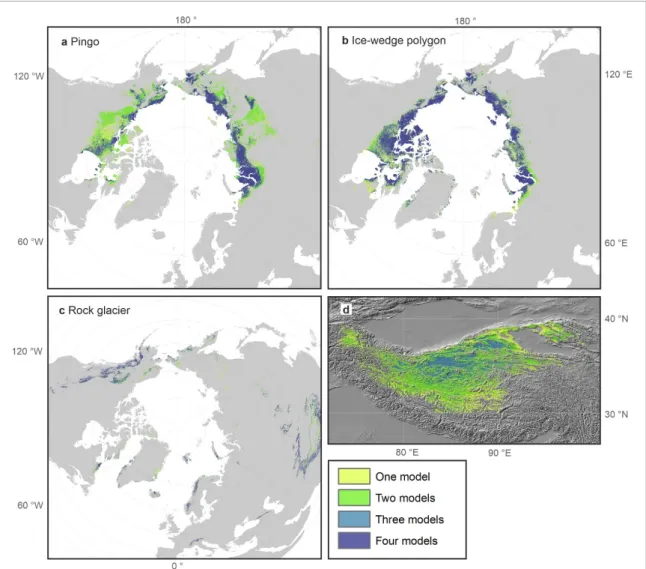
Figure 6.Inter-model variability in predicted potential environmental spaces for permafrost landform occurrence in 1950–2000.
Graded colours indicate the level of model agreement from low (yellow, one model predicts occurrence) to high (blue, all four models predict occurrence) in pingo (a), ice-wedge polygon (b) and rock glacier modelling (c). Predicted environmental spaces for ice-wedge polygons in the Tibetan Plateau are depicted in panel d.
other conditions are suitable. Some of rainfall’s con- tribution could be attributed to its moderately strong correlation with TDD in the modelling data (sup- plementary figure 4). Notwithstanding, the analysis of variable importance suggested that rainfall had a greater relative effect than TDD, especially for pingos (figure4(a)).
The responses of pingos and ice-wedge polygons with rainfall, and rock glaciers with air temperature, were strong and supported by each method. The projections of future climate, however, include uncer- tainty, especially in mountainous areas (Hijmanset al 2005, Hoegh-Guldberg et al 2018). The interpol- ated climate surfaces cannot fully account for oro- graphic precipitation patterns or wind-induced snow transport, for example. Ice-wedge polygons’ response to snowfall indicated a lowered occurrence prob- ability with increasing snowfall (supplementary fig- ure 3) in line with the observations by Kokeljet al (2014). However, climatic predictors averaged over a series of decades cannot represent future dynamics
of snow depth-controlled frost cracking under win- tertime cold spells or other extreme air temperature, precipitation or disturbance (i.e. fire) events, which play a role in the formation and degradation of espe- cially ice-wedge polygons (Jorgensonet al2006, Jones et al2015, Liljedahlet al2016, Kanevskiyet al2017).
Based on experimental evidence (Allard and Kasper 1998, Christiansen2005), thermal contraction crack- ing occurs during prolonged cooling periods with ground temperatures below−20 to−15◦C. In this study, the moderate importance of FDD and snow- fall for ice-wedge polygons suggests that higher tem- poral resolution of climate predictors (monthly to sub-monthly) and a more explicit representation of snow cover variation are needed to estimate thermal cracking potential.
Recent studies show that ice-wedge polygons formed in centennial to millennial time scales can be lost by melting of their uppermost portion in a few decades (Jorgenson et al 2006, Liljedahl et al 2016, Fraser et al 2018, Farquharson et al 2019).
Large pingos with thick insulating overburdens are to a degree resilient to short-term changes in cli- mate (Mackay1998), but evidence of collapsed and paleo-pingos in concurrent non-permafrost environ- ments confirms their climate sensitivity over longer time scales (Vandenberghe and Pissart1993, Jones et al 2012). Degradation of ice-wedge polygons at local scales demonstrates large spatial variation owing to complex interactions between, e.g. ground ice, wetness conditions and microtopography (Kanevskiy et al2017, Steedmanet al2017, Fraseret al2018, Nitz- bonet al 2019,2020). Notwithstanding, some have argued that future thermokarst rates at broader scales mainly depend on the magnitude of regional climate change (Olefeldtet al 2016). Degradation of any of the studied permafrost landforms can also occur due to their natural lifecycles without external forcing (Washburn1980, Mackay1988).
Few quantitative or spatial estimates exist to compare with the predicted coverages. Mackay (1972) estimated that ice-wedge polygons covered 2.6×10⁶km2 of the Northern Hemisphere, which falls relatively close to our ensemble prediction for 1950–2000 (3.1×10⁶km2). On a regional level, our ice-wedge polygon predictions for the main occur- rence areas are in line with a recent Canada-wide modelling of wedge-ice content (O’Neillet al2019), yet regional discrepancies are visible (section S3, sup- plementary material).
The discrepancies between the models (figures 4 and 5) are argued to have stemmed from dif- ferent initial model assumptions and parameteriza- tions (Thuilleret al2009). For example, only GBM and RF captured a decline in rock glacier occurrence probability when FDD approached zero, i.e. milder freezing-season conditions (figure4(d)). GLM and GAM overlooked this threshold and extended to too warm and flat areas, such as periglacial environments more characteristically affected by extensive solifluc- tion processes, e.g. in northern Scandinavia (Aalto et al2017). The wide distribution may also have been partly attributed to the inclusion of moraine-derived rock glaciers (section 1, supplementary material) which are easily mixed with debris-covered glaciers, and thus may extend below lower permafrost bound- ary limits. Moreover, some of the compiled observa- tions might have been relict rock glaciers, and thus possibly lacked permafrost, as suggested by relatively high TDD and FDD for many objects in the dataset (figures3(a) and (b)). The discrimination of intact rock glaciers from these landforms is often challen- ging, especially from optical remote sensing data from which a large part of observations was mapped.
Considering the projected new regions with suit- able environmental spaces for landforms, we argue that the dependency of landform growth on local geo- morphic and hydrologic conditions and glacial his- tory means that they are likely to occur in more con- strained environments than estimated in this study.
Prediction of pingo formation potential, for example, is difficult owing to its dependency on special ground- water pressure conditions (governed by underlying substrate properties) and dynamic processes such as lake drainage (Mackay 1998). Here, coarse sed- iments showed moderate importance and realistic response shapes with the landforms. Due to relatively few observations of soil properties within the perma- frost domain available to produce the soil data lay- ers (Henglet al2017), the data used here likely have a limited ability in depicting landform-scale vari- ation in grain size proportions. Moreover, although we argue that the ~1 km resolution is sufficient to delineate topo-climatic conditions for most rock gla- ciers, there remains a need to account for site-specific debris availability, lithology and melt-water dynam- ics, or groundwater conditions and sedimentary his- tory in the cases of pingos and ice-wedge polygons.
Not considering all constraining factors for land- form development may cause modelling to overes- timate the extent of new suitable conditions, and sub- sequently the presented proportions of lost environ- mental spaces are arguably conservative.
Ultimately, we model suitable conditions for landform occurrences in recent and future climates, but cannot presently address the physical processes, such as ground-ice degradation or aggradation and associated heat fluxes, behind landform development using our approach. The vulnerability of perma- frost to atmospheric warming is highly complex and depends on multiple dynamic processes acting in the surface water, snow, vegetation and soil layers and related positive and negative feedbacks (Shur and Jorgenson2007, Nitzbonet al2019). Moreover, the thermal inertia of ice-rich ground encumbers per- mafrost warming (Grosse et al 2011). Ground ice and associated phase changes of water (i.e. the latent heat effect), as well as the content of unfrozen water in frozen soils (Huet al2020), are key constituents of the near-surface permafrost response to climate forcing that may not be uniform in different initial ground temperature conditions (Riseborough1990).
Not considering such transient effects lowers our abil- ity to assess landform occurrence potential in the future, given that the used approach assumes equilib- rium state between landforms and climate. Process- based models could be appropriate for assessing the physical responses and related feedbacks of climate change because of their explicit parameterization of heat fluxes and transient effects in the surface layers (e.g. Harriset al2009). However, they are often con- ducted at coarse spatial resolutions, which limits their applicability in assessing permafrost landforms at a relevant scale in a hemispheric extent.
Statistical modelling allows for producing reas- onably accurate information on the suitable envir- onments for permafrost landforms at a high resol- ution. This information can be used to link locally resolved detailed land surface processes to globally
relevant developments due to climate change. Predic- tions can also facilitate initial landform mapping in understudied regions although their accuracy at pixel resolution (~1 km2) is to be taken cautiously due to the documented prediction errors (figure5). In addi- tion to likely profound geomorphic changes, ground ice degradation in the areas of projected lost environ- mental conditions may greatly alter hydrological and biogeochemical processes. In addition, the eventual disappearance of permafrost landforms represents a loss in local geodiversity, and thereby affects biod- iversity (Antonelliet al2018). From a human activ- ity point of view, ground ice degradation and loss of permafrost landforms can affect freshwater availabil- ity (Joneset al2018,2019) and infrastructure integ- rity (Raynoldset al2014, Kanevskiyet al2017). Using permafrost landforms as proxies for massive ice, our modelling yielded novel information on fine-scale spatial variation of high ground ice content across permafrost landscapes. It should be noted that pin- gos occupy a very small proportion of landscapes rel- ative to ice-wedge polygonal terrain or even large rock glaciers, and thus the potential amount of ground ice expected in a grid cell is different for each landform.
5. Conclusions
From this study the following conclusions could be drawn:
• The suitable environmental conditions for perma- frost landforms at the circumpolar scale are closely related to climate and prone to shift along projec- ted regional changes in air temperature and pre- cipitation.
• On average, the landforms are projected to lose more than one-fifth of their suitable environments under a moderate climate scenario (RCP4.5) and around one-third under a very high baseline emis- sion scenario (RCP8.5) by midcentury.
• The sensitivity of pingos and ice-wedge polygons to the amount of rainfall was unambiguous, albeit TDD was almost as important for ice-wedge poly- gons.
• Alongside air temperatures, precipitation regime is suggested to be a key constraining factor of geomorphic development outside mountainous environments.
• For rock glaciers, air temperature and topo- graphy primarily controlled the occurrence poten- tial. However, the approach had a limited ability to separate suitable environments for rock glaciers from those for other glacial or periglacial slope processes.
The predicted changes in environmental spaces suitable for the studied permafrost landforms will affect Arctic landscapes and their geomorphology across large areas. The potential implications should
be considered when assessing impacts of climate change on natural and human systems.
Acknowledgments
This study was funded by the Academy of Fin- land (grants 315519, 307761). BMJ was supported by awards from the US National Science Found- ation (OPP-1806213 and ICER-1927872) and GG was supported by ERC PETA-CARB (#338335), the HGF Impulse and Networking Fund (ERC-0013), and NASA NNX08AJ37G. The contribution by BE and KSL was funded by the University of Oslo, Nor- way. We wish to thank two anonymous reviewers for their highly valuable comments.
Data availability statement
The data that support the findings of this study are available upon reasonable request from the authors.
Author contributions
OK, ML and JH developed the original idea. OK led the compilation of observational data with contribu- tions from BE, GG, BMJ and KSL, and geospatial data processing with JH and JA. OK performed the statist- ical analyses with contributions from JA, JH and ML.
OK wrote the manuscript with contributions from all the authors.
Competing interests
The authors declare that they have no competing interests.
ORCID iDs
Olli Karjalainenhttps://orcid.org/0000-0003- 2429-4595
Miska Luotohttps://orcid.org/0000-0001-6203- 5143
Juha Aaltohttps://orcid.org/0000-0001-6819- 4911
Bernd Etzelmüllerhttps://orcid.org/0000-0001- 5156-3653
Guido Grossehttps://orcid.org/0000-0001-5895- 2141
Benjamin M Joneshttps://orcid.org/0000-0002- 1517-4711
Karianne S Lilleørenhttps://orcid.org/0000-0002- 5887-1103
Jan Hjorthttps://orcid.org/0000-0002-4521-2088
References
Aalto J and Luoto M 2014 Integrating climate and local factors for geomorphological distribution modelsEarth Surf. Process.
Landf.391729–40
Aalto J, Harrison S and Luoto M 2017 Statistical modelling predicts almost complete loss of major periglacial processes in Northern EuropeNat. Commun.8515
Aalto J, Karjalainen O, Hjort J and Luoto M 2018 Statistical forecasting of current and future circum-Arctic ground temperatures and active layer thicknessGeophys. Res. Lett.
454889–98
Allard M and Kasper J N 1998 Temperature conditions for ice-wedge cracking: field measurements from Salluit, Northern QuebecProc. Seventh Int. Conf. on Permafrosteds Allard M and Lewkowicz AG Centre d’etudes Nordiques, Universite Laval pp 5–12
Allouche O, Tsoar A and Kadmon R 2006 Assessing the accuracy of species distribution models: prevalence, kappa and the true skill statistic (TSS)J. Appl. Ecol.431223–32 Antonelli Aet al2018 Geological and climatic influences on
mountain biodiversityNat. Geosci.11718–25
Barsch D 1996Rock-glaciers Indicators for the Present and Former Geoecology in High Mountain Environments(Berlin:
Springer)
Bernard-Grand’Maison C and Pollard W 2018 An estimate of ice wedge volume for a high arctic polar desert environment, Fosheim Peninsula, Ellesmere IslandCryosphere 123589–604
Berthling I 2011 Beyond confusion: rock glaciers as
cryo-conditioned landformsGeomorphology13198–106 Biskaborn B Ket al2019 Permafrost is warming at a global scale
Nat. Commun.10264
Boeckli L, Brenning A, Gruber S and Noetzli J A 2012 Statistical approach to modelling permafrost distribution in the European Alps or similar mountain rangesCryosphere 6125–40
Brighenti S, Tolotti M, Bruno M C, Wharton G, Pusch M T and Bertoldi W 2019 Ecosystem shifts in Alpine streams under glacier retreat and rock glacier thaw: a reviewSci. Total Environ.675542–59
Brown J, Ferrians O J Jr, Heginbottom J A and Melnikov E S 2002 Circum-Arctic map of permafrost and ground-ice conditions version 2 (National Snow and Ice Data Center) https://nsidc.org/data/ggd318
Böhner J and Selige T 2006 Spatial prediction of soil attributes using terrain analysis and climate regionalisationSAGA – Analysis and Modelling Applicationseds Böhner J, McCloy KR and Strobl, J (Göttingen: Verlag Erich Goltze GmbH) Chadburn S E, Burke E J, Cox P M, Friedlingstein P, Hugelius G
and Westermann S 2017 An observation-based constraint on permafrost loss as a function of global warmingNat.
Clim. Change7340–4
Christiansen H H 2005 Thermal regime of ice-wedge cracking in Adventdalen, SvalbardPermafrost Periglacial Process.
1687–98
Conrad O, Bechtel B, Bock M, Dietrich H, Fischer E, Gerlitz L, Wehberg J, Wichmann V and Böhner J 2015 System for automated geoscientific analyses (SAGA) v. 2.1.4Geosci.
Model Dev.81991–2007
Danielson J J and Gesch D B 2011 Global multi-resolution terrain elevation data 2010 (GMTED2010 US geological survey open-file report 2011–1073) pp26
Defourny P 2016European Space Agency Land Cover Climate Change Initiative Water Bodies Map, v4.0
ESACCI-LC-L4-WB-Map-150m-P13Y-2000-v40(Centre for Environmental Data Analysis)
http://maps.elie.ucl.ac.be/CCI/viewer/download.php Douglas T A, Turetsky M R and Koven C D 2020 Increased rainfall
stimulates permafrost thaw across a variety of Interior Alaskan boreal ecosystemsNpj Clim. Atmos. Sci.328 Elith J, Ferrier S, Huettmann F and Leathwick J 2005 The
evaluation strip: A new and robust method for plotting predicted responses from species distribution modelsEcol.
Modell.186280–9
Evans D J A 1993 High-latitude rock glaciers: A case study of forms and processes in the Canadian arcticPermafrost Periglacial Process.417–35
Farquharson L M, Romanovsky V E, Cable W L, Walker D A, Kokelj S and Nicolsky D 2019 Climate change drives widespread and rapid thermokarst development in very cold permafrost in the Canadian high arcticGeophys. Res. Lett.
46681–9
Fewster R E, Morris P J, Swindles G T, Gregoire L J, Ivanovic R F, Valdes P J and Mullan D 2020 Drivers of Holocene palsa distribution in North AmericaQuat. Sci. Rev.240106337 Fortier D, Allard M and Shur Y 2007 Observation of rapid
drainage system development by thermal erosion of ice wedges on Bylot Island, Canadian Arctic archipelago Permafrost Periglacial Process.18229–43
Fountain A G, Campbell J L, Schuur E A G, Stammerjohn S E, Williams M W and Ducklow H W 2012 The disappearing cryosphere: impacts and ecosystem responses to rapid cryosphere lossBioScience62405–15
Fraser R H, Kokelj S V, Lantz T C, McFarlane-Winchester M, Olthof I and Lacelle D 2018 Climate sensitivity of high arctic permafrost terrain demonstrated by widespread ice-wedge thermokarst on banks IslandRemote Sens.10954
Gorbunov A P 2013 Rock glaciers, glaciers and permafrost in Iran Kriosfera Zemli1728–34
Grosse G and Jones B M 2011 Spatial distribution of pingos in northern AsiaCryosphere513–33
Grosse G, Romanovsky V, Jorgenson T, Walter Anthony K, Brown J and Overduin P P 2011 Vulnerability and feedbacks of permafrost to climate changeEOS929
Grosse G, Goetz S, Mcguire A D, Romanovsky V E and Schuur E A G 2016 Changing permafrost in a warming world and feedbacks to the Earth systemEnviron. Res. Lett.11040201 Guo D and Wang H 2016 CMIP5 permafrost degradation
projection: a comparison among different regionsJ.
Geophys. Res. Atmos.1214499–517
Harris Cet al2009 Permafrost and climate in Europe: monitoring and modelling thermal, geomorphological and geotechnical responsesEarth Sci. Rev.92117–71
Hengl Tet al2017 SoilGrids250m – global gridded soil information based on machine learningPLoS ONE 12e0169748
Hijmans R J, Cameron S E, Parra J L, Jones P G and Jarvis A 2005 Very high resolution interpolated climate surfaces for global land areasInt. J. Clim.251965–78
Hjort J, Karjalainen O, Aalto J, Westermann S, Romanovsky V E, Nelson F E, Etzelmüller B and Luoto M 2018 Degrading permafrost put Arctic infrastructure at risk by midcentury Nat. Commun.95147
Hoegh-Guldberg Oet al2018 Impacts of 1.5◦C of global warming on natural and human systemsGlobal Warming of 1.5◦C An IPCC Special Report on the impacts of global warming of 1.5◦C above pre-industrial levels and related global greenhouse gas emission pathways, in the context of strengthening the global response to the threat of climate change, sustainable development, and efforts to eradicate povertyeds Masson-Delmotte, Vet al(Geneva: IPCC) pp 175–312 Hu G, Zhao L, Zhu X, Wu X, Wu T, Li R, Xie C and Hao J 2020
Review of algorithms and parameterizations to determine unfrozen water content in frozen soilGeoderma368114277 Humlum O 2000 The geomorphic significance of rock glaciers:
estimates of rock glacier debris volumes and headwall recession rates in West GreenlandGeomorphology3541–67 Iijima Y, Fedorov A N, Park H, Suzuki K, Yabuki H, Maximov T C
and Ohata T 2010 Abrupt increases in soil temperatures following increased precipitation in a permafrost region, central Lena River basin, RussiaPermafrost Periglacial Process.2130–41
Jones B M, Grosse G, Hinkel K M, Arp C D, Walker S, Beck R A and Galloway J P 2012 Assessment of pingo distribution and morphometry using an IfSAR derived digital surface model, western Arctic coastal plain, Northern Alaska
Geomorphology1381–14
Jones B M, Grosse G, Arp C D, Miller E, Liu L, Hayes D J and Larsen C F 2015 Recent Arctic tundra fire initiates widespread thermokarst developmentSci. Rep.5p15865
Jones D B, Harrison S, Anderson K and Betts R A 2018 Mountain rock glaciers contain globally significant water storesSci.
Rep.82834
Jones D B, Harrison S, Anderson K and Whalley W B 2019 Rock glaciers and mountain hydrology: a reviewEarth Sci. Rev.
19366–90
Jorgenson M T, Shur Y L and Pullman E R 2006 Abrupt increase in permafrost degradation in Arctic AlaskaGeophys. Res.
Lett.33L02503
Jorgenson M T, Kanevskiy M, Shur Y, Moskalenko N, Brown D, Wickland K P, Striegl R G and Koch J C 2015 Role of ground ice dynamics and ecological feedbacks in recent ice wedge degradation and stabilizationJ. Geophys. Res. Earth Surface 1202280–97
Kane D L, Hinkel K M, Goering D J, Hinzman L D and Outcalt S I 2001 Non-conductive heat transfer associated with frozen soilsGlob. Planet. Change29275–92
Kanevskiy M, Shur Y, Jorgenson T, Brown D R N, Moskalenko N, Brown J, Walker D A, Raynolds M K and Buchhorn M 2017 Degradation and stabilization of ice wedges: implications for assessing risk of thermokarst in northern Alaska
Geomorphology29720–42
Karjalainen O, Luoto M, Aalto J and Hjort J 2019 New insights into the environmental factors controlling the ground thermal regime across the Northern Hemisphere: a comparison between permafrost and non-permafrost areas Cryosphere13693–707
Knight J, Harrison S and Jones D B 2019 Rock glaciers and the geomorphological evolution of deglacierizing mountains Geomorphology32414–24
Kokelj S V, Lantz T C, Wolfe S A, Kanigan J C, Morse P D, Coutts R, Molina-Giraldo N and Burn C R 2014 Distribution and activity of ice wedges across the forest-tundra transition, western Arctic CanadaJ. Geophys. Res. Earth Surface 1192032–47
Kokelj S V, Tunnicliffe J, Lacelle D, Lantz T C, Chin K S and Fraser R 2015 Increased precipitation drives mega slump development and destabilization of ice-rich permafrost terrain, northwestern CanadaGlob. Planet. Change 12956–68
K¨a¨ab A, Frauenfelder R and Roer I 2007 On the response of rockglacier creep to surface temperature increaseGlob.
Planet. Change56172–87
Lara M J, Nitze I, Grosse G, Martin P and Mcguire A D 2018 Reduced arctic tundra productivity linked with landform and climate change interactionsSci. Rep.82345 Liljedahl A Ket al2016 Pan-Arctic ice-wedge degradation in
warming permafrost and its influence on tundra hydrology Nat. Geosci.9312–8
Lilleøren K S and Etzelmüller B 2011 A regional inventory of rock glaciers and ice-cored moraines in NorwayGeogr. Ann. Ser.
A: Phys. Geogr.93175–91
Luoto M, Marmion M and Hjort J 2010 Assessing spatial uncertainty in predictive geomorphological mapping: a multi-modelling approachComput. Geosci.36355–61 Mackay J R 1972 The world of underground iceAnn. Assoc. Am.
Geogr.621–22
Mackay J R 1988 Pingo collapse and paleoclimatic reconstruction Can. J. Earth Sci.25495–511
Mackay J R 1998 Pingo Growth and collapse, Tuktoyaktuk Peninsula Area, Western Arctic Coast, Canada: a long-term field studyG´eographie Phys. Quaternaire52271–323 Mccune B and Keon D 2002 Equations for potential annual direct
incident radiation and heat loadJ. Vegetation Sci.13603–6 Nitzbon J, Langer M, Westermann S, Martin L, Aas K S and Boike
J 2019 Pathways of ice-wedge degradation in polygonal tundra under different hydrological conditionsCryosphere 131089–123
Nitzbon J, Westermann S, Langer M, Martin L C P, Strauss J, Laboor S and Boike J 2020 Fast response of cold ice-rich permafrost in northeast Siberia to a warming climateNat.
Commun.112201
O’Neill H B, Wolfe S A and Duchesne C 2019 New ground ice maps for Canada using a paleogeographic modelling approachCryosphere13753–73
Obu Jet al2019 Northern Hemisphere permafrost map based on TTOP modelling of 2000–2016 at 1km2scaleEarth Sci. Rev.
193299–316
Olefeldt Det al2016 Circumpolar distribution and carbon storage of thermokarst landscapesNat. Commun.
713043
Peng X, Zhang T, Frauenfeld O W, Wang K, Luo D, Cao B, Su H, Jin H and Wu Q 2018 Spatiotemporal changes in active layer thickness under contemporary and projected climate in the northern hemisphereJ. Clim.31251–66
Raynolds M K, Walker D A, Ambrosius K J, Brown J, Everett K R, Kanevskiy M, Kofinas G P, Romanovsky V E, Shur Y and Webber P J 2014 Cumulative geoecological effects of 62 years of infrastructure and climate change in ice-rich permafrost landscapes, Prudhoe Bay Oilfield, AlaskaGlob.
Change Biol.201211–24
Riseborough D W 1990 Soil latent heat as a filter of the climate signal in permafrostFifth Canadian Permafrost Conf.
(Qu´ebec: Universit´e Laval) pp 199–205
Rowland J Cet al2010 Arctic landscapes in transitions: responses to thawing permafrostEOS9126
Rudy A C A, Lamoureux S F, Treitz P, Ewijk K V, Bonnaventure P P and Budkewitsch P 2017 Terrain controls and
landscape-scale susceptibility modelling of active-layer detachments, Sabine Peninsula, Melville Island, Nunavut Permafrost Periglacial Process.2879–91
Schuur E A Get al2015 Climate change and the permafrost carbon feedbackNature520171–9
Serikova Set al2018 High riverine CO2emissions at the permafrost boundary of Western SiberiaNat. Geosci.
11825–9
Shur Y L and Jorgenson M T 2007 Patterns of permafrost formation and degradation in relation to climate and ecosystemsPermafrost Periglacial Process.187–19
Slater A G and Lawrence D M 2013 Diagnosing present and future permafrost from climate modelsJ. Clim.265608–23 Steedman A E, Lantz T C and Kokelj S V 2017 Spatio-temporal
variation in high-centre polygons and ice-wedge melt ponds, Tuktoyaktuk coastlands, Northwest Territories Permafrost Periglacial Process.2866–78
Streletskiy D A, Suter L J, Shiklomanov N I, Porfiriev B N and Eliseev D O 2019 Assessment of climate change impacts on buildings, structures and infrastructure in the Russian regions on permafrostEnviron. Res. Lett.14025003 Taylor K E, Stouffer R J and Meehl G A 2012 An overview of
CMIP5 and the experiment designBull. Am. Meteorol. Soc.
93485–98
Thuiller W, Lafourcade B, Engler R and Ara´ujo M B 2009 BIOMOD – a platform for ensemble forecasting of species distributionsEcography32369–73
van Vuuren D Pet al2011 The representative concentration pathways: an overviewClim. Change1095–31 Vandenberghe J and Pissart A 1993 Permafrost changes in
Europe during the last glacialPermafrost Periglacial Process.
4121–35
Ward Jones M K, Pollard W H and Jones B M 2019 Rapid initialization of retrogressive thaw slumps in the Canadian high Arctic and their response to climate and terrain factors Environ. Res. Lett.14055006
Washburn A L 1980 Permafrost features as evidence of climatic changeEarth Sci. Rev.15327–402