PAPER • OPEN ACCESS
Increase in beaver dams controls surface water and thermokarst
dynamics in an Arctic tundra region, Baldwin Peninsula, northwestern Alaska
To cite this article: Benjamin M Jones et al 2020 Environ. Res. Lett. 15 075005
View the article online for updates and enhancements.
This content was downloaded from IP address 139.75.1.3 on 01/07/2020 at 13:22
Environ. Res. Lett.15(2020) 075005 https://doi.org/10.1088/1748-9326/ab80f1
Environmental Research Letters
OPEN ACCESS
RECEIVED
12 January 2020
REVISED
14 March 2020
ACCEPTED FOR PUBLICATION
18 March 2020
PUBLISHED
30 June 2020
Original content from this work may be used under the terms of the Creative Commons Attribution 4.0 licence.
Any further distribution of this work must maintain attribution to the author(s) and the title of the work, journal citation and DOI.
LETTER
Increase in beaver dams controls surface water and thermokarst dynamics in an Arctic tundra region, Baldwin Peninsula,
northwestern Alaska
Benjamin M Jones1,6, Ken D Tape2, Jason A Clark2, Ingmar Nitze3, Guido Grosse3,4 and Jeff Disbrow5
1 Institute of Northern Engineering, University of Alaska Fairbanks, Fairbanks, AK, United States of America 2 Geophysical Institute, University of Alaska Fairbanks, Fairbanks, AK, United States of America
3 Alfred Wegener Institute Helmholtz Centre for Polar and Marine Research, Potsdam, Germany 4 Institute of Geosciences, University of Potsdam, Potsdam, Germany
5 Polar Geospatial Center, University of Minnesota, Minneapolis, MN, United States of America 6 Author to whom any correspondence should be addressed.
E-mail:bmjones3@alaska.edu
Keywords:Arctic Tundra, Beavers, Surface Water, Thermokarst
Abstract
Beavers are starting to colonize low arctic tundra regions in Alaska and Canada, which has implications for surface water changes and ice-rich permafrost degradation. In this study, we assessed the spatial and temporal dynamics of beaver dam building in relation to surface water dynamics and thermokarst landforms using sub-meter resolution satellite imagery acquired between 2002 and 2019 for two tundra areas in northwestern Alaska. In a 100 km
2study area near Kotzebue, the number of dams increased markedly from 2 to 98 between 2002 and 2019. In a 430 km
2study area encompassing the entire northern Baldwin Peninsula, the number of dams increased from 94 to 409 between 2010 and 2019, indicating a regional trend. Correlating data on beaver dam numbers with surface water area mapped for 12 individual years between 2002 and 2019 for the Kotzebue study area showed a significant positive correlation (R
2=0.61; p < .003).
Beaver-influenced waterbodies accounted for two-thirds of the 8.3% increase in total surface water area in the Kotzebue study area during the 17 year period. Beavers specifically targeted thermokarst landforms in their dam building activities. Flooding of drained thermokarst lake basins accounted for 68% of beaver-influenced surface water increases, damming of lake outlets accounted for 26%, and damming of beaded streams accounted for 6%. Surface water increases resulting from beaver dam building likely exacerbated permafrost degradation in the region, but dam failure also factored into the drainage of several thermokarst lakes in the northern Baldwin Peninsula study region, which could promote local permafrost aggradation in freshly exposed lake sediments. Our findings highlight that beaver-driven ecosystem engineering must be carefully considered when accounting for changes occurring in some permafrost regions, and in particular, regional surface water dynamics in low Arctic and Boreal landscapes.
1. Introduction
Arctic landscapes are in a state of transition due to changes in climate (Hinzman et al 2005, Row- landet al2010, Vincentet al2017). In the summer, increased warmth and longer growing seasons have been linked to increases in tundra productivity and shrub-dominated vegetation over the last three dec- ades (Tapeet al2006, Myers-Smithet al2011, Berner et al2018, Bonney et al2018). Summertime arctic
lake area dynamics have been linked to long-term climate driven changes and permafrost degradation (Yoshikawa and Hinzman 2003, Smith et al 2005, Jones et al 2011, Nitze et al 2018), as well as to short-term weather events and annual patterns of precipitation and evaporation (Riordanet al 2006, Cooleyet al2019, Swanson2019). Near-surface per- mafrost degradation in the form of melting ice wedges (Jorgenson et al 2006, Liljedahl et al 2016), forma- tion of retrogressive thaw slumps (Ward Joneset al
2019), and degradation of palsas (Borgeet al 2017) have all been attributed to warmer summer condi- tions. In the winter, landscape-scale impacts include shorter snow-cover duration periods (Niittynenet al 2018), earlier river ice break up (Brubakeret al2011b, Brownet al2018), increasing river discharge (Rawlins et al2019), and thinner seasonal ice growth on lakes (Arpet al2012, Surduet al2014).
Scattered observations indicate that beavers (Castor canadensis) have moved from the forest into tundra areas during the last 20 years (Brubakeret al 2011a, Junget al2017, Tape et al2018). Junget al (2017) noted the presence of a new beaver dam in 2015 near the Babbage River, located within 25 km of the Beaufort Sea coast on the Yukon Coastal Plain in northwestern Arctic Canada. Tapeet al(2018) found an increase in the number and spatial distribution of beavers in two predominantly tundra watersheds in northwestern Alaska between 1999 and 2014. Tape et al(2018) postulated that ongoing landscape-scale changes in the Arctic, combined with population rebound from over-trapping (Bockstoce 2009), are responsible for beavers recent colonization of Alaska tundra regions. The implications of beaver inhabit- ation in the Arctic and Boreal are unique relative to other ecosystems due to the presence of permafrost and its vulnerability associated with beaver dams and inundation.
Few studies have directly addressed beaver- permafrost interactions in Arctic and Boreal regions.
Lewkowicz and Coultish (2004) documented the likely effects of beaver damming on the formation and degradation of palsa mounds in the southern Yukon Territory in Canada. Analysis of high res- olution satellite imagery in the Noatak and Wulik River watersheds in northwestern Alaska showed that extensive inundation and other hydrologic changes associated with pond construction can initiate ther- mokarst in and around beaver dam complexes (Tape et al2018). Beavers in this study area were observed to cause lake expansion and drainage, thaw slump ini- tiation, thermoerosional gully formation, ice wedge degradation, thermokarst shore fen development, and possibly development of taliks associated with water impoundment (Joneset al2018). In general, however, beaver dam building and surface water impoundment in ice-rich permafrost terrain has not been examined as a potential driver of thermokarst dynamics in Arctic and Boreal regions.
In this study, we use very high resolution remote sensing imagery to explore changes in beaver activity and the impact of their colonization on an arctic tun- dra area in northwestern Alaska. Our study specific- ally examines the role of beavers in controlling sur- face water dynamics and related thermokarst devel- opment in low Arctic tundra regions. We mapped the number of beaver dams visible in sub-meter resolution satellite images acquired between 2002 and 2019 for a 100 km2 study area (12 individual
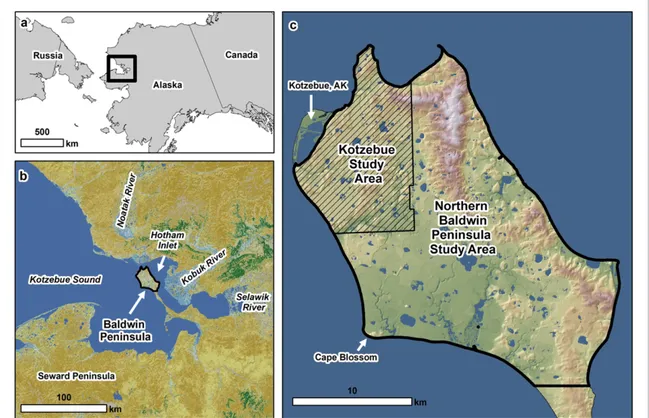
years of imagery) near Kotzebue, Alaska and a 430 km2 study area (3 individual years of imagery) encompassing the entire northern Baldwin Penin- sula, Alaska (figure1). We show that during the last two decades beaver-driven ecosystem engineering is responsible for the majority of surface water area changes and inferred thermokarst development in the study area. This has implications for interpreting sur- face water area changes and thermokarst dynamics in other Arctic and Boreal regions that may also result from beaver dam building activities.
2. Study area
The Baldwin Peninsula, located in northwestern Alaska, is a middle Pleistocene-aged push-moraine complex composed of marine, fluvial, and gla- ciogenic sediments (Huston et al 1990) capped with late Pleistocene-aged syngenetic ice-rich per- mafrost (yedoma). The landscape has been extens- ively reworked by thermokarst lake processes dur- ing the Holocene (McCulloch and Hopkins 1966, Jongejanset al2018). The peninsula lies at the bound- ary between continuous and discontinuous perma- frost zones (Jorgenson et al 2008), and consists of tundra vegetation (figure2). Vegetation is character- ized by moist tundra, dominated by tussock-forming sedges and dwarf shrubs <40 cm tall, as well as wet- land complexes, dominated by sedges and low shrubs
>40 cm tall (Walkeret al2005). Paleoecological stud- ies have shown that the treeline extended to the Bald- win Peninsula during past warm intervals (Hamilton and Brigham-Grette1991). Coastal exposures dating to the holocene thermal maximum (HTM), roughly 10 kya, include beaver-gnawed wood, dam complexes, and show that beavers had a widespread role in thermokarst lake dynamics (McCulloch and Hop- kins1966). While we currently lack detailed histor- ical records on the presence of beavers in the study region (McCulloch and Hopkins1966), local obser- vations from the Kotzebue area indicate that there has been an increase of beavers since 2000 (Kantner S per- sonal communication).
2.1. Remote sensing analysis
The Baldwin Peninsula was selected as the study area due to the optimum availability of sufficiently high spatial and temporal resolution satellite imagery and the presence of tundra vegetation and perma- frost (figure 2). Beaver dams were mapped using high-resolution satellite imagery available from the DigitalGlobe Inc. imagery archive in two areas to account for spatial and temporal differences in cloud-free image availability between 2002 and 2019.
The spatial resolution of the panchromatic imagery ranged from 40 cm to 70 cm and the frequent image acquisition dates provided an opportunity for cloud- free observations suitable for identifying beaver dams across the study period (figure 3). The imagery
Environ. Res. Lett.15(2020) 075005 B M Joneset al
Figure 1.Location of the beaver dam mapping study area in northwestern Alaska. (a) Overview map showing location of the study area in Alaska. (b) NLCD landcover map showing the study area and surrounding region consisting of predominantly tundra and wetland vegetation (light brown and light blue) with forested areas indicated in green (Jinet al2017). (c) IfSAR digital terrain model for the Kotzebue (100 km2) and northern Baldwin Peninsula (430 km2) study areas.
Figure 2.Oblique field photos from northwestern Alaska. The upper two images are photos taken within the study area in 2016 showing the tundra region setting. The bottom two images are taken from similar tundra across Hotham Inlet in 2015 (lower left) and 2011 (lower right) showing beaver dams in a drained lake basin outlet and along a beaded stream course, respectively.
Figure 3.Mapping beaver dams in high-resolution satellite imagery available for the northern Baldwin Peninsula, Alaska. The location of individual dams indicated with red arrow and the flow direction with a light blue arrow. (a) A series of four dams at the outlet of a lake, (b) a ~60 m long dam built in a drained lake basin, (c) a series of dams at the outlet of a lake near a confluence with a beaded stream, (d) a series of dams in a channel running through the middle of a drained lake basin, (e) five dams progressing down the outlet channel of a thermokarst lake, and (f) a series of dams in a beaded stream gulch. Examples shown here taken from 2019 images; note differences in scale across image frames. All dams were constructed after 2002. Imagery (104001004E669400—©2019 DigitalGlobe) copyright DigitalGlobe, Inc.
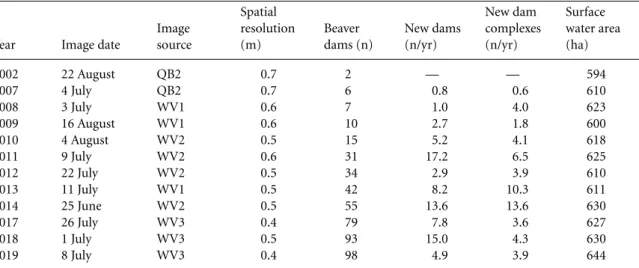
Table 1.High resolution remote sensing time series imagery used for mapping beaver dams and surface water area in the 100 km2 Kotzebue study area from 2002 to 2019.
Year Image date
Image source
Spatial resolution (m)
Beaver dams (n)
New dams (n/yr)
New dam complexes (n/yr)
Surface water area (ha)
2002 22 August QB2 0.7 2 — — 594
2007 4 July QB2 0.7 6 0.8 0.6 610
2008 3 July WV1 0.6 7 1.0 4.0 623
2009 16 August WV1 0.6 10 2.7 1.8 600
2010 4 August WV2 0.5 15 5.2 4.1 618
2011 9 July WV2 0.6 31 17.2 6.5 625
2012 22 July WV2 0.5 34 2.9 3.9 610
2013 11 July WV1 0.5 42 8.2 10.3 611
2014 25 June WV2 0.5 55 13.6 13.6 630
2017 26 July WV3 0.4 79 7.8 3.6 627
2018 1 July WV3 0.5 93 15.0 4.3 630
2019 8 July WV3 0.4 98 4.9 3.9 644
was orthorectified using the 2 arc-second resolution U.S. Geologic Survey National Elevation Dataset for Alaska and corrected to top-of-atmosphere reflect- ance to facilitate time series analysis. Beaver dam mapping positions were based on the orthorectifica- tion results from the 2019 images to account for subtle differences in image geolocation in prior years.
Based on suitable and available imagery, the Kotzebue study area (100 km2) was mapped each year in 2002, 2007–14, and 2017–2019 (in total 12 individual years) and the entire northern Baldwin Peninsula (430 km2) was mapped in 2010, 2013, and 2019 (3 individual years). This hybrid approach was designed to optimize our spatial and temporal
perspective and to assess whether the changes being observed near Kotzebue were reflective of changes occurring in the surrounding region. Beaver dams were manually mapped in each image in both study areas at a scale of 1:1000. All individual, appar- ently active dams were designated as a point fea- ture in a GIS database in each image. If a dam failed or was abandoned in a subsequent year it was not counted in the latter time series unless it was re-established. Dams were also grouped as com- plexes to track the inhabitation of new dam building sites over time in the study region. The location of dams relative to permafrost-region landforms (ther- mokarst lakes, drained thermokarst lake basins, and
Environ. Res. Lett.15(2020) 075005 B M Joneset al
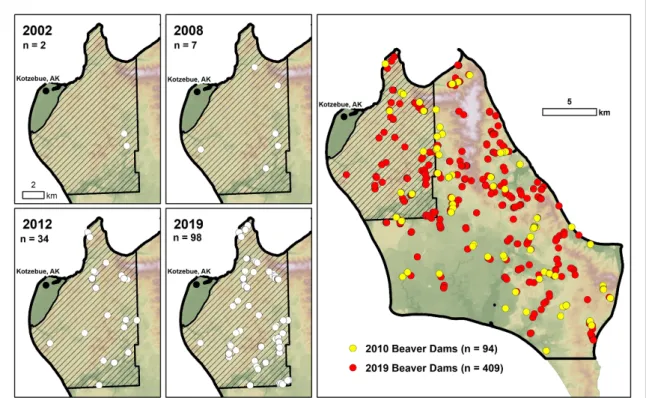
Figure 4.Increase in beaver dams on the northern Baldwin Peninsula in northwestern Alaska between 2002 and 2019. The detailed temporal analysis study area located near Kotzebue is shown in the four frames on the left representing a subset of the time series of beaver dams from 2002 (n=2), 2008 (n=7), 2012 (n=34), and 2019 (n=98). The northern Baldwin Peninsula study region is shown on the right with two of the three time stamps plotted (2010 and 2019) representing an increase from 94 to 409 beaver dams.
tundra/beaded streams) was also determined manu- ally. Surface water area change between 2002 and 2019 was then compared at beaver-influenced versus non-beaver-influenced waterbodies that were classi- fied as either thermokarst lake, drained thermokarst lake basin, or tundra/beaded stream to assess whether there was a preference for dam building relative to thermokarst landforms and their potential connec- tion to surface water changes.
We analyzed changes in surface water extent in the Kotzebue study area using the best available high- resolution panchromatic images available for a partic- ular year. Image selection focused on cloud-free, ice- free, and calm surface water conditions with images being acquired between late-June and mid-August in a given year. All images were resampled to a spa- tial resolution of 70 cm to match the lowest res- olution image in the time series prior to analysis.
Within year image dates range from 25 June to 22 August with the average date of image acquisition being 17 July (table1). Object-based image analysis was conducted in eCognition Essentials 1.3. Image pixels were grouped into objects using the multiresol- ution segmentation algorithm with a scale of 20, a color to shape parameter of 0.1, and a smoothness to compactness factor of 0.4. A supervised classific- ation scheme was developed for each image by select- ing water and non-water object samples. At least 500 samples were manually selected for each class in each image. Objects were classified using the object-based k-Nearest Neighbor (KNN) classifier with a k value of
1. The KNN is a simple machine learning algorithm where an object is classified by a majority vote of its neighbors, with the object being assigned to the class most common amongst its k nearest neighbors. Using a k value of 1 emphasizes stark contrasts between dis- parate object class types. An accuracy assessment was conducted using the eCognition workflow for each image object classification using the input training samples. The user and producer accuracy of surface water classification was >96% in each case. Classified objects were then merged and only those objects clas- sified as water were extracted for further analysis in a GIS database. All objects smaller than 250 m2 were removed from the surface water inventory, objects that fell outside of the overlapping extent of all images were removed from further analysis, and stable water feature centroids were used to reposition lake poly- gon files from prior years to match the orthorectific- ation positioning of the 2019 images. Surface water area was summed in each time step and its changes were compared against the number of beaver dams mapped in the Kotzebue study area and their relation to thermokarst landforms between 2002 and 2019.
3. Results
3.1.Beaver dam increases—2002 to 2019
The number of beaver dams in the Kotzebue study area increased from 2 in 2002 to 98 in 2019, or
~5000% (figure4and table1). The rate of increase followed that of a 2nd order polynomial regression
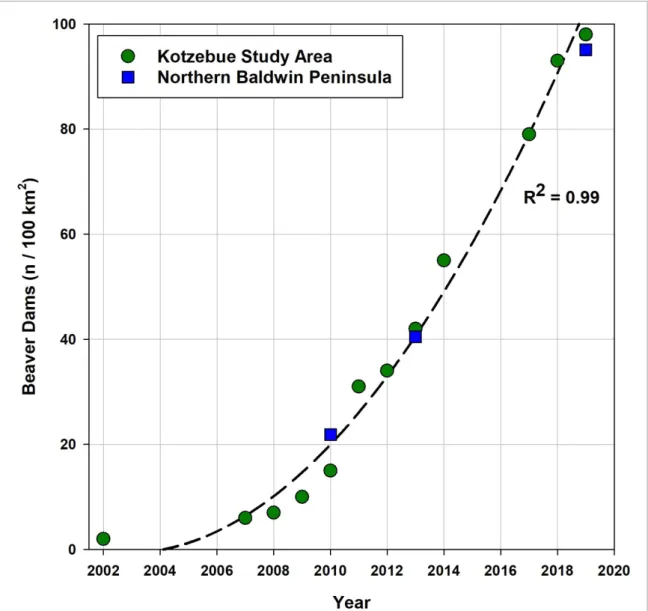
Figure 5.Increase in beaver dams on the northern Baldwin Peninsula since 2002. Twelve images were available for the 100 km2 Kotzebue study area and three mosaics were possible with available and suitable imagery for the 430 km2northern Baldwin Peninsula study region. The increasing pattern in the number of dams overtime in the study area around Kotzebue (green circles) is mirrored across the entire northern Baldwin Peninsula (blue squares). Data plotted as the number of beaver dams per 100 km2.
(R2 = 0.99), with the years 2011 (+17.2), 2014 (+13.6), and 2018 (+15) exhibiting the largest annu- alized increase in dam numbers (figure5). The area- weighted rate of dam increases for the Kotzebue study area based on the 17 year period was 5.6 dams per year per 100 km2. The number of dams in the lar- ger northern Baldwin Peninsula study area followed a similar trajectory between 2010 and 2019, increas- ing from 94 (2010), to 174 (2013), to 409 (2019) in the 430 km2 study area (figures4 and5). The rate of increase also followed that of a 2nd order polyno- mial regression, and the area-weighted rate of dam increases was 8.1 dams per year per 100 km2over the shorter and more recent time interval. Over this same period, the area-weighted rate of dam increases was 9.2 dams per year per 100 km2for the Kotzebue study area.
As of 2019, there are now 42 distinct beaver dam/pond complexes in the Kotzebue study area. On average, 2.5 new beaver dam sites, or the initiation
of new beaver dam complexes, were established per year over the 17 year period; however, there was sub- stantial interannual variation (range of 13.0). In par- ticular, 10.3 new sites were established between 2012 and 2013, and 13.6 new sites were established between 2013 and 2014, and less than one new site per year was established between 2002 and 2007. Analyzing the increase in the number of new dams relative to the number of new dam complexes shows periods of localized building versus expansion into new sites.
The year 2011 and period 2014–2018 experienced a ratio of more than 2:1 new dams relative to new com- plexes in the study area, indicating development of existing dam complexes. In contrast, the years 2008 and 2013 experienced the opposite pattern, with more new sites being established relative to dam build- ing at pre-existing complex sites. Between 2012 and 2013, the number of dams at existing sites and the establishment of new complexes were equally high at 13.6.
Environ. Res. Lett.15(2020) 075005 B M Joneset al
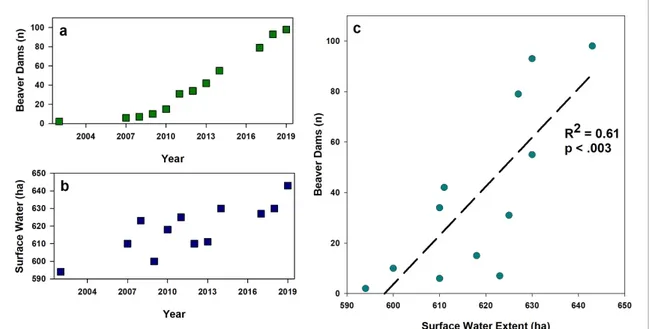
Figure 6.The role of beavers in affecting surface water variability near Kotzebue. (a) The number of beaver dams mapped in high resolution satellite imagery in the Kotzebue study area increased from 2 in 2002 to 98 in 2019. (b) Surface water area mapped in 70 cm resolution satellite imagery fluctuated but in general increased in the Kotzebue study area between 2002 and 2019. (c) Correlating surface water extent with the increase in the number of beaver dams for the Kotzebue study area shows a positive and statistically significant relationship (R2=0.61; p < .003).
3.2. Beaver dam impacts on surface water dynamics Total surface water area mapped in the Kotzebue study area showed a variable but increasing trend between 2002 and 2019 (figure 6 and table 1).
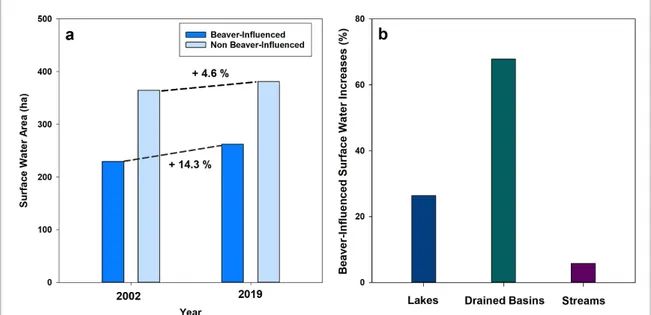
Total surface water area increased from 594 ha in 2002 to 643 ha in 2019, or 8.3%. The mapped surface water area increase was significantly cor- related with the increase in beaver dams over the 17 year period (R2 = 0.61; p < .003). We further investigated the 8.3% increase in surface water area between 2002 and 2019 at beaver-influenced versus non-beaver-influenced waterbodies. Partitioning the 49 ha increase in surface water area between 2002 and 2019 into beaver influenced (+33 ha) versus non-beaver influenced (+16 ha) waterbodies estab- lishes the role of beavers on controlling surface water area increases. Beaver-influenced waterbody areas increased by 14.3% over this period, whereas non- beaver influenced waterbody areas increased 4.6%
(figure 7(a)). Thus, beaver-influenced waterbodies accounted for the majority (66%) of the increase in surface water area in the Kotzebue study area between 2002 and 2019.
3.3. Beaver damming of thermokarst landforms All but one beaver dam was associated with at least one of three thermokarst landforms in the study region: thermokarst lakes, drained ther- mokarst lake basins, or tundra/beaded streams (figure7(b)). Beaver damming of drained lake basin outlets accounted for 68% of the increase in beaver- influenced waterbody area increases since 2002. In some cases, beaver dams led to more than a doub- ling in surface water area in specific drained lake
basins over the study period. Damming of lake out- lets accounted for 26% of the increase in surface water area. Damming at lake outlets tended to amp- lify natural expansion occurring along thermokarst lake margins due to permafrost degradation. Dam- ming of beaded stream courses, though representing only a small fraction of total beaver influenced sur- face water area, increased in area by more than 150%
(1.1–2.7 ha) between 2002 and 2019.
4. Discussion
4.1. Beaver dams—surface water—permafrost interactions
Our analysis adds the Baldwin Peninsula in north- western Alaska to the scattered recent evidence that beavers are establishing themselves as a key disturb- ance agent in low arctic tundra regions (Junget al 2017, Tapeet al 2018). In the Kotzebue study area, we found an 8.3% increase in surface water extent between 2002 and 2019, with short term annual vari- ation on the order of−0.2 to+3.7%. Over the twelve years of images analyzed, only three (2009, 2012, and 2017) experienced a reduction in total surface water based on the previous year, with one of the years being influenced by a partial lake drainage event. The 4.6% increase in non-beaver-influenced waterbod- ies likely results from natural thermokarst processes associated with expanding lakes in ice-rich perma- frost terrain as well as annual variability in surface water area to some degree. The 14.3% increase in surface water area in beaver-influenced waterbodies likely results from the cumulative effects of beaver damming and inundation of low-lying areas, as well
Figure 7.The impacts of beaver dams on changes in surface water extent in the Kotzebue study area. (a) Comparing surface water area mapped in high resolution satellite imagery from 2002 and 2019 relative to the presence of beaver dams in 2019 shows that beavers likely accounted for 66% of the increase in surface water area over this time period. (b) Beaver-influenced surface water area increases were dominated by damming of drained thermokarst lake basins (68%) relative to thermokarst lakes (26%) and beaded streams (6%).
as the degradation of permafrost and expansion of waterbodies through thermokarst processes. Surface waterbodies in the Arctic are known to fluctuate sea- sonally and annually, but also to interact with perma- frost through thermokarst processes that may cause both increases and decreases in surface water area (Bowlinget al2003, Smithet al2005, Joneset al2011, Cooleyet al2019, Nitzeet al2018). While it is diffi- cult to separate the combined effects of seasonal and annual variability and geomorphic factors when ana- lyzing regional surface water dynamics using remote sensing snapshots in time, the general trend over the 17 year study period for the Kotzebue study area was increasing surface water area resulting primarily from an increase in beaver dams (R2=0.61, p < .003).
Few studies have directly addressed beaver- permafrost interactions (Lewkowicz and Coultish 2004, Joneset al2018, Tapeet al2018). In this study, which represents a typical ice-rich permafrost land- scape in the Arctic interspersed with thermokarst lakes, drained thermokarst lake basins, and beaded streams, we showed that beavers preferentially build dams and facilitate inundation of thermokarst land- forms, which likely promotes permafrost degrada- tion. Water impoundment on the landscape is known to drive permafrost degradation (Lachenbruchet al 1962, Jorgensonet al2010, Arpet al2016). Surface water inundation more readily conducts heat and therefore impacts the ground thermal regime almost instantaneously (Langeret al2016). If the water depth is sufficient such that the mean annual water bot- tom temperature exceeds 0◦C (Burn2002), perma- frost thaw commences and in the case of ice-rich permafrost, thermokarst occurs (Grosseet al2013).
Several studies have highlighted the prominent role
of permafrost degradation, and in particular abrupt permafrost thaw and thermokarst development on mobilizing carbon previously stored in permafrost (Schuuret al2015, Walter Anthonyet al2018, Turet- skyet al2020). Future research should focus on the potential role of beavers on altering the carbon cycle in Arctic and Boreal regions (Gattiet al2018, Nummi et al2018).
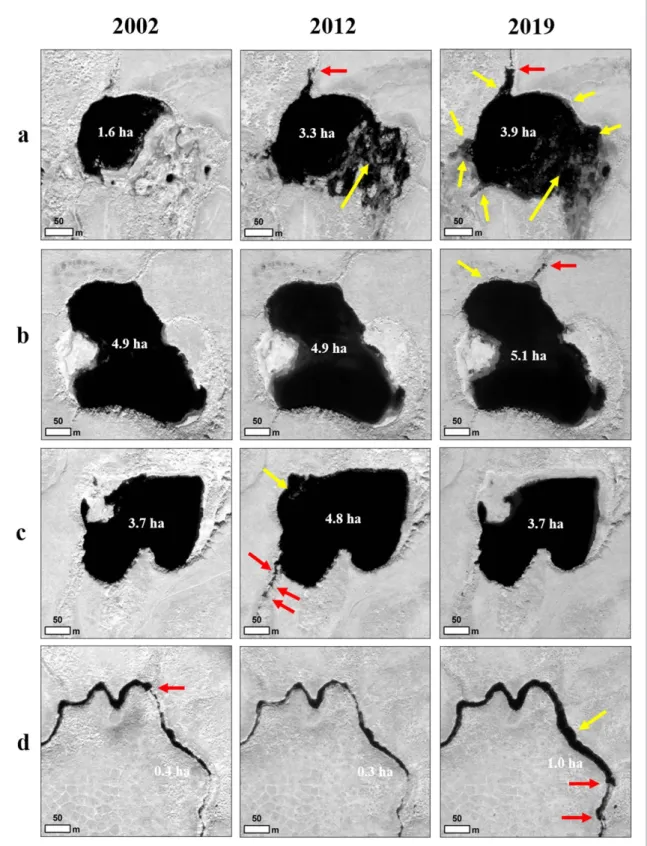
Beaver colonization and dam building has sub- stantial implications for the short-term dynamics and long-term evolution of permafrost lowlands (figure8). On the Baldwin Peninsula, northwestern Alaska, fossil beaver dams and beaver-gnawed wood dating to the early Holocene (10 kya) have been found in association with pond sediments and in ice wedge casts below the pond sediments, which were inferred to represent ice wedge melting as a result of beaver dam building (McCulloch and Hopkins 1966). We likewise found that damming of drained thermokarst lake basin outlets accounted for the largest increase in surface water area. Presumably this extensive inunda- tion due to beavers is accompanied by extensive per- mafrost degradation in the inundated basin floors and adjacent tundra slopes (figure8(a)). Beaver dam- ming of existing lake outlets was also observed to increase lake surface area, similarly promoting sub- aqueous and lateral degradation of permafrost (fig- ure8(b)). Lake drainage was also observed through dam failure, abandonment, or bank overtopping (fig- ure 8(c)). While bank overtopping is a commonly attributed lake drainage mechanism (Hinkel et al 2007, Joneset al 2011,2020), the ability of beavers to exacerbate this process has only been recognized once before (Lewkowicz and Coultish2004) and at least for sites like the Baldwin Peninsula it could help
Environ. Res. Lett.15(2020) 075005 B M Joneset al
Figure 8.Examples showing beaver controls on surface water and permafrost degradation in the high resolution imagery time series for three time stamps—2002, 2012, and 2019 in the Kotzebue study area. Beaver dams are depicted with a red arrow, surface water area changes are indicated with white text, and locations of likely permafrost degradation with yellow arrows. (a) Dam building at a partially drained lake basin beginning in 2012 caused a doubling in surface water area that increased another 18% by 2019, causing extensive permafrost degradation. (b) Beaver damming of a lake outlet in 2017 led to a small increase in surface area and permafrost degradation in the northwest corner of a previously stable lake. (c) Dam building of a lake outlet in 2011 caused a temporary 30% increase in surface water area and permafrost degradation by 2012 which reverted back to 3.7 ha in area following dam failure or abandonment in 2017 that persisted to 2019. (d) A dam present along a beaded stream course failed or was abandoned between 2002 and 2009. The site remained largely inactive until 2017 when a series of dams were built further downstream that persisted to 2019, increasing surface water area by a factor of 3. Imagery (10100100010DFC00—©2002 DigitalGlobe, 103001001A61DB00—©2012 DigitalGlobe, 104001004E669400—©2019 DigitalGlobe) copyright DigitalGlobe, Inc.
explain some of the recent widespread lake drain- age occurring in the region (Swanson2019). Future work will need to take into account the potential role
of beavers on driving these large regional differences in thermokarst lake dynamics and thus, permafrost landscape changes.
4.2. Reconsidering regional surface water dynamics in Arctic and Boreal regions
Numerous regional remote-sensing based studies of changing lake surface water dynamics have been con- ducted in Arctic and Boreal regions (Smith et al 2005, Riordan et al 2006, Carroll et al 2011, Jones et al2011, Roachet al2011, Nitzeet al2017,2018, Cooleyet al2019, Pasticket al2019, Swanson2019), yet beavers have seldom been considered among the primary drivers (Hood and Bayley2008). Our obser- vations showed that newly beaver influenced water- bodies accounted for 66% of the increase in surface water area between 2002 and 2019. This is compar- able to observations from the Boreal forest in Canada when assessing the role of beavers relative to climatic variable controls on open water extent. Hood and Bayley (2008) found that beavers were responsible for 80% of the increase in open water extent in their study area in east-central Alberta, which dwarfed the effects of climate variables. Our results challenge the idea that current and future surface water changes in some Arctic and Boreal regions are, or will be, directly linked to changes in permafrost and ther- mokarst resulting from increased air temperature, through-going talik penetration, and precipitation and/or evaporation trends (Yoshikawa and Hinzman 2003, Smith et al 2005, Riordan et al 2006, Jones et al2011, Roachet al2011, Nitzeet al2018, Cooley et al2019, Pasticket al2019). Including the poten- tial impact of beaver-driven engineering on Arctic and Boreal aquatic ecosystems may help explain the heterogeneity of lake area changes reported for a number of regions at the treeline and tundra eco- tone or continuous to discontinuous permafrost zone transition.
4.3. Beaver dam increases in arctic tundra regions While we have not addressed the causes of increases in beaver dam building in this study, it could be linked to three key components of changes occurring in the Arctic. First, the increased growing season length and increase in shrub cover and extent provide new forage and shelter necessary for beavers to survive in these landscapes (Tapeet al2006,2018). Second, changes in winter climate are dominating the annual climate change signal in this region (Staffordet al2000). The increase in winter air temperatures combined with more winter snowfall in Arctic Alaska is likely increas- ing the over-wintering habitat potential for beavers in a number of different types of thermokarst water bodies and as a result of thinner seasonal winter ice growth (Arp et al 2018). The shorter winters also reduce the duration that beavers must remain in their lodges relying on caches from the previous summer.
Third, the change in native subsistence and hunt- ing lifestyles that has occurred in this region and the reduction in the desire of beaver pelts and underfur for fashionable attire could be contributing to our
observations of increased beaver activity (Bockstoce 2009, Tapeet al2018). Other factors such as changes in disease or predation seem less likely but cannot be eliminated as possibilities. We hope to tease apart the driving forces responsible for the increase in beaver dam activity in future studies to assist in the devel- opment of models to predict future Arctic landscape dynamics.
An interesting analogue to our observations of rampant beaver dam building in tundra regions in Alaska comes from Tierra del Fuego, Patagonia. The introduction of ~20–50 beavers from northern Man- itoba, Canada in southern Patagonia in the 1940s has swelled to an estimated 100 000 beavers in the region over a 60–70 year period (Choi2008, Pietrek and Fasola 2014). Interestingly, one possible factor behind the explosive population growth has resul- ted from beavers moving out of the forests in which they were initially introduced, and establishing in adjacent steppe ecosystems which were previously thought to be subprime habitat (Pietreket al2017).
The ability of beavers to utilize a range of habitat types in Patagonia, and to thrive in largely herbaceous vegetation-dominated ecosystems, has implications for what appears to be an ongoing beaver invasion of low Arctic tundra ecosystems.
5. Conclusions
Detailed analysis of high-resolution satellite remote sensing data implicates beavers as key contributors to surface water area changes in an ice-rich permafrost region in northwestern Alaska tundra. The 5000%
increase in the number of beaver dams between 2002 and 2019 was positively correlated (R2=0.61;
p < .003) with an 8.3% increase in surface water area in a 100 km2 study area located near Kotze- bue, Alaska. Beaver influenced waterbodies accoun- ted for 66% of the observed increase in surface water area associated with various permafrost region land- forms that included drained thermokarst lake basins, thermokarst lakes, and beaded streams. Drained ther- mokarst lake basin flooding as a result of beaver dam building accounted for 68% of the increase in open water area in beaver influenced waterbodies and likely resulted in localized permafrost degrada- tion in and around the basin floors. In addition, dam building at thermokarst lake outlets resulted in both lake area increases through permafrost degradation driven lake expansion but also resulted in lake area decreases through beaver-induced lake drainage. Sim- ilar increases in the relative number of beaver dams across the northern Baldwin Peninsula indicate that increased dam building is a regional phenomenon.
Beavers should likely be incorporated into models of landscape change in permafrost regions and be con- sidered when interpreting surface water changes in Arctic and Boreal systems.
Environ. Res. Lett.15(2020) 075005 B M Joneset al
Acknowledgments
Funding for this research was provided by National Science Foundation grants OPP-1850578 (KDT and BMJ), NSF OPP-1806213 (BMJ), NSF OIA-1833056 (KDT and JAC), and NSF OIA-1929170 (BMJ). IN and GG were supported through ESA CCI+Perma- frost and HGF AI-CORE. DigitalGlobe, Inc. imagery provided by the University of Minnesota Polar Geo- spatial Center (PGC) through NSF OPP-1850578 grant.
Data availability statement
The data that support the findings of this study are openly available at the NSF-Funded Arctic Data Center.
ORCID iDs
Benjamin M Joneshttps://orcid.org/0000-0002- 1517-4711
Ken D Tapehttps://orcid.org/0000-0002-1039- 6868
Jason A Clarkhttps://orcid.org/0000-0002-4810- 5261
Ingmar Nitzehttps://orcid.org/0000-0002-1165- 6852
Guido Grossehttps://orcid.org/0000-0001-5895- 2141
Jeff Disbrowhttps://orcid.org/0000-0003-4659- 3406
References
Arp C D, Jones B M, Engram M, Alexeev V A, Cai L, Parsekian A, Hinkel K, Bondurant A C and Creighton A 2018
Contrasting lake ice responses to winter climate indicate future variability and trends on the Alaskan Arctic Coastal PlainEnviron. Res. Lett.13125001
Arp C D, Jones B M, Grosse G, Bondurant A C, Romanovsky V E, Hinkel K M and Parsekian A D 2016 Threshold sensitivity of shallow Arctic lakes and sublake permafrost to changing winter climateGeophys. Res. Lett.436358–65
Arp C D, Jones B M, Lu Z and Whitman M S 2012 Shifting balance of thermokarst lake ice regimes across the Arctic Coastal Plain of northern AlaskaGeophys. Res. Lett.39L16503 Berner L T, Jantz P, Tape K D and Goetz S J 2018 Tundra plant
above-ground biomass and shrub dominance mapped across the North Slope of AlaskaEnviron. Res. Lett.
13035002
Bockstoce J R 2009Furs and Frontiers in the Far North: The Contest among Native and Foreign Nations for the Bering Strait Fur Trade(New Haven, CT: Yale University Press) Bonney M T, Danby R K and Treitz P M 2018 Landscape
variability of vegetation change across the forest to tundra transition of central CanadaRem. Sens. Environ.21718–29 Borge A F, Westermann S, Solheim I and Etzelmüller B 2017
Strong degradation of palsas and peat plateaus in northern Norway during the last 60 yearsCryosphere111–16 Bowling L C, Kane D L, Gieck R E, Hinzman L D and Lettenmaier
D P 2003 The role of surface storage in a low-gradient Arctic watershedWater Resour. Res.391087
Brown D R, Brinkman T J, Verbyla D L, Brown C L, Cold H S and Hollingsworth T N 2018 Changing river ice seasonality and
impacts on interior Alaskan communitiesWeather, Clim., Soc.10625–40
Brubaker M, Bell J, Berner J, Black M, Chavan R, Smith J and Warren J 2011a Climate change in Noatak, Alaska strategies for community healthReport(Anchorage, AK: Alaska Native Tribal Health Consortium) (https://anthc.org/wp- content/uploads/2016/01/CCH_AR_062011_Climate- Change-in-Noatak.pdf)
Brubaker M, Berner J, Chavan R and Warren J 2011b Climate change and health effects in Northwest AlaskaGlob. Health Action48445
Burn C R 2002 Tundra lakes and permafrost, Richards Island, western Arctic coast, CanadaCan. J. Earth Sci.391281–98 Carroll M L, Townshend J, Dimiceli C, Loboda T and Sohlberg R
2011 Shrinking lakes of the Arctic Spatial relationships and trajectory of changeGeophys. Res. Lett.38L20406 Choi C 2008 Tierra del Fuego the beavers must dieNature453968 Cooley S W, Smith L C, Ryan J C, Pitcher L H and Pavelsky T M
2019 Arctic-Boreal lake dynamics revealed using CubeSat imageryGeophys. Res. Lett.462111–20
Gatti R C, Callaghan T V, Rozhkova-Timina I, Dudko A, Lim A, Vorobyev S N, Kirpotin S N and Pokrovsky O S 2018 The role of Eurasian beaver (Castor fiber) in the storage, emission and deposition of carbon in lakes and rivers of the River Ob flood plain, western SiberiaSci. Total Environ.
6441371–9
Grosse G, Jones B M and Arp C D 2013 Thermokarst lakes, drainage, and drained basinsTreatise in Geomorphologyvol 8(Amsterdam: Elsevier) pp325–53
Hamilton T D and Brigham-Grette J 1991 The last interglaciation in Alaska stratigraphy and paleoecology of potential sites Quat. Int.1049–71
Hinkel K M, Jones B M, Eisner W R, Cuomo C J, Beck R A and Frohn R 2007 Methods to assess natural and anthropogenic thaw lake drainage on the western Arctic coastal plain of northern AlaskaJ. Geophys. Res. Earth Surf.112F02S16 Hinzman L D, Bettez N D, Bolton W R, Chapin F S, Dyurgerov M
B, Fastie C L, Griffith B, Hollister R D, Hope A and Huntington H P 2005 Evidence and implications of recent climate change in northern Alaska and other arctic regions Clim. Change72251–98
Hood G A and Bayley S E 2008 Beaver (Castor canadensis) mitigate the effects of climate on the area of open water in boreal wetlands in western CanadaBiol. Conserv.141 556–67
Huston M M, Brigham-Grette J and Hopkins D M 1990 Paleogeographic significance of middle Pleistocene glaciomarine deposits on Baldwin Peninsula, northwest AlaskaAnn. Glaciol.14111–14
Jin S, Yang L, Zhu Z and Homer C 2017 A land cover change detection and classification protocol for updating Alaska NLCD 2001 to 2011Rem. Sens. Environ.19544–55 Jones B Met al2020 Identifying historic and future potential lake
drainage events on the western Arctic Coastal Plain of northern AlaskaPermafr. Periglac. Process.31110–27 Jones B M, Grosse G, Arp C, Jones M, Anthony K W and
Romanovsky V 2011 Modern thermokarst lake dynamics in the continuous permafrost zone, northern Seward Peninsula, AlaskaJ. Geophys. Res. Biogeosci.116G00M03 Jones B M, Tape K D, Nitze I, Grosse G, Arp C D and Zimmerman
C E 2018 Spying on tundra beavers with times series remote sensing data5th European Conf. on Permafrost(Chamonix Mont-Blanc, France, 23 June–1 July 2018)
Jongejans L L, Strauss J, Lenz J, Peterse F, Mangelsdorf K, Fuchs M and Grosse G 2018 Organic matter characteristics in yedoma and thermokarst deposits on Baldwin Peninsula, west Alaska Biogeosciences156033–48
Jorgenson M T, Romanovsky V, Harden J, Shur Y, O’Donnell J, Schuur E A, Kanevskiy M and Marchenko S 2010 Resilience and vulnerability of permafrost to climate changeCan. J.
Forest Res.401219–36
Jorgenson M T, Shur Y L and Pullman E R 2006 Abrupt increase in permafrost degradation in Arctic AlaskaGeophys. Res.
Lett.33L02503
Jorgenson M T, Yoshikawa K, Kanevskiy M, Shur Y, Romanovsky V, Marchenko S, Grosse G, Brown J and Jones B M 2008 Permafrost characteristics of AlaskaProc. of the 9th Int. Conf.
on Permafrostvol 3 (Fairbanks, AK: University of Alaska) pp 121–2
Jung T S, Frandsen J, Gordon D C and Mossop D H 2017 Colonization of the Beaufort coastal plain by Beaver (Castor canadensis) a response to shrubification of the Tundra?Can.
Field-Nat.130332–5
Lachenbruch A H, Brewer M C, Greene G W and Vaughn Marshall B 1962 Temperatures in permafrostTemperature;
Its Measurement and Control in Science and Industryvol 3 (New York: Reinhold Publishing Corporation) pp 791–803 Langer M, Westermann S, Boike J, Kirillin G, Grosse G, Peng S
and Krinner G 2016 Rapid degradation of permafrost underneath waterbodies in tundra landscapes—toward a representation of thermokarst in land surface modelsJ.
Geophys. Res. Earth Surf.1212446–70
Lewkowicz A G and Coultish T L 2004 Beaver damming and palsa dynamics in a subarctic mountainous environment, Wolf Creek, Yukon Territory, CanadaArct., Antarct., Alp. Res.
36208–18
Liljedahl A K, Boike J, Daanen R P, Fedorov A N, Frost G V, Grosse G, Hinzman L D, Iijma Y, Jorgenson J C and Matveyeva N 2016 Pan-Arctic ice-wedge degradation in warming permafrost and its influence on tundra hydrology Nat. Geosci.9312
McCulloch D and Hopkins D 1966 Evidence for an early recent warm interval in northwestern AlaskaGeol. Soc. Am. Bull.
771089–108
Myers-Smith I H, Forbes B C, Wilmking M, Hallinger M, Lantz T, Blok D, Tape K D, Macias-Fauria M, Sass-Klaassen U and L´evesque E 2011 Shrub expansion in tundra ecosystems dynamics, impacts and research prioritiesEnviron. Res. Lett.
6045509
Niittynen P, Heikkinen R K and Luoto M 2018 Snow cover is a neglected driver of Arctic biodiversity lossNat. Clim.
Change8997
Nitze I, Grosse G, Jones B M, Arp C D, Ulrich M, Fedorov A and Veremeeva A 2017 Landsat-based trend analysis of lake dynamics across northern permafrost regionsRem. Sens.
9640
Nitze I, Grosse G, Jones B M, Romanovsky V E and Boike J 2018 Remote sensing quantifies widespread abundance of permafrost region disturbances across the Arctic and SubarcticNat. Commun.95423
Nummi P, Vehkaoja M, Pumpanen J and Ojala A 2018 Beavers affect carbon biogeochemistry: both short-term and long-term processes are involvedMammal Rev.48298–311 Pastick N J, Jorgenson M T, Goetz S J, Jones B M, Wylie B K,
Minsley B J, Genet H, Knight J F, Swanson D K and Jorgenson J C 2019 Spatiotemporal remote sensing of ecosystem change and causation across AlaskaGlob. Change Biol.251171–89
Pietrek A G, Escobar J M, Fasola L, Roesler I and Schiavini A 2017 Why invasive Patagonian beavers thrive in unlikely habitats a demographic perspectiveJ. Mammal.98283–92
Pietrek A G and Fasola L 2014 Origin and history of the beaver introduction in South AmericaMastozool. Neotrop.21355–9
Rawlins M A, Cai L, Stuefer S L and Nicolsky D 2019 Changing characteristics of runoff and freshwater export from watersheds draining northern AlaskaCryosphere 133337–52
Riordan B, Verbyla D and Mcguire A D 2006 Shrinking ponds in subarctic Alaska based on 1950–2002 remotely sensed imagesJ. Geophys. Res. Biogeosci.
111G04002
Roach J, Griffith B, Verbyla D and Jones J 2011 Mechanisms influencing changes in lake area in Alaskan boreal forest Glob. Change Biol.172567–83
Rowland J, Jones C, Altmann G, Bryan R, Crosby B, Hinzman L, Kane D, Lawrence D, Mancino A and Marsh P 2010 Arctic landscapes in transition responses to thawing permafrost Eos, Trans. Am. Geophys. Union91229–30
Schuur E Aet al2015 Climate change and the permafrost carbon feedbackNature520171–9
Smith L C, Sheng Y, Macdonald G and Hinzman L 2005 Disappearing arctic lakesScience3081429–1429 Stafford J, Wendler G and Curtis J 2000 Temperature and
precipitation of Alaska 50 year trend analysisTheor. Appl.
Climatol.6733–44
Surdu C, Duguay C, Brown L and Fern´andez Prieto D 2014 Response of ice cover on shallow lakes of the North Slope of Alaska to contemporary climate conditions (1950–2011) radar remote-sensing and numerical modeling data analysis Cryosphere8167–80
Swanson D K 2019 Thermokarst and precipitation drive changes in the area of lakes and ponds in the National Parks of northwestern Alaska, 1984–2018Arct., Antarct., Alp. Res.
51265–79
Tape K, Sturm M and Racine C 2006 The evidence for shrub expansion in Northern Alaska and the Pan-ArcticGlob.
Change Biol.12686–702
Tape K D, Jones B M, Arp C D, Nitze I and Grosse G 2018 Tundra be dammed Beaver colonization of the ArcticGlob. Change Biol.244478–88
Turetsky M Ret al2020 Carbon release through abrupt permafrost thawNat. Geosci.13138–43
Vincent W F, Lemay M and Allard M 2017 Arctic permafrost landscapes in transition towards an integrated Earth system approachArct. Sci.339–64
Walker D A, Raynolds M K, Daniëls F J, Einarsson E, Elvebakk A, Gould W A, Katenin A E, Kholod S S, Markon C J and Melnikov E S 2005 The circumpolar Arctic vegetation mapJ.
Veg. Sci.16267–82
Walter Anthony K M, von Deimling T S, Nitze I, Frolking S, Emond A, Daanen R, Anthony P, Lindgren P, Jones B M and Grosse G 2018 21st-century modeled permafrost carbon emissions accelerated by abrupt thaw beneath lakesNat.
Commun.91–11
Ward Jones M K, Pollard W H and Jones B M 2019 Rapid initialization of retrogressive thaw slumps in the Canadian high Arctic and their response to climate and terrain factors Environ. Res. Lett.14055006
Yoshikawa K and Hinzman L D 2003 Shrinking thermokarst ponds and groundwater dynamics in discontinuous permafrost near Council, AlaskaPermafr. Periglac. Process.
14151–60