doi: 10.3389/fmars.2019.00032
Edited by:
Sanae Chiba, Japan Agency for Marine-Earth Science and Technology, Japan
Reviewed by:
Lluis Gomez-Pujol, Universitat de les Illes Balears, Spain Athanasios Kampas, Agricultural University of Athens, Greece
*Correspondence:
Justin J. H. Buck juck@bodc.ac.uk
Specialty section:
This article was submitted to Ocean Engineering, Technology, and Solutions for the Blue Economy, a section of the journal Frontiers in Marine Science
Received:31 October 2018 Accepted:21 January 2019 Published:28 February 2019
Citation:
Buck JJH, Bainbridge SJ, Burger EF, Kraberg AC, Casari M, Casey KS, Darroch L, Rio JD, Metfies K, Delory E, Fischer PF, Gardner T, Heffernan R, Jirka S, Kokkinaki A, Loebl M, Buttigieg PL, Pearlman JS and Schewe I (2019) Ocean Data Product Integration Through Innovation-The Next Level of Data Interoperability. Front. Mar. Sci. 6:32.
doi: 10.3389/fmars.2019.00032
Ocean Data Product Integration Through Innovation-The Next Level of Data Interoperability
Justin J. H. Buck1*, Scott J. Bainbridge2, Eugene F. Burger3, Alexandra C. Kraberg4, Matthew Casari3, Kenneth S. Casey5, Louise Darroch1, Joaquin Del Rio6, Katja Metfies4, Eric Delory7, Philipp F. Fischer8, Thomas Gardner1, Ryan Heffernan9, Simon Jirka10, Alexandra Kokkinaki1, Martina Loebl11, Pier Luigi Buttigieg12, Jay S. Pearlman13and Ingo Schewe12
1National Oceanography Centre, Liverpool, United Kingdom,2Australian Institute of Marine Science, Townsville, QLD, Australia,3Pacific Marine Environmental Laboratory, Office of Oceanic and Atmospheric Research, National Oceanic and Atmospheric Administration, Seattle, WA, United States,4Alfred-Wegener-Institut, Helmholtz-Zentrum für Polar- und Meeresforschung, Bremerhaven, Germany,5National Environmental Satellite Data and Information Service, National Centers for Environmental Information, National Oceanic and Atmospheric Administration, Silver Spring, MD, United States,
6Universitat Politècnica de Catalunya, Barcelona, Spain,7Oceanic Platform of the Canary Islands, Telde, Spain,
8Alfred-Wegener-Institute Helmholtz Centre for Polar and Marine Research, Shelf Sea System Ecology, Helgoland, Germany,
9Microsoft Corporation, Seattle, WA, United States,1052◦North Initiative for Geospatial Open Source Software GmbH, Muenster, Germany,11Alfred-Wegener-Institute Helmholtz Centre for Polar and Marine Research, Operations and Research Platforms, Bremerhaven, Germany,12Institute of Electrical and Electronics Engineers, Paris, France,
13Alfred-Wegener-Institute Helmholtz Centre for Polar and Marine Research, Tiefseeökologie und –technologie, Bremerhaven, Germany
In the next decade the pressures on ocean systems and the communities that rely on them will increase along with impacts from the multiple stressors of climate change and human activities. Our ability to manage and sustain our oceans will depend on the data we collect and the information and knowledge derived from it. Much of the uptake of this knowledge will be outside the ocean domain, for example by policy makers, local Governments, custodians, and other organizations, so it is imperative that we democratize or open the access and use of ocean data. This paper looks at how technologies, scoped by standards, best practice and communities of practice, can be deployed to change the way that ocean data is accessed, utilized, augmented and transformed into information and knowledge. The current portal-download model which requires the user to know what data exists, where it is stored, in what format and with what processing, limits the uptake and use of ocean data. Using examples from a range of disciplines, a web services model of data and information flows is presented. A framework is described, including the systems, processes and human components, which delivers a radical rethink about the delivery of knowledge from ocean data. A series of statements describe parts of the future vision along with recommendations about how this may be achieved. The paper recommends the development of virtual test-beds for end-to-end development of new data workflows and knowledge pathways. This supports the continued development, rationalization and uptake of standards, creates a platform around which a community of practice can be developed, promotes cross discipline engagement from ocean science through to ocean policy, allows for the commercial sector, including the informatics sector, to partner in delivering outcomes and provides a
focus to leverage long term sustained funding. The next 10 years will be “make or break”
for many ocean systems. The decadal challenge is to develop the governance and co- operative mechanisms to harness emerging information technology to deliver on the goal of generating the information and knowledge required to sustain oceans into the future.
Keywords: data standards, data democratization, end user engagement, data innovation, data integrity
INTRODUCTION
The Earth’s surface is 70% ocean, with 40% of humanity living within 100 kilometers of the sea and an even larger proportion reliant on ocean ecosystem services (UN, 2017).
Despite its central value to the lives of so many, fundamental information about how our oceans work is only available to a small community of scientists and operational experts.
Rapid developments in sensor technologies are providing greater volumes of valuable data than ever before, thus there is a pronounced need for innovation in providing access to a wider collection of stakeholders.
Improving global understanding of our oceans and their value will rely on innovation that removes barriers between each group of users (including potential users) and the marine data most relevant to their needs. This will require new information and data pathways which open up, adaptively structure, and explain complex ocean data to anyone who can generate value and knowledge from it. Simultaneously, improving the connectivity between data networks and facilitating the integration of new sensors will rapidly improve monitoring activities such as maritime safety (piloting and dredging), the prediction of ocean hazards such as Tsunamis, and the disentangling of natural variably from human-induced impact in the natural environment.
While the possibilities are immense, sizeable obstacles currently impede global, interdisciplinary, and inclusive progress. For example, the majority of oceanographic data available today are downloadable from web portals which have tailored their search interfaces and data products to highly specialized consumers, limiting generalized use and cross-boundary innovation. Data are also often available from disparate networks, in a variety of formats and with sparse or poorly structured metadata. Collectively, these issues greatly slow the discovery and use of ocean data, as well as the generation of downstream products and knowledge.
This paper examines the frameworks, standards, protocols and pathways required to break free of the current “portal and download” model of data access and move to a system based on interoperable services, allowing users to configure and apply varied yet compatible ocean data services to build their own knowledge systems. In particular, we explore solutions which will allow new data flows around models, artificial intelligence, and user-defined knowledge systems.
Under the banner of the “democratization of data,” a series of examples from other disciplines are dissected to look at what the framework needs to deliver and how this democratization is currently being done in other areas. The need to ensure that
data provenance, Quality Control (QC) information, appropriate use and attribution information are embedded in any data access workflow is fundamental to ensuring user trust in the data and any products generated and so the paper focuses on issues of cyber-security and provenance. The standards, protocols, technologies, and tools that link the various parts of the workflow into a true framework are also detailed along with a number of Use-Cases that demonstrate the current state of the art in ocean data systems. Finally, the vision of what this open access to data may look like and how it may work are presented along with a set of recommendations for advancing this over the next decade, or sooner.
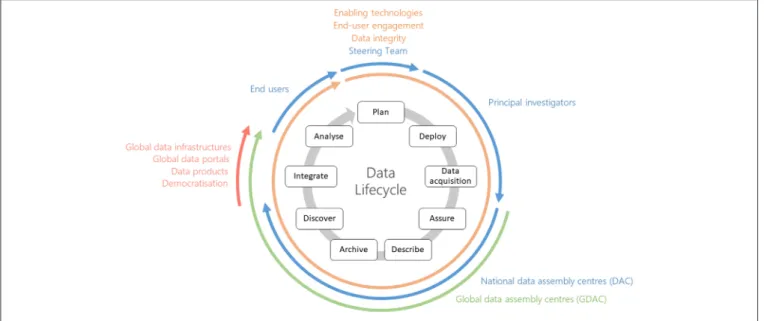
To provide context, a Data Life Cycle diagram is shown (Figure 1), which visualizes the various stages in data workflows from sensor to user, the roles and organizations involved and what structural units are required to deliver the workflow.
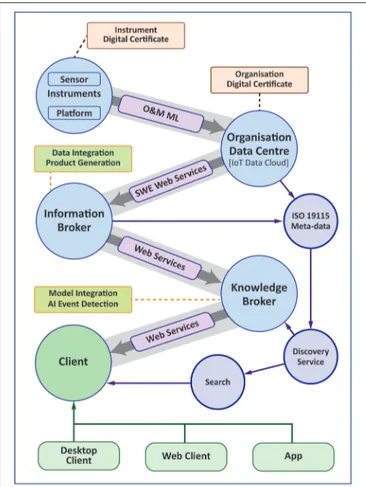
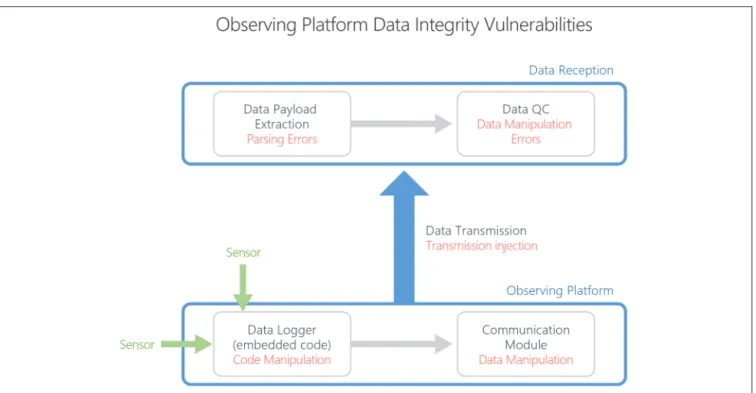
Figure 2is a schematic of what a future work-flow may look like with the concepts of information and knowledge brokers introduced as key parts of the work-flow. Finally,Figure 3shows how data integrity is delivered by the work-flow, particularly from sensor to data center, and how this may be secured.
The coming decade will see rapid advances in our ability to collect data, the challenge is to develop the frameworks and work flows to similarly increase the conversion of data to information, to facilitate and encourage the uptake and use of the data, and to ensure that the decisions that impact the state of the oceans in 10 years are based on creditable, defensible, understood data generated from high quality sustained observations.
DEMOCRATIZATION OF DATA
The democratization of data is the process of making data that is difficult or complex to find, understand and use, available to anyone in a way that makes sense to them. Given that most ocean data are funded by various national and international government programs, there is an expectation that publicly funded data should be freely and easily available to the public:
data paid for by the people for use by the people. For most ocean data this is currently not the case. The idea behind data democratization is to change this.
While there have been efforts to make ocean data freely available, via portals and other mechanisms, there are still substantial barriers to entry for people outside the ocean community. Even within the ocean community barriers exist;
for example, most biologists struggle to use file formats such as NetCDF. For simple data sets, such as satellite-derived Sea
FIGURE 1 |Roles and processes involved in the data lifecycle.
Surface Temperature1, there are numerous sites with varying products, making it difficult for non-experts to understand. If ocean data is to impact how we use, manage and sustain our oceans then it needs to be available in a form that provides value and satisfies the needs of end users from all communities. This democratization of data requires a new paradigm for how data is converted into information, and ultimately knowledge, which leverages new information frameworks and rethinks how people use and gain value from data.
An example from the marine community where effort toward democratization of data has begun is the MedSea project2(Ziveri, 2014). The EMODnet Med Sea checkpoint3is a Mediterranean Sea wide monitoring system and assessment activity based upon targeted end-user applications including windfarm siting, managing marine protected areas, detecting oil platform leakage, climate and coastal protection, fisheries management, marine environmental management, and monitoring river inputs to the coastal environment. The goal was to provide a basis for rational decision-making, assessing the status of the Mediterranean Sea observing and modeling infrastructure, analyzing gaps, and identifying priorities to optimize regional monitoring and sampling strategies. Examples of applications of this work are oil spill management and safer professional and recreational activities (Liubartseva et al., 2016; Coppini et al., 2017). Other related but less mature EMODnet activities for different regions that are illustrative of European policy are for the Atlantic as part of the AtlantOS project (Koop-Jakobsen et al., 2016) and North Sea Checkpoint project4.
The new paradigm looks to reverse how ocean data is traditionally accessed and used. In this paradigm the user defines
1https://podaac.jpl.nasa.gov/SeaSurfaceTemperature
2http://medsea-project.eu/
3http://www.emodnet.eu/med-sea-checkpoints
4http://www.emodnet.eu/northsea/home
the way the information derived from data is converted to knowledge. The end users are empowered to create knowledge relevant to their own needs from the data and information provided. This is the reverse of traditional systems where the custodian of the data pre-defines the use and constraints of the data and in so doing defines the knowledge that can be extracted.
The knowledge a shipping company extracts from current data may be very different to that a marine insurance company, local sailor, or fisherman derives.
The new paradigm is built around Data as a Service (DaaS), where data sets are made available as fully-described, web- enabled data streams. This removes the need to download data from a portal or data store, to know what data exists and where it resides, to be able to understand and decode the storage format and to manually convert it to a form that adds value to the end user (such as changing units, datum, etc.). The DaaS concept enables machine systems to discover, access and deliver data, providing an underlying set of services on which information systems can be built (Terzo et al., 2013).
So how would this work and what would it look like? Four examples are given, showing a range of models from currently existing systems, including how the data is arranged and sourced, how the system adds value, and how it is supported by an underlying business model.
Google Scholar5 provides a single interface for finding and accessing scientific literature as well as tools for citing publications. The system uses “GoogleBots” or web “crawlers”
to extract information from publishers’ web sites and collate it into a form suitable for public access and use. The data source is therefore un-federated (no single source of data) and the extraction is passive from the point of the data custodian. The system adds value by providing a single point of access to the
5https://scholar.google.com/
FIGURE 2 |Workflow diagram showing the role of information and knowledge brokers.
scientific literature and by providing tools, such as searching, download links and citation tools, to facilitate access and use of the data. The business model for the underlying publisher is either a “pay to publish” model where the author pays the journal to publish the article and generally access is free and open, or a “pay to access” model where the author gets published for free and so pays no fees to the journal but the journal charges for access. For Google the business model is increased web traffic and related advertising revenues along with providing public good.
The second example is AccuWeather6, which exemplifies the operation of many other weather websites. Here the data is federated from a relatively small number of defined sources, mostly meteorological agencies, providing structured data streams, either for free or for a small fee as part of their charter.
These sites add value by presenting the data in easy-to-use ways, by combining data from a number of data streams (such as up-to-date temperatures, medium- and long-range forecasts, weather radars, etc.) and by using sophisticated delivery platforms (Apps) to allow users to tailor the information they
6https://www.accuweather.com/
want (such as by defining locations of interest, display units and updates/alerts).
Another example is from the financial world. The StockCharts7 site again uses a small number of federated, well-defined, machine-readable data streams to drive complex charting and analysis software. The site adds value through the analysis and charting engine but also by allowing extensively customization of the data. Users can annotate charts, construct watch lists, create alerts and notifications and access social media through blogs and on-site forums, where the user can gain and distribute knowledge relevant to their interest or need. This allows the construction of a sophisticated knowledge system around the source data via complex user-defined visualizations combined with the ability to access and contribute to a knowledge community.
The most sophisticated examples given are all based on a similar model of how data is sourced, accessed and then transformed into information for the user to extract knowledge from. The models typically include the following components or attributes:
1. While there may be many data sources, they are federated through a small number of providers, brokers or “clearing houses,” allowing services to be built around a relatively small number of providers;
2. The data are pre-processed and packaged into standardized products that are structured to reflect the information contained within the data (for example, ocean temperatures can be processed into daily averages, climatologies, hot spot values, temperature accumulation values, surface values, daily min/max, etc.);
3. Full metadata is provided in a machine-readable form so that data discovery can be done via automated harvesting rather than manual searches;
4. Visualization and analysis engines are used to allow user interaction with the data such as extrapolating trends, setting alerts for user defined events (e.g., temperature thresholds being exceeded), producing climatologies and other statistics;
5. Models are used to synthesize data, to fill holes (such as the Buoyweather site, which uses models to deliver location- specific forecasts) and to provide higher level products such as forecasts;
6. A range of other resources are presented, in particular access to a community of practice, that allows the user to extract and create knowledge and associated value;
7. The systems use sophisticated platforms, such as Apps, to deliver content where the user can define a knowledge environment in which the information is contextualized and delivered.
A workflow that supports these ideas is shown inFigure 2where information and knowledge brokers federate data from a number of sources, process it into standardized products and then deliver these via services to a range of clients.
7https://stockcharts.com
FIGURE 3 |Data integrity vulnerabilities in an example data workflow scenario.
The best example of data democratization is Google Earth8. Google Earth, via the Google Earth Engine, Google Earth client and Google Maps, uses many of the components of the other examples, such as a few federated sources of source data and complex visualizations, but extends these in unique ways that together have changed how people access and use spatial data.
These include:
• The user is totally abstracted from the source data (satellite images) with the system providing the initial processing and presentation. The user just gets to interact with the information in the system, not the data.
• The system allows extensive customization by the user with the ability to add layers, points, images and overlays easily so that, like the financial systems, the user creates a knowledge environment that reflects and contextualizes the knowledge they need to extract from the information;
• Google has built an easy to use import/export format (KML/KMZ), which allows other systems to integrate into their platform; this in particular allowed other companies and agencies to interact and be part of the information system;
• Google also created and promoted a full open API, allowing others to build systems and solutions around Google Earth and to build knowledge solutions that add value and which reflect a particular need or community;
• Google created and made freely available a range of clients from “thick” traditional PC clients to “thin” web systems to Apps, allowing anyone to use the system.
8https://www.google.com.au/earth/
The key point is that Google has abstracted the user from the source data and all of the complexities of purchasing, accessing, storing, processing, and visualizing satellite data. It then made the system open, via the API, the KML/KMZ import/export file and by making a range of clients available for no cost, which gave a path for the commercial and other sectors to invest in the system.
A key part of the above examples is the idea of a broker or clearing house. Brokering, in this instance, is accomplished by bridging technology that spans the gaps between the conventions of two different disciplines, enabling interoperability without levying additional requirements on either end (Nativi et al., 2013). In this role, brokers are able to unify or cross-map differing standards, formats and protocols, add value by enabling data discoverability, map domain specific knowledge and terminology across disciplines, and provide tools for data uptake and use.
Effectively data brokers provide an interoperability layer by abstracting the input and output layers from each other, allowing users from one domain to access and use data from another.
This model however, has a number of potential issues. The first revolves around data quality, security, and provenance. Unlike relatively simple share price data, the collection, processing and use of environmental data is often complex, with a knowledge of the domain required to understand what is and what is not appropriate use. The potential for misuse, intentional or otherwise, is significant (as it is with share price data, which has extensive legal controls around access and use). The act of federating the data means that the connection between the data provider and the data user is lost, along with the ability to communicate the limitations, assumptions and complexities of the data to the end user. In science this is problematic;
indeed, many meteorological agencies are exempted from legal responsibility for the forecasts they provide for this very reason.
The second problem is more practical; how to build and sustain such a system. While much of the ocean data collected is amassed by publicly funded agencies, they are often either not operational agencies (and so not set up to deliver operational data products) or the data is collected under complex project arrangements that vary in life-span, resourcing and activity.
Unlike the meteorological community, where there are agencies funded to produce publicly-available long-term data sets, the ocean community is more fragmented with responsibility shared across a range of research and operational agencies. Coupled with this is a complex political and funding landscape that makes it hard to establish and sustain multi-decade programs and infrastructure.
Developing a business model that supports and sustains data and information systems is not trivial and, while the monetization of data is not an area which the science community tends to explore, it is one that needs to be considered.
Partnerships with the commercial sector are one way to build sustainability models that ensure continuity of data and information although reliance on a commercial partner has its own issues.
Importantly, the framework needs to also work in reverse.
The framework needs to provide information to data custodians about who is using their data, what pathways and workflows they are using, what end products or information are being generated and what value is being created. The framework needs to be structured so that there are feedback components that measure attribution and deliver credit. Coupled with this is the idea of governance; how the various parts of the framework are governed, controlled, updated and maintained and how credit, resources and attribution are generated and delivered. To be sustainable every party involved needs to understand “what’s in it for them”; that is be able to measure the value generated by being an active partner in the framework and how this translates into real-word resources and returns.
USER TRUST—DATA INTEGRITY AND SECURITY
Users of scientific or operational data retrieved from credible institutions expect it to accurately represent the phenomenon that was measured in the field or the laboratory. Following collection, the transmission, quality control, and all subsequent processing of this data should not detract from its accuracy.
Such quality requirements are also held by data providers, who build their reputations around the validity and verifiability of their holdings. Quality data typically results from the application of community best practices across its lifecycle.
Similar community standards also guide the documentation and contextualization of data, as the usability of even the best data is compromised without well-structured metadata and descriptions of provenance. Ensuring the integrity of the data (avoiding data corruption) is especially important for data that are to be stored in perpetuity and intended for future reuse. Integrity and
consistency build a foundation of trust essential for information to be used in policy formation and for reliable monitoring of change.
While not an exhaustive treatment, this paper highlights the critical importance of data integrity and its impact on users’
trust. A timely and important example involves the data used to understand the anthropogenic effects on our environment and climate. Any malicious attempt to cast doubt on climate science simply has to undermine the integrity of a discipline’s data, or even a relatively minor fraction of it. The well-publicized
“Climategate” event is indicative of the distraction that can be caused by casting doubt on data or its providers. To guard against such efforts, data integrity has to be transparently confirmed, corroborated, and well-documented throughout its lifecycle. This documentation needs to be readily accessible to the public as part of standard provenance metadata. Where possible, the provenance and quality control data should be bound with the raw data (e.g., via digitally signed data sets and with the provenance and data set QC data embedded in the raw data format) rather than exist in separate metadata systems. In the latter case, key metadata on provenance and quality can too easily be decoupled from raw data sets, to the detriment of all.
Data integrity can be affected through the entire lifecycle of the data, from the initial measurement, to the logging, through the remote platform transmission and payload decoding, to the quality control and long-term storage (seeFigure 3). To a large extent, data integrity preservation is integrated into the various technical tools used to move data through its stages of the data lifecycle. For example, rsync and sftp include built-in data integrity checks during file operations. However, not all tools do this and it is evident that gaps or vulnerabilities exist at various steps of the data lifecycle that can potentially affect data integrity.
Internet Connected Instrumentation
Increasingly, scientific and operational instrumentation is connected directly to the internet via Wi-Fi, cellular, or satellite communications. These so-called Internet of Things (IoT) devices commonly use off-the-shelf technologies for data collection, encryption and transmission. This approach differs from comparable instrumentation and data logging devices from previous generations. While the promise of low-cost, easily configured and deployed devices is attractive to the ocean community for obvious reasons, IoT security is in its infancy.
IoT devices with UNIX-like operating systems provide all the benefits and weaknesses of a typical desktop machine. Software vulnerabilities of IoT devices have become a prime target for malicious operators looking for ways to gain tangible benefits or disrupt the system for its intended user. Systems with no traditional operating system, or “bare-metal” IoT devices, can be similarly exploited.
Observing Platform Connectivity
Communications from observing platforms to data centers use a variety of technologies and protocols. While this paper cannot discuss the security profile of all communication protocols, we will highlight overarching themes and considerations. A major consideration for the data community is the risk that
the communication platform and protocol presents not only to the integrity of the data while in communication transit, but also the vulnerability of the observing platform technologies, such as the data logging platform or sensor, discussed above.
The objective is to ensure safe passage of the data, but also to ensure the communication technology is adequately detached from others on its platform to prevent its use as a vector by which the data collection platform is compromised. Attempted compromises of popular satellite communications platforms are well-documented. Global Wi-Fi is an exciting promise for operators on remote observing platforms but the application of off-the-shelf technologies demands data transmission security best practice to ensure secure passage and preserve the integrity of the data received by observing system operators. Safe passage of data is not unique to data platform operators, and industry practices, such as BlockChain, should be investigated and deployed where applicable. These methods should be cataloged and preserved in the platform metadata.
Vulnerability Management
Software solutions, such as operating systems, IoT device drivers, encryption libraries and data analysis applications are used at virtually every stage of ocean observation and data dissemination. Like nearly all software, these solutions contain security vulnerabilities and are therefore a potential entry point for a breach where malicious code or actors could compromise the data or systems. Further, even otherwise secure software can become vulnerable when configured or operated incorrectly.
In order to manage these vulnerabilities, system owners should have a process in place for detecting, tracking, prioritizing and remediating them. Should one or more of these vulnerabilities be exploited and result in an incident, the system owner should have an incident response process. Guidelines for these controls are outlined in NIST SP 800-53 Rev. 5. In the same way, groups that develop software solutions should follow a secure development process in order to minimize the number and severity of vulnerabilities. Guidelines for these controls can be found in NIST SP 800-64 (Kissel et al., 2008).
Data Quality Control (QC)
Data quality control seeks to identify and highlight data elements unrepresentative of the environment measured or outside the expected ranges produced by a processing routine. Best practices for data quality control are well-documented for many variables, but often scattered across the web. To help remedy this, the UNESCO/IOC-IODE Ocean Best Practices system9 is consolidating access to these and other methods in a sustained archive (as described in section Developments in Tools and Standards). As these best practices become more systematically archived and available, the community should embrace well- established and uniquely referenceable QC processes. QC is a critical step to identify deviations from established norms in data.
Integrity of processes and workflow elements discussed above should eliminate any concerns about unintended or malicious
9http://www.oceanbestpractices.org
manipulation of data. The lack of these controls can cast doubt not only on a simple variable, but an entire data collection.
Long-Term Archives
Formal long-term archives play a critical role in ensuring data integrity for many data sets, for many users, over many generations. Many or perhaps most formal environmental data archives attempt to adhere to the standards and practices documented in the Open Archival Information System Reference Model (OAIS-RM10). The OAIS-RM establishes a set of responsibilities and functions that an Archive should commit to and perform, along with a common terminology for discussing these archival functions with stakeholders. Within the OAIS- RM, clear functions designed to assure data integrity (what the OAIS-RM calls Data Fixity) are included, and Data Fixity documentation is a key component of the Preservation Description Information (PDI) for every archival package.
While archives ensure Data Fixity, or integrity, in multiple ways, they also address other important types of PDI to ensure data remain useful and meaningful over time. Even if actual bit-level corruption is avoided, data loss can occur through other means. In addition to Data Fixity information, OAIS archives also work to ensure every archive package includes Reference, Context, Provenance and Access Rights Information at a minimum, to ensure data remain viable over the long term.
Reference information includes the use of persistent identifiers like Digital Object Identifiers (DOIs) and taxonomic identifiers to describe and uniquely reference the archived content. Context information addresses why the data were collected and how they relate to other archived packages. Provenance information captures the history of the preserved data, and, via an Access Rights document, details who can access and interact with the data. Without all this information, data “corruption”—in the sense of losing the ability to trust the data—will occur.
The importance of archives, and the trust users place in them, has led to a range of independent archive certification processes.
A popular example is the Core Trustworthy Data Repository certification11, offered by the Data Archiving and Networked Services archive and the International Council for Science (ICSU) World Data System (WDS). Together, the OAIS-RM and the various certification processes give users confidence that critical issues such as data integrity have been addressed by the archive.
End User Data Delivery
Ambiguity caused by multiple data centers and third-party hosts having different versions of data is becoming an issue requiring management. If the data are to be used in decision making then users need to be sure they have the definitive version. When copies of data are re-exposed to the web via third parties there is a long-term overhead in ensuring that the most pertinent version of data is maintained. Distributed ledger technology such as Blockchain may be a potential solution to this issue (see:
IEEE special report on blockchain12). In a distributed ledger
10https://public.ccsds.org/pubs/650x0m2.pdf
11https://www.icsu-wds.org/services/certification
12https://spectrum.ieee.org/static/special-report-blockchain-world
data are effectively assigned a fingerprint, which evolves as data versions evolve. This allows full data lifecycle and versions to be understood by users. The technology is mature for applications like Bitcoin but untested for tracking data provenance. There are also key questions to address such as: Is the high computation and energy cost justifiable for our applications? Can this process be done at sensor level, to cover the full data lifecycle? Also, the data become immutable when placed in a distributed ledger system.
This is good from the perspective of long-term integrity but care is required with personal or sensitive data.
ENABLING TECHNOLOGIES
Oceanographic data are disseminated and exposed to the web at a range of levels from local, single institution websites and services to regional scale infrastructures and activities.
Regional level infrastructures and activities include National Ocean and Atmosphere Administration (NOAA), National Centers for Environmental Information13 (NCEI) and the developmental EarthCube14 project in the USA, SeaDataNet15 and EMODnet16 in Europe, and the Australian National Data Service17 (ANDS) and the Australian Ocean Data Network18 (AODN). Despite continental boundaries, projects such as the in Ocean Data Interoperability Platform19 (ODIP) work to harmonize international data efforts in the marine community.
This section will describe many of the technologies used to harmonize data exposure to the web and emerging trends.
Developments in Tools and Standards
The technologies that will underpin automated data collection, processing and dissemination have been evolving for the last two decades and currently exist across a range of maturity levels.
This section will focus on key enabling technologies that have the potential to underpin the data revolution this paper presents, looking at current technology before moving on to look at trends and developments.
A key advance is the introduction of Application Programming Interfaces (API). An API is a set of functions and procedures for creating applications that access the features or data of an operating system, application or other service. The modern API was first demonstrated by Roy Thomas Fielding in 2000 (Fielding, 2000), with commercial applications introduced by eBay and Amazon later that year. APIs are now ubiquitous on the internet. Their key benefit is in allowing services and data hosted by an organization to be accessed “machine to machine”; an example would be the display of dynamically sourced data from one organization on another organization’s website, connected using common protocols.
The use of standardized services places new requirements on how data and information are exposed to the web, as the content has to be machine readable. A simple example:
13https://www.ncei.noaa.gov/
14https://www.earthcube.org/
15https://www.seadatanet.org/
16http://www.emodnet.eu/
17https://www.ands.org.au/
18https://portal.aodn.org.au/
19http://www.odip.eu/
what is Practical Salinity called within my dataset? Numerous terms have been used that are readily understandable to the human reader e.g., psal, salinity, Salinity, sal, etc. However, these are subject to typographic errors and ambiguities e.g. the salinity reference scale associated with a particular data channel.
Controlled vocabularies have been introduced to address these issues, e.g., the Climate Forecast (CF) standard names (sea_water_practical_salinity20). or the European P01 vocabulary used in the SeaDataNet infrastructure (PSALST0121). In the case of SeaDataNet, the vocabularies are audited and published on the NERC Vocabulary Server (NVS 2.0) in the machine- readable, Simple Knowledge Organization System (SKOS) with standardized APIs for querying and delivering terms (REST, SOAP and SPARQL). Many of these vocabularies are also semantically linked to local or external vocabularies, so a user (or machine) can identify similar or related terms. Importantly, the standardization and formalization of descriptors using controlled vocabularies and SKOS modeling is providing the foundation for further innovation in ocean informatics. The application of knowledge representation methods and highly expressive semantic technologies using the Web Ontology Language (OWL) is allowing machine agents to more flexibly handle multi- and interdisciplinary data (see Trends and the future of tools and standards).
Further to the use and importance of standards, standardizing the encoding of metadata and data themselves will be crucial if data are to be readily usable by machines or dataset aggregations.
The Ocean Data View and SeaDataNet activities have introduced a standard ASCII representation of data. For multidimensional and larger datasets based on binary formats, key advances have included the introduction of the CF-NetCDF standards and the Attribute Convention for Dataset Discovery (ACDD). Elements of CF-NetCDF and ACDD have been used in NetCDF formats developed by community observing programs (Ocean SITES data management team, 2010; Argo Data Management Team, 2017;
EGO gliders data management team, 2017). Concurrently, the OGC has developed Sensor Web Enablement (SWE) standards including SensorML for sensor metadata and Observations and Measurements (O&M) for sensor data. These are XML-based representations but are readily converted to other formats such as JSON. The breadth of data and metadata standards are described inTable 1.
Best practices (Pearlman et al., 2017a) complement standards in supporting improved interoperability and data/information exchange. A community best practice is defined as a methodology that has repeatedly produced superior results relative to others with the same objective. To be a best practice, a promising method will have been adopted and employed by multiple organizations. Best Practices may occur in a number of areas—standard operating procedures, manuals, operating instructions, etc., with the understanding that the document content is put forth by the provider as a community best practice (Simpson et al., 2018). As with standards, the benefits for ocean data include improved consistency and interoperability
20http://cfconventions.org/Data/cf-standard-names/58/build/cf-standard-name- table.html
21http://vocab.nerc.ac.uk/collection/P01/current/PSALST01/