Dynamics of G-Protein coupled Receptors
Dissertation
zur Erlangung des wissenschaftlichen Grades Doctor rerum naturalium
(Dr. rer. nat.)
vorgelegt der
Fakult¨at Mathematik und Naturwissenschaften der Technischen Universit¨at Dresden
von
Stefanie Eichler
geboren am 09.10.1982 in Frankfurt (Oder)
Gutachter:
Prof. Dr. Stefan Diez, TU Dresden Prof. Dr. Peter Hildebrandt, TU Berlin
F¨ur die Aufkl¨arung der molekularen Wirkungsweise von physiologischen, auf Signal- transduktion, d. h. dem Zusammenspiel von extrazellul¨aren Reizen und membrange- bundenen Rezeptoren, beruhenden Prozessen ist das Verst¨andnis der Funktion von Membranproteinen unerl¨asslich.
In dieser Arbeit werden von Rhodopsin abgleitete, synthetische transmembrane Seg- mentpeptide, Opsin-Mutanten und der vollst¨andige Photorezeptor Rhodopsin un- tersucht, um die physikalischen Prozesse zu beleuchten, die der Funktionen dieses prototypischen Klasse-A G-Protein gekoppelten Rezeptors zugrunde liegen.
Die Abh¨angigkeit der Membranprotein-Hydratation und der Lipid-Protein-Wech- selwirkung von der Ladung einer Aminos¨auren-Seitenkette wird erforscht. Hierzu werden synthetische, transmembrane Segmentpeptide in Lipid und Detergenz, als Modell transmembraner Segmente von Rhodopsin in der Membran mittels Fluo- reszenzspektroskopie untersucht. Aus den erhaltenen Ergebnissen wird ein thermo- dynamisches und strukturelles Modell hergeleitet, welches die Kopplung der Pro- tonierung des hochkonservierten ERY-Motivs in Transmembranhelix 3 von Rho- dopsin an die Restrukturierung der Helix in der Mikroumgebung der Lipid-Wasser- Phasengrenze erkl¨art. Des Weiteren werden sowohl die Segementpeptide als auch die vollst¨andigen Systeme Opsin und Rhodopsin mittels zeitaufgel¨oster FTIR-Fluores- zenz-Kreuzkorrelations-Hydratations-Modulation untersucht. Diese Technik wurde eigens zur Aufkl¨arung von zeitabh¨angigen Hydratationseffekten auf Lipide und Pro- teine oder Peptide entwickelt. Dabei werden zeitaufgel¨oste FTIR Differenz-Spektren und gleichzeitig statische Fluoreszenzsignale aufgenommen und diese zeitabh¨angigen multispektralen Datens¨atze mittels 2D Korrelation analysiert. Die Auswertung der Experimente enth¨ullt einen sequentiellen Hydratationsprozess. Dieser beginnt mit der Bildung von Wasserstoffbr¨uckenbindungen an der Carbonylgruppe des Lipids, gefolgt von Struktur¨anderungen der Transmembranproteine und abgeschlossen durch das Eindringen von Wasser in das Proteininnere. Letzteres wird nachgewiesen durch die Fluoreszenz von Tryptophan im hydrophoben Peptid- oder Proteininneren.
Die Ergebnisse dieser Arbeit unterstreichen die Annahme, dass Lipid-Protein-Wech- selwirkungen eine entscheidende Rolle in der Funktion von Membranproteinen spie- len und das insbesondere Elektrostatik, in Form von Ladungen an der Phasengrenze, und die Hydratisierung einen kritischen Einfluss auf diese Funktion haben.
Understanding the function of membrane proteins is crucial to elucidate the molec- ular mechanisms by which transmembrane signaling based physiological processes, i. e., the interactions of extracellular ligands with membrane-bound receptors, are regulated.
In this work, synthetic transmembrane segments derived from the visual photore- ceptor rhodopsin, the full length system rhodopsin and mutants of opsin are used to study physical processes that underlie the function of this prototypical class-A G-protein coupled Receptor.
The dependency of membrane protein hydration and protein-lipid interactions on side chain charge neutralization is addressed by fluorescence spectroscopy on syn- thetic transmembrane segments in detergent and lipidic environment constituting transmembrane segments of rhodopsin in the membrane. Results from spectroscopic studies allow us to construct a structural and thermodynamical model of coupled protonation of the conserved ERY motif in transmembrane helix 3 of rhodopsin and of helix restructuring in the micro-domain formed at the protein/lipid water phase boundary.
Furthermore, synthesized peptides and full length systems were studied by time resolved FTIR-Fluorescence Cross Correlation Hydration Modulation, a technique specifically developed for the purpose of this study, to achieve a full prospect of time-resolved hydration effects on lipidic and proteinogenic groups, as well as their interactions. Multi-spectral experiments and time-dependent analyses based on 2D correlation where established to analyze large data sets obtained from time-resolved FTIR difference spectra and simultaneous static fluorescence recordings. The data reveal that lipids play a mediating role in transmitting hydration to the subsequent membrane protein response followed by water penetration into the receptor structure or into the sub-headgroup region in single membrane-spanning peptides carrying the conserved proton uptake site (monitored by the fluorescence emission of hydropho- bic buried tryptophan).
Our results support the assumption of the critical role of the lipid/water interface in membrane protein function and they prove in particular the important influence of electrostatics, i. e., side chain charges at the phase boundary, and hydration on that function.
Symbols and Abbreviations vii
1 Introduction 1
1.1 Electrostatics of membranes . . . 1
1.2 Membrane hydration . . . 3
1.3 G-Protein coupled Receptors . . . 4
1.4 Rhodopsin . . . 7
1.5 The D(E)RY motif . . . 7
2 Goals of the study 13 3 Methods and Materials 14 3.1 Spectroscopic Methods . . . 14
3.1.1 UV/Vis Spectroscopy . . . 14
3.1.2 Circular Dichroism spectroscopy . . . 16
3.1.2.1 Magnetic Circular Dichroism . . . 17
3.1.3 Fluorescence Spectroscopy . . . 18
3.1.3.1 F¨orster Resonance Energy Transfer (FRET) . . . 20
3.1.4 FTIR Spectroscopy . . . 21
3.1.4.1 ATR-FTIR difference spectroscopy . . . 23
3.1.4.2 Infrared studies on Rhodopsin . . . 25
3.1.4.3 Fluorescence-FTIR Cross Correlation Spectroscopy . 27 3.1.4.4 FTIR spectra correction . . . 29
3.1.4.5 Estimation of water content in hydrated films . . . . 36
3.1.4.6 Quantitation of the protein or peptide response to hydration modulation . . . 38
3.1.4.7 2D Cross Correlation . . . 39
3.2.2 Rhodopsin . . . 44
3.2.3 Opsin mutants . . . 44
3.2.4 Miscellaneous . . . 44
3.3 Preparative Methods . . . 45
3.3.1 Sample preparation for fluorescence, UV and CD studies . . . 45
3.3.2 Sample preparation for FTIR-Fluorescence Cross Correlation Hydration Modulation . . . 46
4 Results and Discussion 48 4.1 Modular switching and lipid/water restructuring . . . 48
4.1.1 Fluorescence difference spectroscopy studies . . . 51
4.1.2 FRET studies . . . 55
4.1.3 Discussion . . . 59
4.2 Lipid/Water interactions in protein function . . . 76
4.2.1 Hydration modulation on TM3-derived Peptides . . . 76
4.2.2 Hydration modulation on rhodopsin in dark and light exposed state . . . 90
4.2.3 Hydration modulation on opsin mutants . . . 103
4.2.4 Discussion . . . 109
5 Conclusions 114
Bibliography 116
Acknowledgement 123
Versicherung 124
[A] concentration of A
ATR attenuated total reflection
BTP bis(2-hydroxyethyl)iminotris(hydroxymethyl)methane
CD circular dichroism
DANSYL-PE headgroup labeled phospholipid (see chapter 3.2)
DM n-dodecyl-β-D-maltoside
DOPC 1,2-Dioleoyl-sn-Glycero-3-Phosphocholine
DTT Dithiothreitol
EDTA Ethylenediaminetetraacetic acid
ERY or D(E)RY conserved amino acid motif in TM3 of rhodopsin
ε extinction coefficient
FRET F¨orster Resonance Energy Transfer FTIR Fourier-transformed infrared
∆G change of Gibbs free energy GPCR G-protein coupled receptor
GDP, GTP guanosine diphosphate, guanosine triphosphate; nucleotides
IR infrared
kB Boltzmann constant
KA association constant of A
LED light-emitting diode
MCD magnetic circular dichroism
MI, MII, MIII Metarhodopsin I, II and III state of rhodopsin
ND Opsin mutant N2C, D282C
NED Opsin mutant N2C, E134Q, D282C
NEEMD Opsin mutant N2C, E113Q, E134Q, M257Y, D282C OG n-octyl-β-D-glucopyranoside
PC L-α-phosphatidylcholine
pKA acid dissociation constant at negative logarithmic scale
T temperature
Θ, [Θ]mrw, [Θ]mol ellipticity, mean residue ellipticity, molar ellipticity
TM transmembrane
TM3 transmembrane helix III
UV ultraviolet
A Alanine Ala
C Cysteine Cys
D Aspartic Acid Asp E Glutamic Acid Glu F Phenylalanine Phe
G Glycine Gly
H Histidine His
I Isoleucine Ile
K Lysine Lys
L Leucine Leu
M Methionine Met
N Asparagine Asn
P Proline Pro
Q Glutamine Gln
R Arginine Arg
S Serine Ser
T Threonine Thr
V Valine Val
W Tryptophan Trp
Y Tyrosine Tyr
The biological membrane plays a pivotal role in the living organism. Even the smallest living unit, the cell, needs a membrane to establish a border between the interior and the outside world. But a membrane does not only act as a protective barrier, it also fulfills various other vital functions, such as sustaining gradients of e. g. salt concentration. Moreover, embedded membrane proteins enable the membrane to actively recognize molecules, signal transduction, generate enzymatic activity and transport substances like nutrients.
In this work, focus will lie on signal transduction mechanisms associated with two special features: electrostatics of membranes and membrane hydration.
1.1 Electrostatics of membranes
The net charge of a biological membrane is usually negative due to native charged lipids and membrane proteins which have in most cases negative isoelectric points.
Around a charged surface a diffuse neutralizing ion cloud is formed. Taking thermal movement of ions into account, the solution of Poisson-Boltzmann equationfor a flat charged surface in water is the so called Gouy-Chapman layer. Outside of this diffuse layer the charge of a membrane is not sensed unlike charges in air which give rise to long-range forces. If a like-charged surface and molecule in water come nearer to each other than the Gouy-Chapman length, work needed to compen- sate repulsion can be understood as work of compression of ion clouds. Increasing electrolyte concentration shrinks that layer in which electrostatic energy propor- tional to kBT per counter-ion is stored and can be harnessed by counter-ion release if an oppositely charged molecule encounters the surface1. However, the membrane interior is usually not charged at all, reflecting the fact, that a huge amount of en-
1a more elaborate explanation of theGouy-Chapman layer can be found e. g. in [45]
Figure 1.1:Ion transfer energy through membranes: Theoretical considerations about (left:) the potential energy curve W(x) of a lipid-soluble ion through the membrane consisting of an electrostatic term We(x) and an interaction termWn(x) and (right:) the ion transport process described as a passage over activation energy barriers. Both from [33]
ergy would be needed to transport a charge from solution through the ion cloud into the hydrocarbon interior, where a low dielectric constant of 2-5, depending on the degree of water penetration, resides in contrast to bulk dielectric constant around 80 [12]. The matter of ion transport through membranes and the high energy costs involved had been addressed theoretically and experimentally e. g. by [57] and [33], as in figure 1.1.
If nevertheless a charge can be found in the highly unfavorable interior of a mem- brane, its energetic effect is much higher than in bulk due to the low dielectric constant and the lack of or partial charge shielding through dipole interactions with water. Obviously, the limiting dielectric constants in the bulk on one side and the membrane interior on the other side imply a strong, local, non-homogeneous dielec- tric gradient in the interfacial region of the membrane surface. Thereby, the effect of a charge within that region may alter dramatically with its exact position relative to the phase boundary.
In this work, the mutual influence of the microenvironment of a transmembrane protein sequence at the phase boundary and the charge state of a carboxyl acid side chain is studied quantitatively with respect to structural consequences, and thermodynamically in the context of charge stabilization.
Figure 1.2: The interphase of a lipid membrane: between the two planes depicted as dashed and dotted yellow lines, a two-dimensional solution hydrates polar head groups. From [15]
1.2 Membrane hydration
Membranes tend to bind water tightly, depending primarily on membrane polarity [15]. But also membrane net charge and membrane surface electrostatics [8], re- spectively, affect hydration and not to forget: the same holds vice versa. The role of water at membrane surfaces has been described as a connecting material with structural and dynamical properties imposed by the contact with lipids taking into account the complex membrane surface structure in which there is a spatial distri- bution of charged sites, counter-ions, and co-ions with their corresponding hydration shells [15]. Disalvo defines an interphase region between an inner plane (between low dielectric membrane interior and polar region) and an outer plane tangential to the phosphate groups (see figure 1.2) wherein a two-dimensional solution hydrates polar head groups.
In the interphase, Disalvo describes water as a component of the membrane or- ganized either as hydration water, which is tightly bound to polar head groups and
cannot dissolve other substances, or confined water, which is able to dissolve low molecular weight compounds but shows different chemical and physical properties than bulk water, due to altered water density and dielectric properties in the inter- phase. Structured, immobilized hydration water and the water of the loosely bound second hydration shell affect kinetics of membrane associated reactions, e. g. the dynamics of water exchange is altered by restructuring around hydration sites. In consequence, lipid-protein interactions of membrane proteins are also affected by hydration, due to an introduced change in the force profile [15] of the interphase (hydrophobic or hydrophilic) arguing for a crucial role of water in membrane protein function.
An important aim of the present work is the spectroscopic observation of the puta- tively different water populations at the water/lipid/protein interface. More specifi- cally, the experiments are designed to elucidate the effect of hydration of membrane- exposed amino acids in a conserved transmembrane segment of G-Protein coupled receptors on secondary structure. The underlying hypothesis expects that the sol- vating forces of water act on water-accessible amino acid side chains, whereas the lipidic phase counteracts this tendency, resulting in metastable states that may be of functional importance in regulating membrane protein structure at the lipid/water interface. It is expected that this metastability is particularly intricate when the side chain solubility itself can vary for a single amino acid as it is the case for proton-dependent changes in the charge state of an amino acid.
1.3 G-Protein coupled Receptors
G-Protein coupled receptors (GPCRs) or seven-transmembrane domain receptors (7TM) are integral membrane proteins representing a superfamily of receptors shar- ing general protein structure and common features in their signal transduction mech- anisms. Physiologically, GPCRs are of utmost importance, as they are cell receptors triggered by molecular (hormones, odors, neurotransmitters) and sensory stimuli (light) regulating a vast number of processes such as immune system activity, in- flammatory response, regulation mood and behavior, sense of smell, taste and the visual sense. Due to their prominent role in many fundamental physiological pro- cesses, GPCRs are important drug targets and a detailed understanding of their
signaling pathways is crucial for elucidating origins of disorders and molecular ap- proaches to therapy.
All GPCRs consist of an extracellular, N-terminus followed by seven transmem- brane α-helices which are connected by each three intracellular and extracellular loops and completed by the intracellular C-terminus. The seven helices fold up to a bundle which in many cases forms the ligand-binding site within the membrane and is often shielded by the second extracellular loop (see figure 1.3). Additional to
Figure 1.3: Crystal structure of β2 Adrenergic receptor: engineered β2AR-T4L from [13]. The receptor and T4L are colored gray and green, respectively.
The partial inverse agonist carazolol is shown in blue; the lipid molecules bound to the receptor are depicted yellow. The seven transmembrane helices are denoted I to VII, the helical segment common to all rhodopsin-like GPCRs is denotes VIII and the second extracellular loop shielding the ligand binding site is ECL2.
the common general structure, most GPCRs show conserved amino acid sequences that serve important functions such as the N-Glycosylation site at the N-terminus (momentous for proper receptor folding) or the Palmitoylation site (lipid raft local- ization), the Phosphorylation sites at the C-terminus and the D(E)RY motif at the
intracellular phase boundary in transmembrane helix H-III.
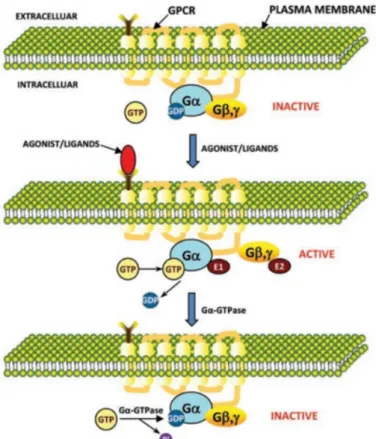
The GPCR signaling cycle (figure 1.4) starts with the inactive membrane-bound GPCR and a cytosolic G-Protein in its GDP-bound inactive state. Upon ligand binding (or light in the case of the visual photoreceptor rhodopsin) the receptor un- dergoes several conformational changes which catalyze the nucleotide exchange in the G-Protein and the dissociation of the G-protein subunits Gβγ fromGα (GTP) complex. Subsequently the ligand dissociates from the receptor or the GPCR desen- sitizes. Gα and Gβγ then allosterically modulate effector proteins. Gα (GTP) gets inactivated by its intrinsic GTP hydrolysis activity which enables binding again to Gβγ to form the heteromeric G-Protein (GDP) which may associate again to ligand-free GPCRs.
Figure 1.4:Activation cycle of G-Protein coupled Receptorsupper panel: inactive state, middle: ligand binding leads to conformational changes, nucleotide ex- change and dissociation of G-protein subunitsGβγ;lower panel: dissociation of the ligand; from [61]
1.4 Rhodopsin
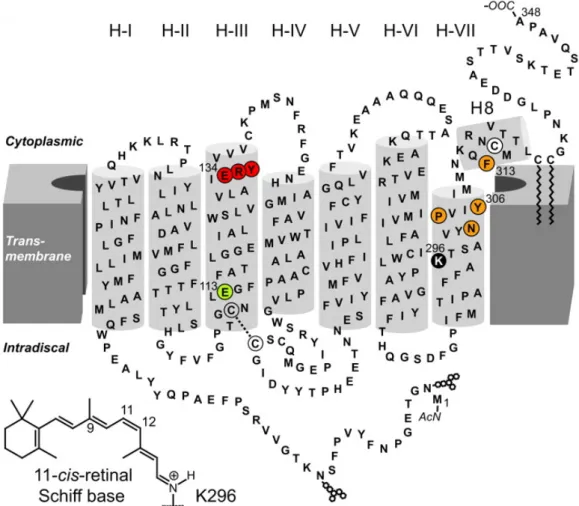
The G-Protein coupled receptor rhodopsin, also called the visual purple, is the prototype of class-A GPCRs containing approx. 85% of all GPCRs. Rhodopsin, the photoreceptor, consists of the protein opsin and the covalently bound cofac- tor, the chromophore 11-cis-retinal, an inverse agonist which acts as agonist in its light-activated all-trans-conformation. For a general survey figure 1.5 presents the secondary structure model of bovine rhodopsin including the conserved amino acid motifs D(E)RY (red) and NPxxY(x)5,6F (orange). In contrast to other GPCRs ac- tivated by diffusible ligands, the chromophore 11-cis-retinal is covalently bound to opsin at K296 (black) in H-VII via a protonated Schiff-base (that is: C=NH+) and is stabilized by the counter-ion E113 (light green) in H-III. In bovine rhodopsin the class-defining, highly conserved D(E)RY motif arises as Glu134, Arg135, Tyr136. In the year 2000 the first long awaited crystal structure of rhodopsin was published (see figure 1.6) followed by a row of high resolution crystal structures providing detailed insights into structural properties of rhodopsin-like GPCRs in different states (such as ligand free opsin in [48] and opsin in G-protein interacting conformation [56]).
In the dark state of rhodopsin, retinal is present as 11-cis-retinal, the inverse ago- nist stabilizing the inactive state of rhodopsin. The first step of light activation is the photoisomerization of11-cis-retinal toall-trans-retinal, the agonist. Via several short-lived photointermediates ( photo-, batho-, lumi-), Rhodopsin relaxes into a pH- and temperature-dependent equilibrium between the two states Metarhodopsin I (MI, Schiff-base still protonated) and Metarhodopsin II (MII, deprotonated Schiff- base). The active MII state of rhodopsin allows activation of G-Protein transducin and processing through GPCR activation cycle (figure 1.4) with the final decay of MII to MIII and to unbound all-trans-retinal and opsin.
1.5 The D(E)RY motif
As pointed out in 1.3 most GPCRs contain conserved amino acid sequences that serve important functions. The class-defining, highly conserved D(E)RY motif at the intracellular phase boundary in transmembrane helix H-III arises as Glu134, Arg135, Tyr136 in bovine rhodopsin and as Asp129, Arg130, Tyr131 in the β2 adrenergic receptor. For rhodopsin transition from MI state to active rhodopsin
Figure 1.5:Secondary structure of Rhodopsin: the heptahelical structure is dis- played by light gray barrels; conserved amino acid motifs D(E)RY in red and NPxxY(x)5,6F in orange, the chromophore11-cis-retinal is covalently bound to opsin via a protonated Schiff base to K296 (black) in H-VII and is stabilized by the counter-ion E113 (light green) in H-III; from [20]
Figure 1.6: Crystal structure of rhodopsin from the first published successful crystallization [47].Transmembrane helices are presented in colored ribbon drawings an denoted I to VII. The chromophore is depicted yellow.
involves Schiff-base deprotonation, followed by proton uptake at the D(E)RY motif and conformational changes in e. g. H-VI, H-III and H8. The proton uptake at the D(E)RY motif, i. e., neutralization of Glu134 is equivalent to the release of the molecular constraint known as ”ionic lock” and can be uncoupled from Schiff-base protonation [4], which is why both processes represent an internal (Schiff base) and an external (D(E)RY) ”proton switch” [42].
The coupling of the two ”proton switches” in the activation mechanism was shown for rhodopsin [64] and moreover the disruption of the ”ionic lock” is also coupled to structural changes in the extracellular loop 2, which shields the binding pocket [1].
The sequence of events in rhodopsin activation regarding the ”ionick lock” was pre- dicted by molecular modeling studies [28] and is extensively studied experimentally (e. g. Zaitzeva2010 for rhodopsin in membranes).
The disruption of the ”ionic lock” is known to be necessary but not sufficient for full activation of β2 AR [66] and titration studies on rhodopsin imply that the protonation of Glu134 is rather a thermodynamical than a structural prerequisite for receptor activation [42], which is why in the present work emphasis is placed on
construction of a thermodynamical characterizing model of coupled protonation of D(E)RY to helix restructuring. In figure 1.7 a comparison of the crystal structure of the D(E)RY region in rhodopsin and β2 AR is shown. The β2 AR structure differs from rhodopsin in the D(E)RY region in exhibiting weaker interactions (longer distances) between the cytoplasmic ends of TM3 and TM6. It is assumed, that these differences may be responsible for the relatively high basal activity and structural instability of the β2 AR supporting the assumed correlation of thermodynamical significance of D(E)RY to structural changes/activation.
Figure 1.7:Comparison of the crystal structure of β2 AR and rhodopsin from [51]: Structure around D(E)RY motif of partially active β2AR in lipidic environment is compared to inactive and light-activated rhodopsin exhibit- ing weaker interactions around the D(E)RY motif for β2 AR compared to rhodopsin.
For rhodopsin the comparison of crystal structures in different states reveals [56]
that upon light activation the ”ionic lock” is broken and Glu134 is tilted towards TM2 and TM4 where it does not seem to undergo specific interactions (see figure 1.8), i. e., neutralized Glu134 is not attracted by certain amino acids but the re- lease of the ”ionic lock” allows the protein to switch into a conformation which is favored by lipid/protein interaction. (It was recently confirmed [23] that the crystal structures of opsin ([48] and [56]) in the ”ionic lock” region indeed reflect the active state.) Unspecific interactions with the tilted Glu134 in active state are again a hint to the thermodynamical impact of the ”ionic lock” rather than to a pure structural impact.
Figure 1.8: Comparison of the crystal structures of rhodopsin in different states from [56]:The dark state rhodopsin structure (green) shows the intact ”ionic lock” whereas the ”ionic lock” is broken in opsin (yellow) and ops-GαCT state (orange). A new hydrogen bond network is formed excluding Glu134, which is liberated and tilted.
The concept of an ”ionic lock” is of interest not only for the prototypical rhodopsin, but also for other GPCRs: By means of molecular dynamics studies a temporal sep- aration of ”ionic lock” substates with concerted motion of the entire β2 AR protein is predicted [54]. For adrenergic receptors it was shown by submicrosecond molecular dynamics simulations that the ”ionic lock” formation is linked to protonation of a certain conserved amino acid via several polar residues acting as microswitches [62]
providing further insights into the temporal sequence of events regarding the ”ionic lock”. Even in GPCRs lacking the highly conserved amino acid sequence D(E)RY analogue ”ionic locks” were identified constituting a similar activation mechanism [59].
The first part of the present work focuses on physical parameters that determine a proton-dependent conformational transition at the C-terminus of H-III, that is involved in shifting the MI *) MII equilibrium in a pH-dependent manner.
The temporal separation of Schiff-base deprotonation from D(E)RY neutralization and e. g. H-VI motion [36] in combination with the additivity of activity-affecting mutations like E134Q mutation and others ([50], [43], [20] and [18]) support the hypothesis of an autonomous proton switch. In fact, recently it was proven ex- perimentally, that the D(E)RY motif can function as a module coupling side chain neutralization to conformation and helix positioning [41].
Thereby, the apparent contradiction of high ligand specificity among GPCRs in
contrast to the highly conserved functional importance of the D(E)RY motif under- going a protonation upon activation can be understood. The approach of addressing physical and chemical properties of isolated transmembrane segments to reveal func- tionally important mechanisms is extended here. The experiments are particularly motivated by the hypothesis that a metastable structure may be generated at a transmembrane helical end that is under the influence of both, the stabilizing envi- ronment of the hydrophobic core of a bilayer and the destabilizing effect of solvation by the adjacent aqueous phase.
As already pointed out in the introduction, membranes are essential in all living matter. For that reason the understanding of the mode of operation of membrane proteins is a fundamental necessity in life science.
In this work, rhodopsin, as the prototype of the largest group of G-Protein cou- pled Receptors, is studied to enlighten conformational switching mechanisms with respect to side chain charges in interphase regions of membranes and the critical role of the microstructure of the water/lipid/protein interface. Insights are meaningful not only for understanding light-activation of rhodopsin or other GPCR activation mechanisms, but are of general importance as many other membrane proteins e. g.
voltage gated ion channels, feature side chain charges at crucial positions inside the membrane or at phase boundaries.
The first part of this work addresses the dependency of hydration and protein-lipid interactions on side chain neutralization. Synthesized peptides in detergent and lipid bilayers mimicking putative autonomous transmembrane segments of rhodopsin in the membrane are studied by spectroscopic methods at different protonation states.
To answer questions concerning hydration level, position of hydration and hydration dependent interactions with lipids, peptides with hydration sites at different posi- tions in the helix and intact or proton-uptake deficient D(E)RY motif are designed and studied to gain basic knowledge transferable to full length systems.
In the second part, hydration of peptides and full length systems (rhodopsin and rhodopsin mutants) embedded in lipids and membranes are studied by FTIR-Fluo- rescence Cross Correlation Hydration Modulation, a technique specifically developed for the purpose of this study, to achieve a full prospect of hydration effects and their kinetics on lipidic groups and the protein simultaneously, as well as on hydration induced lipid-protein interactions.
3.1 Spectroscopic Methods
The goal of this work is to study the correlation of structure, function and dy- namics of a prototypical GPCR and synthetic peptides derived from rhodopsin in lipids. Therefore, the methods used allow observing subtle conformational changes in peptides and proteins under conditions, as close to native conditions as possi- ble. FTIR and especially time-resolved FTIR is the method of choice for label-free conformational studies of peptides, since it resolves the state transitions of indi- vidual amino acid side chains and conformational changes of the backbone at the same time. Furthermore FTIR, allows the study of peptides in lipids and inter- actions with lipidic groups. Additional to FTIR, fluorescence spectroscopy and F¨orster Resonance Energy Transfer (FRET) studies were carried out to character- ize conformational changes. Circular dichroism spectroscopy offers an additional and complementary method for the secondary structure determination of peptides.
UV/Vis Spectroscopy was used for concentration determination and control of the state of rhodopsin samples.
3.1.1 UV/Vis Spectroscopy
UV/Vis spectroscopy is an absorption spectroscopy using electron excitation of molecules from ground state to excited state by visible and ultraviolet light. In this study spectra in the range from 200-900 nm were recorded with a PerkinElmer Lambda 35 spectrophotometer (PerkinElmer Inc., Waltham, Massachusetts, USA) using quartz microcuvettes of 1 cm path length (minimal 180µl sample required) at a fixed resolution of 1 nm.
Concentration of peptides and proteins was determined using intrinsic tryptophan
absorption at 280 nm and Lambert-Beer Law for absorption:
A =ελ ·c·d
with the molar extinction coefficient of tryptophanε280nm = 5690cm·M1 [22], the path length d=1 cm and the concentration cin M = moll .
UV/Vis control measurements to determine the state of rhodopsin samples used the different absorption maxima of rhodopsin intermediates. Dark state rhodopsin
Figure 3.1: UV/Vis absorption of dark and light exposed rhodopsin: protein concentration 200µM, room temperature, pH 7.5, containing DM and BTP (see section 3.3.1 for details). UV spectra of dark state rhodopsin (black line, absorption maximum at 500 nm) can be easily distinguished from light exposed rhodopsin establishing an equilibrium between MI and MII state (orange line, maxima at 480 nm and 380 nm).
with its chromophore 11-cis-retinal absorbs at 500 nm, whereas upon photoisomer- ization (neglecting short-lived intermediates) the MI state of rhodopsin is absorbing at 480 nm and the MII state is characterized by a deprotonated Schiff-base and a dramatic blue shift to 380 nm. Under physiological conditions, MI is present only for microseconds and MII for several minutes before it decays to MIII (450 nm absorp- tion). In figure 3.1 dark state rhodopsin with an absorption maximum at 500 nm can be seen and after light exposure an equilibrium between MI and MII (maxima at 480 nm and 380 nm) is established.
3.1.2 Circular Dichroism spectroscopy
Circular dichroism (CD) spectroscopy is a technique widely used to determine sec- ondary structure of proteins, peptides, but also DNA in solution. In comparison with FTIR secondary structure determination, less concentrated samples are required in CD allowing measurements under conditions closer to physiological conditions ex- cluding unintended non-native aggregation. Furthermore, CD-monitored titration experiments can reveal conformational changes induced by an altered environment (e. g. pH) or by interactions with ligands.
CD spectroscopy uses the phenomenon, that optical active chiral molecules absorb left- and right-handed circular polarized light to different extents. Using CD in the UV range, again electronic transitions in the molecules occur, but with the spe- cific characteristic, that in chiral molecules different complex refractive indices for left- and right-handed circular polarized light give rise to different extinction coef- ficients εl 6=εr for left- and right-handed circular polarized light. The difference of extinction coefficients εl and εr
∆ε=εl−εr
result in an absorption difference (see Lambert-Beer Law in 3.1.1, path length and concentration is, of course, equal for left-and right handed circular polarized light). The CD spectrum shows the difference of extinction coefficients dependent on wavelength: ∆ε(λ).
Not all molecules are optically active, i. e., chiral. Optical activity originates in the existence of two mirror-inverted but not identical forms of a molecule, the enan- tiomers. For biological applications, enantiomers resulting from molecules contain- ing asymmetric C-atoms with four different substituents (able to arrange mirror- inverted around the chiral center, the C-atom) are most important. Prominent examples for optical activity are amino acids in peptides and proteins and carbohy- drates in nucleic acids.
Chiral activity of amino acids in the backbone of peptides and proteins results in distinguishable CD spectra for conformational structure elements such as α-helix, β-sheet (β-I) and β-turn (β-II) depicted in figure 3.2. CD data can be presented in different ways: observed ellipticity Θλ in degrees, mean residue ellipticity [Θ]mrw,λ
Figure 3.2: CD spectra of different secondary structure elementsexhibit different shapes (from [10]). β-I refers toβ-sheet andβ-II refers toβ-turn. Secondary structure determination for the studied peptides was accomplished by using CDSSTR algorithm of DICHROWEB.
or molar ellipticity [Θ]mol,λ, both in units deg·cmdmol2. In this study a JASCO J-815 instrument (JASCO, Gross-Umstadt, Germany) was used at room temperature.
For secondary structure determination, algorithms are used to decompose a spec- trum into basic spectra of known content of different secondary structure elements.
In this study, secondary structure determination was accomplished by using the CDSSTR algorithm of DICHROWEB, hosted at Birbeck College, university of Lon- don, UK. Details on algorithms and principles of CD spectroscopy can be found in [10], [32], [25] and references therein.
It can be seen from Lambert-Beer Law, that exact knowledge of concentration is vital for secondary structure analysis of peptides and proteins. Therefore, concen- tration was determined by UV/Vis spectroscopy as described and additionally with magnetic CD for rhodopsin mutants.
3.1.2.1 Magnetic Circular Dichroism
Magnetic CD (MCD) combines CD spectroscopy and the application of longitudinal magnetic fields and is used for e. g. the study of metalloenzymes [34]. Concentration dependent side chain MCD of tryptophan allows to determine even very small con- centrations untraceable by e. g. UV/Vis spectroscopy. Practically, CD spectra are recorded in a strong coaxial magnetic field and in its reverse orientation. The differ-
ence spectrum of these two spectra shows only MCD induced signals as all other CD signals vanish upon subtraction. The MCD signal strength at a given magnetic field is calibrated by means of defined tryptophan solutions in order to determine tryp- tophan concentration and thereby protein concentration in samples of known amino acid composition. Tryptophan is the only natural amino acid exhibiting MCD.
The technique is used here for concentration determination of detergent-solubilized opsins that do not exhibit visible absorption.
3.1.3 Fluorescence Spectroscopy
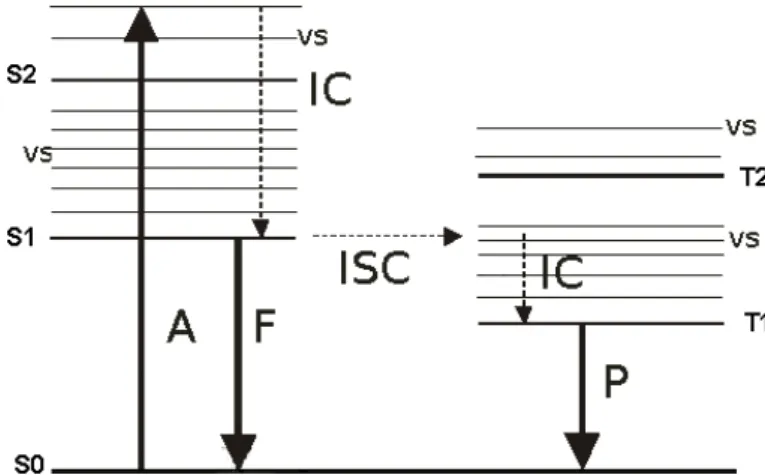
Fluorescence is the spontaneous emission of photons by molecules converting from an excited electronic singlet state to the electronic ground state after absorption of a photon. In figure 3.3 the Jablonski diagram shows ground state S0, the absorp- tion of a photon A to a higher excited state, the internal conversion IC from an excited vibrational state vs to singlet state S1 and fluorescence emission F from S1 to ground state S0. Due to internal conversion, absorbed photons posses a higher energy than emitted photons, i. e., fluorescence is red shifted by the so called Stokes-Shift. Furthermore figure 3.3 shows inter system crossing ISC to triplet states T2 and T1 and following phosphorescence P involving a ”forbidden” spin transition and thereby presenting a much slower relaxation mechanism than fluo- rescence. Fluorescent molecules usually possess a widespread π-electron system to
Figure 3.3:Jablonski diagram: S0: ground state, S1: singlet state, vs: excited vi- brational state, T1 and T2: triplet states, A: absorption of a photon, IC:
internal conversion, F: fluorescence emission, ISC: inter system crossing, P:
phosphorescence
Table 3.1: Maximum positions of fluorescence absorption and emission of tryp- tophan, tyrosine and phenylalanine
Absorption Emission
Tryptophan 280 nm ≈340 nm
Tyrosine 275 nm 305 nm
Phenylalanine 260 nm 280 nm
allow very small energy gaps between ground state and excited states excitable by UV/Vis. Hence the chemical structure of aromatic ring systems is often a con- stituent of organic fluorophores.
Generally, fluorophores fall into two categories: intrinsic, native occurring fluo- rophores and extrinsic fluorophores, which have to be added to a sample. Among intrinsic fluorophores most important for biological applications are: amino acids, NADH and flavins. In proteins, the intrinsic fluorescence originates in most cases from the amino acids tryptophan, tyrosine and phenylalanine (see figure 3.4). Spectral
Figure 3.4: Chemical structure of the intrinsic fluorescence emitting amino acids: tryptophan, tyrosine and phenylalanine
contributions of these three amino acids can be easily assigned, as they are absorbing and emitting at different wavelength (see table 3.1).
Tryptophan fluorescence is most often studied not only because of it’s dominance over tyrosine and phenylalanine fluorescence due to higher absorptivity and quan- tum yield, but also because of it’s sensitivity to the microenvironment of the indole ring [63]. Fluorescence intensity and wavelength position of absorption and emission maximum is for example dependent on hydrophobicity (i. e., polarity) due to distor- tion of electronic orbitals participating in radiation-less internal conversion. This characteristic of tryptophan fluorescence serves an excellent tool for exploring the
solvent surrounding tryptophan residues (see figure 3.5), for example to distinguish tryptophan residing at the solvent accessible surface of a protein from tryptophan deeply buried in the hydrophobic cores by wavelength shifts of up to 50 nm in the emission maximum. In this work, microenvironment-dependent tryptophan emis-
Figure 3.5:Red-shifted tryptophan emission maximum in microenvironments of increasing polarity from [38]
sion is used to monitor proton-induced hydration changes of peptides in detergent and lipids and, in the second part, hydration-induced conformational changes of peptides and full-length proteins in lipids.
3.1.3.1 F¨orster Resonance Energy Transfer (FRET)
Insights about conformational changes in proteins and peptides can be gained addi- tionally by F¨orster Resonance Energy Transfer (FRET). FRET is the non-radiative transfer of energy from one fluorophore, the donor, to another, the acceptor under certain circumstances. For one thing, a sufficient spectral overlap of the emission spectrum of the donor and the absorption spectrum of the acceptor is needed. Fur- thermore, the distance r of donor and acceptor (10-100 ˚A) and the orientation of the corresponding dipoles are influencing the efficiency E of energy transfer:
E = R60 R60+r6
where R0 is the dipole orientation dependent F¨orster distance at which 50 % of energy is transferred.
Here we study the pH-dependent lipid-protein interactions at the phase boundary by FRET using peptides reconstituted in DANSYL-PE doped vesicles as illustrated in figure 3.6. Thereby, information on pH-dependent distance/orientation changes at the helix end can be inferred.
Figure 3.6: FRET between tryptophan and DANSYL-PE:to study pH-dependent lipid-protein interactions at the phase boundary, we use the distance and orientation dependent FRET of tryptophan in TM3-derived peptides recon- stituted in DANSYL-PE doped vesicles.
3.1.4 FTIR Spectroscopy
Infrared (IR) transmittance or absorption spectroscopy is used to study excited vi- brational modes of molecules. Absorption of IR light in the region of 2.5-250µm does not provide enough energy to excite electronic transitions in a molecule like for UV/Vis or fluorescence spectroscopy but it induces transitions to excited vibrational states. A fundamental vibration of a molecule, i. e., a vibration without translation or rotation, can only be excited if a change of the dipole moment is associated with it. The six possible ways of fundamental vibration for a molecule are: symmetric
stretching, asymmetric stretching, the in-plane vibrations: scissoring and rocking and the out-of plane vibrations: wagging and twisting. To each possible IR-active vibration of a molecule an IR band in the IR absorption (or transmittance) spectrum can be assigned, furthermore combination modes of more than one fundamental vi- bration and overtone vibrations can give rise to additional IR bands. The exact frequency position of an IR band in the spectrum, i. e., the excitation energy of the vibration, is determined by the chemical structure of the vibrating functional group and depends on the state of the group (e. g. redox state, bond length, bond defor- mation) and the conditions in the microenvironment of the vibrating dipole (e. g.
hydration state). All these factors affect the apparent force constant that describes the force-displacement relation for the atoms that participate in a concerted oscil- latory movement, i. e., a normal mode.
The IR spectrum is plotted against the wavenumber ν:
ν = 1 λ
where λ is the corresponding wavelength, but in reverse order (e. g. 3000 cm−1 to 800 cm−1) and thus bands at the left side of an IR spectrum represent higher absorption energies than IR bands at the right, as it is the case for UV/Vis spectra.
For diatomic molecules and isolated vibrations in larger molecules the vibrational frequencyωis described classically asω = 2π·c·ν =
qK
M, withKthe force constant of the vibrating band and M the reduced mass. It can be seen, that the frequency increases with bond-strength (increased K) and decreases with the reduced mass M.
Characteristic vibrations in biomolecules are observed in the 4000-800cm−1 range falling into two interesting regions: C-H stretching around 3000 cm−1 and the so- called fingerprint region at 1800-800cm−1. In particular, peptides and proteins can be characterized by IR spectroscopy due to the vibration of their amino acid side chains (assignment of amino acids to corresponding IR bands can be found e. g. in [60] and [6]) and through protein backbone vibrations. The latter serve to determine secondary structure content by analysis of the shape and position of Amide I band (peptide carbonyl) or Amide bands I and II (mainly C-N stretching) (for details see e. g. [16], [31] and [24]).
3.1.4.1 ATR-FTIR difference spectroscopy
In this study Fourier transformed (FT) attenuated total reflectance (ATR) infrared spectroscopy: ATR-FTIR 1 was used.
FTIR spectroscopy generates polychromatic interference of the whole spectral IR range of a globar light source (black-body radiation) by means of an interferometer, typically a Michelson interferometer as in figure 3.7. From the gained interferogram the irradiation spectrum is calculated by Fourier transformation. The Michelson
Figure 3.7: Michelson Interferometer: The beam of a globar light source is split and recombined with a tunable optical path length difference generating polychro- matic interference.
interferometer includes a fixed and a moving mirror, inducing tunable optical path length differences in the recombined light beams. For a complete spectrum with a spectral resolution of
ν
∆ν = 2Lν
the moving mirror needs to traverse the path lengthL. From the calculated spectra of a sample and a reference spectrum the absorption can be calculated as −lgII
0
as in ordinary spectroscopy. The fact, that by FTIR intensity at all wavenumbers is collected simultaneously accounts for the advantages of FTIR: increased speed
1For more detailed explanation of Fourier transformed IR and the ATR technique, please refer to [27], [26] or other textbooks on the matter.
and a much better signal-to-noise ratio than in dispersive IR spectrometers (Fellget advantage) and higher energy throughput because of circular apertures.
Peptides reconstituted in lipids and even more: large proteins, give rise to a huge number of interfering IR bands because of the large amount of functional groups (amino acid side chains, lipidic head groups and others) contributing to an IR spec- trum. To monitor conformational changes upon a stimuli by FTIR (e. g. light, change in pH, water network disturbance) it is inefficient to look at absolute spectra due to their confusing number of overlapping bands. To overcome this problem, FTIR difference spectroscopy is performed, i. e., interpretation of the difference be- tween a spectrum and a reference spectrum (e. g.before the stimuli) allows evalua- tion of only the altered absorptions enabling the assignment to changes in individual functional groups.
FTIR spectra of a sample can be obtained by transmission measurements or by the attenuated total reflectance (ATR) technique. For transmission spectroscopy IR transparent dry pellets have to be produced from the sample. For that reason, the study of biological samples with respect to the surrounding aqueous solution is not possible by transmission spectroscopy.
As illustrated in figure 3.8 multiple internal reflection of the IR beam in the ATR crystal and formation of an evanescent field penetrating only the first µm of the sample makes ATR spectroscopy an elegant and powerful technique for the study of samples under physiological conditions avoiding problems resulting from strong water absorbance in the interesting IR regions. Moreover samples can remain open at the upper side enabling manipulations (i. e., stimuli) and further simultaneous studies (as it is done in this work by FTIR-Fluorescence Cross-Correlation, see sec- tion 3.1.4.3).
ATR-FTIR difference spectroscopy hence provides an excellent tool for label-free characterization of conformational changes in proteins (secondary structure and side chain changes) and lipids.
Fast data acquisition using the FTIR technique enables time-resolved measure- ments in different modes: step-scan and rapid-scan FTIR. For step-scan FTIR a periodic process is monitored by stepwise alteration of the position of the mov- ing mirror in the Michelson interferometer. At each position a complete process is recorded with a constant path length difference of the mirrors. Post-processing of the data includes sorting of data points to merge interferograms for each time
Figure 3.8: Principle of attenuated total reflectance spectroscopy: multiple in- ternal reflection of the IR beam (red) in the ATR crystal (yellow) induces an evanescent field penetrating the first µm of the sample (green) which can remain open at the upper side and can be studied under physiological condi- tions, i. e., in presence of solution (blue).
point and after Fourier transformation spectra are obtained for each time point.
The advantage of step-scan FTIR is that time-resolution is no longer limited by the maximum speed of the moving mirror but by the much faster electronic processing (detector electronics, analogue-to-digital converter etc.), however only relatively fast and strictly reproducible processes can be studied.
In this study, we use rapid-scan FTIR, where complete interferograms are recorded at high mirror speed. As the half-lives of the monitored processes in this work are much longer than the duration for acquisition of an interferogram in rapid-scan mode, this mode is adequate for our purposes.
3.1.4.2 Infrared studies on Rhodopsin
For bovine rhodopsin FTIR difference spectroscopy upon light activation was studied under several conditions. Exemplary difference spectra of rhodopsin (MI state vs.
dark state and MII state vs. dark state) are shown in figure 3.9.
Assignment of individual bands in the fingerprint region to group vibrations in FTIR difference spectroscopy upon light activation can be found in the table 3.2.
Moreover, as protonated carboxylic acids absorb in the region above 1700 cm−1which is free of other vibrational modes in difference spectra, assignment of bands to cer- tain aspartic and glutamic acids had been accomplished by means of site-directed mutagenesis studies. The position of bands from carboxylic acids additionally moni-
Table 3.2:Position of FTIR difference bands upon light activation of rhodopsin.
wavenumber description
1770-1700 cm−1 C=O stretch of protonated carboxylic groups (-)1767 cm−1 Asp83 in MII [19], [52]
(+)1747 cm−1 strong band of Asp83 and Glu122 in MII [19], [52]
(+)1752 cm−1 Asp83 in MI [52]
(-)1735 and 1727 cm−1 Glu122 in MI [19]
(+)1734/(-)1724 cm−1 carbonyl stretch from ester of lipids upon formation of MII [7]
(+)1713 cm−1 Glu113 protonation (MII) [29]
(+)1686 cm−1 characteristic band for MII state [52]
1680-1620 cm−1 Amide I region, C=O stretch of peptide backbone (+)1662 cm−1 strong characteristic band for MI state [40]
(-)1656 cm−1 C=N stretch and N-H bend of protonated Schiff-base (+)1644 cm−1 strong characteristic Amide band for MII state 1620-1500 cm−1 C=C stretch in ethylenic mode of retinal [40]
1580-1510 cm−1 Amide II, N-H bend of protein
(−)≈1550 cm−1 characteristic double band for MII state (single in MI) 1400-1200 cm−1 Amide III, C-C stretch of peptide backbone
(−)≈1390 cm−1 symmetric stretch of negatively charged carboxylate groups 1300-1100 cm−1 coupled C-C stretch and C-H bend of retinal
(-)1237 cm−1 C-C stretch, C-H and N-H bend of Schiff-base, characteristic for isomerization
≤1000 cm−1 C-H bend of retinal
(+)952 cm−1 weak characteristic band for MI [52]
Figure 3.9: FTIR difference spectra of wild type rhodopsinfrom [40], see table 3.2 for details.
tors the hydration state, because their absorption is shifted to higher wavenumbers if hydrogen bond strength decreases [35],[44]. Positive bands are marked (+), negative bands (-) in the summarizing table 3.2.
3.1.4.3 Fluorescence-FTIR Cross Correlation Spectroscopy
The attenuated total reflectance FTIR technique offers the possibility to access the sample from the upper side while recording the FTIR signal through the supporting crystal (see section 3.1.4.1). This circumstance can be used to collect additional data from above the sample. In this study, FTIR rapid-scan spectra and the tryptophan fluorescence signal are recorded simultaneously in that way. The motivation for this simultaneous heterospectral recording is the combination of structural information gathered by FTIR with site-specific information of the physical environment of a native or engineered Trp residue. The indol ring of the latter is known to respond to hydrophobicity/hydrophilicity changes by characteristic fluorescence changes.
The experimental set-up (figure 3.10) allows to study relaxation of a system after a hydration pulse, as well as formation of MI/MII state and decay of rhodopsin after light exposure. Fluorescence is recorded as a time-drive signal at a single wavelength slightly above the emission maximum of tryptophan, thereby reflecting blue-shifts and red-shifts of tryptophan emission as lower and higher fluorescence intensities
Figure 3.10: Measurement set-up for Fluorescence-FTIR Cross Correlation:
The sample (green) is dried on an ATR crystal (yellow). A defined relative humidity above the sample is achieved by a reservoir containing saturated salt solution (blue) above a membrane (orange). FTIR rapid-scan spectra are recorded from below the sample and the tryptophan fluorescence signal is recorded from above simultaneously, to monitor hydration changes induced by application of a short current pulse through a wire (turquoise).
respectively. For both experiments, a defined relative humidity above the dried sample is achieved by a reservoir in the adaptor above the sample (”adaptor 1” in figure 3.11) containing saturated salt solution above a membrane (orange in figure 3.10). According to Rockland [53] saturated KCl solution is used to obtain 85 % relative humidity and K2SO4 for 97 % relative humidity after an equilibration time of at least two hours. In the equilibrated state, a reference FTIR spectrum of the sample is recorded (usually 128 scans, double sided, forward backward).
For hydration modulation experiments, the application of a short current pulse (500 mA for 4-8 s) increases the relative humidity in the small zone above the dried sample and below the membrane. Statistically, a few water molecules per lipid molecule of the sample are thus added and the re-equilibration, i. e., the loss of these added water molecules, is recorded by FTIR and fluorescence within seconds to minutes.
Light activation of rhodopsin is achieved by illumination with green light of a high power LED (520 nm) into the excitation optical fiber above the sample. A self-made adaptor (”optional adaptor 2” in figure 3.11) fitting into the sample chamber of the fluorescence spectrometer and launching the LED light into the excitation op- tical fiber is therefore used and is taken out after 30 s of light exposure to allow fluorescence signal excitation and recording after light activation. Synchronization of monitored fluorescence and FTIR data is achieved by TTL signals sent to the the fluorescence spectrometer during the emission time-drive before and after each recorded FTIR spectrum as well as before and after the hydration pulse and waiting time in between the pulses.
3.1.4.4 FTIR spectra correction
Hydration modulation leads to an increase of the relative humidity above the dried sample and, thereby to an expansion of the sample, primarily induced by swelling, i. e., hydration of lipid headgroups. The evanescent field of the ATR-FTIR interacts with less lipid/protein molecules in the expanded sample than in the equilibrated sample and an absorption loss is observed (see figure 3.12). The ATR-FTIR absorp- tion loss is depending on the film thickness but always linear proportional to the change of film thickness. A brief deviation is given in the following:
Figure 3.11: Data acquisition set-up for Fluorescence-FTIR Cross Correlation.
The electric field of an evanescent wave with penetration depth p at a position z above the boundary surface is decaying by passing through the film: E(z) = E0·e−zp The intensity is direct proportional to the squared electric field I(z) ∼ E(z)2 and the absorbed IR intensity by passing through the film of the film thickness a is proportional to the concentration of molecules in the film c:
Iabs ∼c· Z a
0
E(z)2dz
Iabs ∼c· 1−e−2a/p 2/p
The concentration of molecules in the film is not constant upon swelling. The film volume, i. e., the thickness changes from a0 to a but the total number of molecules N with a cross section ε in the film is constant, leading to: c= c0a·a0 ∼ε·N· 1a and thus:
Iabs ∼ 1−e−2a/p 2a/p
The absorption A after several reflections through an ATR crystal is then:
A =−lgI0 I
A∼ln(1−ε·N · 1−e−2a/p 2a/p )
Due to the swelling induced absorption loss a FTIR spectra correction is needed to separate absorption losses originating in dilution effects and band changes that arise from hydration effects, e. g. frequency shifts caused by altered H-bonds. Fur- thermore, broad peaks and tailing absorption from H2O are removed to uncover su- perimposed peak structures. The spectral range between 2700cm−1 and 1800cm−1 is omitted in each spectrum as the ATR crystal is opaque in that range. An ex- emplary spectral correction is shown in figure 3.13 and achieved by the following steps:
1. Water vapor correction: A spectrum of water vapor is subtracted from dif- ference spectra in the fingerprint region (1800-800cm−1) to obtain smooth spectra without accidentally occurring water vapor peaks.
Figure 3.12: ATR absorption during swelling processes of the sample: Absorption of a given number N of molecules with cross section εfilling the evanescent field to a thickness given in multiples of the penetration depth (left panel) and the linear correlation between the change of thickness of the sample film and the absorption loss (right panel), where the slope is depending on the film thickness (labels to the corresponding lines).
2. Dilution correction in the fingerprint region (1800-800cm−1): the underlying assumption for this correction is, that in the fingerprint region IR peak fre- quencies shift in response to hydration but exhibit little or no change in their integral intensity over a ≈500cm−1 range. Therefore the reference spectrum is added and a spectrum of liquid water is subtracted in a fashion that the integral intensity change between 1422cm−1 and 950cm−1 is zero. The lim- its of integration are adjusted for peptides and rhodopsin to 1422cm−1 and 950cm−1 and for opsin mutants to 1330cm−1 and 950cm−1 in order to posi- tion the limits of integration not at a hydration-sensitive FTIR band. These correction are expressed as:
Cori =Difi+fD,iRef −fH,iW at−Offset1422cm−1
with Difi: difference spectrum number i after hydration, Cori: corrected difference spectrum number i after hydration,Ref: reference spectrum before
Figure 3.13: Exemplary FTIR hydration modulation spectra before and af- ter correction: FTIR band changes originating from dilution effects are corrected and broad peaks and slopes are subtracted to uncover IR band changes generated by hydration effects. The region between 2700cm−1 and 1800cm−1 is cut out as the ATR crystal is opaque in that range.
hydration,W atliquid water spectrum and factorsfD,iandfH,ichosen so that:
Z 950cm−1 1422cm−1
(Cori −Offset1422cm−1)dx= 0 where
Offset1422cm−1 =Difi,1422cm−1 +fD,iRef1422cm−1 −fH,iW at1422cm−1
With the notations:
A=
Z 950cm−1 1422cm−1
(Difi−Difi,1422cm−1)dx
B =
Z 950cm−1 1422cm−1
(Ref −Ref1422cm−1)dx C =
Z 950cm−1 1422cm−1
(W at−W at1422cm−1)dx the first constraint forfD,i and fH,i is:
A+fD,iB−fH,iC = 0
The second constraint follows from the correction of the water continuum’s absorption in the range between 1422cm−1 and 845cm−1. The water contin- uum gives rise to a broad absorption increase starting from approx. 1000cm−1 which is abolished by this part of the correction. With the notations:
∆A =Difi,845cm−1 −Difi,1422cm−1
∆B =Ref845cm−1 −Ref1422cm−1
∆C =W at845cm−1−W at1422cm−1 the second constraint is:
∆A+fD,i∆B−fH,i∆C = 0
the two constraints define the factors fD,i and fH,i as follows:
fH,i= ∆AB−∆BA
∆CB−∆BC and
fD,i = fH,i∆C−∆A
∆B
3. OH-stretch correction in the region 3800cm−1 to 2700cm−1 compensating the increased absorption when the reference spectrum is added: from the first difference spectrum the fraction of ”additional” water fwat is calculated with the wavenumber of the maximumM ax1 between 3800cm−1 and 2700cm−1 in Dif1:
fwat = Cor1(M ax1)−Dif1(M ax1) fD,1W at(M ax1)
The ”additional” water absorption caused by the addition of the reference spec- trum is subtracted from each difference spectrum using a spectrum of liquid water ”wat” in the following correction in the region 3800cm−1 to 2700cm−1:
Cori =Difi+fD,i(Ref −fW atW at)−Offset2700cm−1
Thus, the corrected spectra are normalized to the same amount of lipid/peptide but retain their original intensity increase in the OH-stretching range which is required to monitor the water content of the sample at each time point.
4. Water subtraction in the scissoring range 1800cm−1 to 1422cm−1: Addi- tionally to the correction No. 2 the angular slope between 1800cm−1 and 1422cm−1 is corrected and the superimposed water peak is subtracted to vi- sualize the much smaller underlying peaks from the lipid/peptide samples.
Cori−qiW at
where qi is the peak area ratio (after slope subtraction) qi =
R1800cm−1 1422cm−1 Cori
R1800cm−1 1422cm−1 W at
5. Water correction for lipidic peaks in the 3070cm−1 to 2700cm−1 range: To enhance analysis of lipid FTIR bands in the trailing edge of the broad water peak (from 3800cm−1 to 2700cm−1) a polynomial baseline (4th grade, red line
in figure 3.14) is subtracted and the Integral=0 criterion is again applied to recalculate correction factors for this range (see correction number 2). The underlying assumption is again, that in the range 3070cm−1 to 2700cm−1 FTIR peaks only shift but that they do not alter their intensity.
3.1.4.5 Estimation of water content in hydrated films
To gain an estimate of the number of water molecules per lipid molecule, the ratio of the integral FTIR absorption peaks of water (OH stretch integral absorption from 3800cm−1to 2700cm−1) and lipid CH stretch (integral absorption from 3050cm−1to 2700cm−1) has to be obtained. For this purpose a 4th grade polynomial was fitted to subtract the tailing water background absorption in the lipidic CH-Stretching region between 2700cm−1 and 3100cm−1 as shown in figure 3.14. According to
Figure 3.14: Exemplary deconvolution of the FTIR absorbance bands used to calculate the water content in hydrated sample films: OH-stretch band (blue lines) and the CH-stretch bands (crossed blue lines).
[21] one unit of R =
RAOH
RACH refers to 2.2±0.4 water molecules per DOPC lipid. In presence of a peptide or protein, the OH-stretch band is superimposed by Amide A and Amide B band. From dry protein FTIR spectra it could be concluded (by means of an approximate ratio of Amide A and Amide B to Amide I and Amide II band) that their contribution to the integral area in the present experiments is only 3 % or less. Amide A and Amide B difference bands can therefore not be resolved from the water OH-stretch difference bands.
For samples not reconstituted in pure DOPC, the amount of lipid headgroups had been normalized by using the peak height of the symmetric PO−2 stretch bandAP O−
2
from the sample and the corresponding DOPC measurementAP O−
2,DOP C. This leads to the number of water molecules per lipid molecule nW/L:
nW/L = 2.2·
R AOH
R ACH · AP O−
2
AP O−
2,DOP C
For reconstituted peptides in vesicles nW/L is proportional to the dilution factor
Figure 3.15: Exemplary relation between the dilution factorfD and the number of water molecules per lipid molecule nW/L for DOPC at 85 % relative humidity a linear relation with the slope 0.027 is calculated.
fD (see previous section) and the slope of fD(nW/L) provides information about the relative volume change of the adsorbed lipidic film upon uptake of one water molecule per one lipid molecule (figure 3.15). Thus, the spectroscopic data from ATR experiments can be related to an important macroscopic property that is not accessible by transmission spectra. It has to be noted, that the relation between fD and nW/L is not in all cases strictly linear but can be a hysteresis curve. The deviation from a linear behavior will be quantified by the distance (given innW/L) of the two enclosing lines parallel to the calculated regression line according to figure 3.16.

![Figure 1.7: Comparison of the crystal structure of β 2 AR and rhodopsin from [51]: Structure around D(E)RY motif of partially active β 2 AR in lipidic environment is compared to inactive and light-activated rhodopsin exhibit-ing weaker interactions around](https://thumb-eu.123doks.com/thumbv2/1library_info/4565132.1599805/20.892.169.751.429.629/comparison-structure-rhodopsin-structure-partially-environment-activated-interactions.webp)

![Figure 3.5: Red-shifted tryptophan emission maximum in microenvironments of increasing polarity from [38]](https://thumb-eu.123doks.com/thumbv2/1library_info/4565132.1599805/30.892.208.716.285.607/figure-shifted-tryptophan-emission-maximum-microenvironments-increasing-polarity.webp)

![Figure 3.9: FTIR difference spectra of wild type rhodopsin from [40], see table 3.2 for details.](https://thumb-eu.123doks.com/thumbv2/1library_info/4565132.1599805/37.892.185.678.162.460/figure-ftir-difference-spectra-wild-rhodopsin-table-details.webp)

