Listed Real Estate Companies
DISSERTATION
zur Erlangung des Grades eines Doktors der Wirtschaftswissenschaft (Dr. rer. pol.)
eingereicht an der
Fakultät für Wirtschaftswissenschaften der Universität Regensburg
von Dominik Wagner Tag der Disputation
20. Januar 2021
Berichterstatter
Prof. Dr. Steffen P. Sebastian
Prof. Dr. Wolfgang Schäfers
This thesis presents the results of my research at the Department of Real Estate at the University of Regensburg. It is important to me to express my deep gratitude to several people who either directly contributed to the results or supported me in different ways to achieve the completion of this dissertation project.
First of all, I would like to thank my doctoral father Prof. Dr. Steffen P. Sebastian for his valu- able guidance and steady support through his own by numerous discussions and internal feedback channels and through the possibility to attend on international renowned conferences. I am also very grateful to Prof. Dr. David H. Downs for discussions along our joint articles of which I person- ally built up more elaborated academic expertise. It was an honor and a pleasure to work with him.
A special thanks to Prof. Dr. Wolfgang Schäfers, who kindly accepted to be my second supervisor for this thesis. I also thank my other co-authors Prof. Dr. René-Ojas Woltering and Pascal Frömel as well as many colleagues at the University of Regensburg and at international conferences for helpful comments. I also thank my alma mater, the University of Regensburg, for educating me as a B.Sc. Economics and M.Sc. Business Administration and therefore providing a basis for excellent research conditions. In this context, I would also like to mention the generous support on various instances of the Universitätsstiftung Hans Vielberth and the International Real Estate Society as well as Union Investment for a scholarship.
Finally, deepest thanks go to my parents Herta and Erwin Wagner for their unconditional sup- port and encouragement in my entire life. And foremost to my life companion Annalena Gebsattel for her unlimited love, patience and getting through difficult phases together.
List of Figures . . . VII List of Tables . . . . IX
1 Introduction 1
2 The REIT Conversion Puzzle 7
2.1 Chapter Introduction . . . . 8
2.2 Related Literature and Hypotheses . . . . 12
2.2.1 Cost-Benefit Trade-Off . . . . 12
2.2.2 Market Valuation . . . . 13
2.2.3 Herd Behavior . . . . 15
2.2.4 Managerial Motivation . . . . 15
2.3 Data and Methodology . . . . 17
2.3.1 Sample of REIT Conversions . . . . 17
2.3.2 Research Design and Variable Definitions . . . . 20
2.3.3 Summary Statistics . . . . 26
2.4 Empirical Results . . . . 30
2.4.1 Company-Specific Determinants and Market Dynamics . . . . 30
2.4.2 Managerial Incentives . . . . 37
2.4.3 Spillover and Reform Effects . . . . 40
2.5 Chapter Résumé . . . . 44
3 Strategic Transactions Around REIT-Conversions? 47
3.1 Chapter Introduction . . . . 48
3.2 Related Literature and Hypotheses . . . . 51
3.3 Data and Descriptive Statistics . . . . 53
3.4 Conversion-Related M&A Activity . . . . 57
3.4.1 Strategic Restructuring . . . . 57
3.4.2 Conversion-induced Deals . . . . 60
3.5 Post-Conversion Performance . . . . 65
3.6 Chapter Résumé . . . . 68
4 The Role of Uncertainty on Firm Structure Choices of listed Property Companies 69
4.1 Chapter Introduction . . . . 70
4.2 Theoretical Framework . . . . 73
4.3 Data . . . . 79
4.3.1 U.S. Firm Sample . . . . 79
4.3.2 Sample Characteristics . . . . 80
4.4 Methodology and Empirical Results . . . . 86
4.4.1 Aggregate Level . . . . 86
4.4.2 Individual Level . . . . 88
4.4.3 Duration Effects . . . . 91
4.5 Chapter Résumé . . . . 94
5 Conclusion 95
Bibliography 98
Appendix A Additional Material of Chapter 2 XIII
Appendix B Variable Definitions of Chapter 3 XVII
Appendix C Robustness Tests and Case Studies of Chapter 4 XIX
2.1 REIT Conversions, By Country, Over Time . . . . 19
2.2 Number of Listed Real Estate Companies Over Time . . . . 20
2.3 Marginal Effects of Company Effective Tax Rates . . . . 32
2.4 Marginal Effects of Exit Tax Costs . . . . 33
2.5 Marginal Effects of NAV Spreads . . . . 34
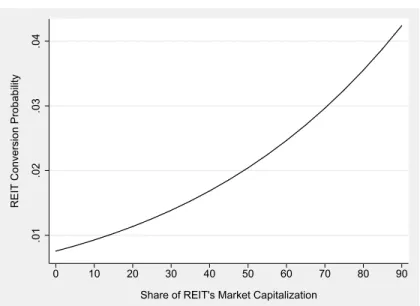
2.6 Marginal Effects of REIT Market Share . . . . 35
2.7 Marginal Effects of Previous Conversions . . . . 36
2.8 Interaction Effect of the NAV Spread and Equity-Based Compensation . . . 40
3.1 Number of Sample Deals and (Average) Deal Size Around Conversion Dates 49 3.2 Inflows Around REIT Conversions . . . . 61
4.1 Macroeconomic Uncertainty and Deconversion Events . . . . 71
C.1 Political Uncertainty and Deconversion Events . . . XIX
2.1 Distribution of the Listed Real Estate Companies (REOCs and REITs) . . . . 18
2.2 Sample Characteristics . . . . 29
2.3 Logit Estimation Results of REOC-to-REIT Conversion Likelihood . . . . 31
2.4 Extended Logit Estimation Results of REOC-to-REIT Conversion Likelihood 38 2.5 Spillover and Reform Effect on REOC-to-REIT Conversions . . . . 43
3.1 Number of (Converted) REITs Across Countries . . . . 54
3.2 Number of Sample Deals per Deal Type . . . . 55
3.3 Number of Internal Sample Deals . . . . 56
3.4 Distribution of Sample Deals and Firms Across Quartiles . . . . 57
3.5 Two-Sample t-Test for High and Low Restructuring Quartiles . . . . 58
3.6 Regression Results for the Impact of the Asset Test . . . . 59
3.7 Regression Results for Inflows, Number of Deals, and Excess Deal Size . . . 63
3.8 Combined Effect of Inflows . . . . 64
3.9 Post-Conversion Performance Across Countries . . . . 66
3.10 Post-Conversion (Risk-Adjusted) Performance by M&A Activity Quartile . 67 4.1 Literary Theories on Corporate Restructuring . . . . 76
4.2 Panel A – Summary Statistics of Country Variables . . . . 81
4.3 Panel B – Summary Statistics of Firm Variables . . . . 83
4.4 Panel C – Deconverting Firm Variables Around Event Time . . . . 85
4.5 The Impact of Uncertainty on Country-Level Deconversions . . . . 87
4.6 Combined Effect of Macroeconomic Uncertainty . . . . 88
4.7 The Impact of Uncertainty on Firm-Level Deconversions . . . . 90
4.8 The Impact of Enduring Uncertainty on Deconversions . . . . 93
A.1 Empricial Implications on the Likelihood of REIT Conversion . . . XIII
A.2 Robustness Test on Different Lag Choices . . . XIV
A.3 Cross-Correlation Matrix of Explanatory Variables . . . XV
A.4 Logit Estimation Results on Distribution Test vs. Dividend Yield . . . XVI
C.1 The Impact of Empire-Building on firm-level Deconversions . . . . XX
C.2 Cross-Correlation Matrix of Explanatory Variables . . . XXI
Introduction
The economic role of real estate in a broader sense is unquestionable of major importance for global wealth. The real estate sector comprises large shares of gross-domestic product output and growth across all countries worldwide and generates jobs in a large scale. Its multi-dimensions range in all branches and translate in manifold private and commercial direct and indirect investment vehicles and serves as research objectives in large varieties of academic disciplines. Sebastian et al. (2012) summarize direct and super-categories of indirect instruments for real estate and assess open ended funds and companies as most meaningful.
1Schäfers (1997) also highlights the magnitude of corporate real estate and reveals its hidden value for generating return profiles. In the case of Germany the share added value to the economy is estimated to 19% and provides 10% of all employees in 2018, which depicts a persistent trend for years (Feld et al., 2020). Real estate activities in- cluding the construction sector constitute 16.5% to the overall European GDP (EPRA and INREV, 2018). In the U.S., it is not solely a strong contributor to the economy but also a major factor in downturn periods. While housing on its own contribute approximately 5% to GDP growth in normal times, it causes up to 26% of the magnitude in GDP de-
1For example, Pfnür (2013) and Schulte et al. (2016) provide a comprehensive basis knowledge of the entire real estate sector in general and illustrate its extensive interrelations to economies and market players for Germany and Europe. Another suitable source for a broad introduction in U.S. real estate markets, corporate valuation and performance measures is documented in Geltner et al. (2013). Those sources also introduce Real
creases during recession periods. Besides, real estate’s scope also affects the demand side of private households and further influences their consumption behavior through chan- nels of interacting prices and rents. Teuben and Bothra (2020) report annually the market size of professionally managed global real estate investments amounts to 9.6 trillion U.S.
Dollar, which is both an associated increase of 7.9% and persistent development over one decade. In particular, the European Central Bank also reports of growing market sizes and increasing contribution to GDP due to corporate real estate firms (Santos-Rivera and Gon- zalez Dominguez, 2018). Comparing the figures of 2009 and 2017 their impact raised across all observed European member states on average and range between 2 and 7 percent. The market capitalization and the number of listed corporate real estate firms grew as well in that time span. It also depicts a trend towards going public as the relation between private and public firms almost doubled in the real estate sector across European countries and in the U.S. As of 2020, the European Real Estate Association (EPRA) reports 70% of its index constituents operate as a Real Estate Investment Trusts (REITs).
2Legislators anticipate market consolidations as one can observe more and more coun- tries pursuing to introduce so-called REIT-regimes to provide the possibility for compa- nies to opt for this special firm structure. For European and Asian Markets, this ongoing trend started in the early 2000 and is likely to continue as outlined by Sotelo and Mc- Greal (2016). Today 37 legal authorities introduced REIT like structures. The national rules concentrate along a variety of corporate governance but, in essence, allow market partic- ipants to classify REITs as transparent and internationally recognizable passive, buy and hold, property vehicles of high quality assets exhibiting strictly defined minimum rates of dividend payout obligations. Roth and Kaspar (2016) classify regimes along developed and emerging markets and evaluate their maturity through twelve categories. In general, North American, European, and Asian countries play the decisive role in a global context.
2A special tax-exempted corporate form for (listed) property companies. Depending on the national rules, the companies need to fulfill different obligations on investment, financing, distribution policy and board structure to qualify for this tax-free status. Country portraits are reported annually by EPRA (2020).
other observers.
Given this internationally allocated weight, REITs are regularly subject to studies from practitioners as well as in academic discourse. Both streams agree in an overall positive performance of REITs compared to both other real estate vehicles and competing asset classes. Nevertheless, in a recent paper, Ghosh and Petrova (2020) document a strong link between alternating formal requirements and total returns of REITs. However, the benefits of real estate as an asset class are often attributed to a beneficial risk-return profile deriv- ing from stable rental income and a relatively low correlation with other asset classes such as stocks, bonds and cash equivalents. Although one need to keep in mind that threats of direct real estate investments may not diversify entirely, when pooling them together in a portfolio under the form of real estate funds and companies (Sebastian, 2003), the REIT format favors interests of private and institutional investors for small and diversified investments. For example, inflation-hedging benefits and shrinking idiosyncratic risks.
Studies of Kallberg et al. (1996) measure that partial portfolio allocations of 9% in direct real estate adds to the total returns of equity, bonds and cash holdings, while Bekkers et al.
(2009) state similar risk-reward exposures between direct commercial real estate and REITs.
Delfim and Hoesli (2019) find that REITs are a suitable addition along direct investments for medium- and long-term horizons and should account for up to 20% in an investment portfolio.
For all these empirical evidences and manifold reasons along distinguishing levels of
interest, this dissertation is dedicated to investigating the international REIT universe and
deriving substantial causalities for market participants. In particular, this work seeks to
provide an explanation on the following three dimensions:
I. Factors driving and preventing dynamics in global dispersion of the REIT structure adoption
II. Characterize the conversion-related M&A activity and investigating the resulting post-conversion performance
III. Study the role of uncertainty on managerial decision making to revoke the REIT structure
These major directions subsume various specific research questions and derived hy- potheses, which are subject to separated chapters of this dissertation, each reflecting one academic article outlined as follows.
Chapter 2 seeks to identify beneficial and debilitating factors for listed property compa- nies to opt for the REIT status. The here embedded study reveals frequently but dispersed occurrences on an international scale which is unique to the literature. The employed con- trol variables reflect the national regime heterogeneity and allow more consistent conclu- sions. The results are based on 80 REOC-to-REIT conversions along FTSE EPRA NAREIT global real estate index constituents across 13 developed real estate markets. This allows to draw upon a qualitative robust and representative sample of eligible companies. The causal inference highlights only a small impact of stylized regime facts, such as the tax ben- efit, but reveals herding and managerial moral hazard connections. In particular a strong connection between the market sided undervaluation and personal wealth of firm’s deci- sion makers.
Chapter 3 analyzes the conversion-related portfolio realignments as well as capital in-
flows and measures the following long-run performance implications. As we know from
the academic literature, legislative shocks induce an increasing amount of M&A activity
(Harford, 2005), which, in turn, capture substantial share so economic growth as men-
demic analyses, according to Glascock et al. (2018). This article addresses this gap. The findings are grounded on the identified conversion events of the previous chapter 2. The results show a doubled amount of M&A activity, which are driven by the attracted equity inflows due to the REIT status. The conducted deals are motivated from strategic firm realignment rather than fulfilling regulatory requirements. More M&A active companies achieve superior risk-adjusted returns.
Chapter 4 aims the opposite direction and examines why decision makers decide to refrain the REIT format. It is an analysis of the REIT structure robustness in regard to macroeconomic uncertainty. Combining these two streams implies both a unique research goal to the literature and further an extension to the existing literature, especially for the theories of environment, agency issues, financial distress and negative value gap. Given the timing of deselecting the status, unpredictable market conditions drive firm executive to choose more flexible firm structures. The empirical study is based on both all historical and still active listed U.S. REITs since the regime establishment in 1960 of which over 10%
decided to deselect its REIT format. The methodical approaches utilize recent developed measures of uncertainty for this purpose. The causal inference reveals that incalculable market conditions motivate both healthy and distressed firms to opt for a looser firm struc- ture. This scales with the duration of uncertain periods.
This dissertation is structured as follows. The following three chapter reflect the above
reviewed academic articles. Each indicates additionally the progress of submission to an
academic journal at the beginning. The final chapter of this dissertation brings all findings
together, sums the joint contribution and practical implications as well as provides a sci-
entific outlook for motivating future research.
The REIT Conversion Puzzle
– This paper is the result of a joint project with
René-Ojas Woltering, David H. Downs and Steffen P. Sebastian –
Abstract
Real Estate Investment Trusts (REITs) are a globally recognized form of real estate ownership that
offer tax benefits at a corporate level. Despite their clear advantages, however, a significant share
of potentially eligible Real Estate Operating Companies (REOCs) do not opt for conversion to a
REIT structure. This paper examines 80 REOC-to-REIT conversions across 13 countries. We find
REIT conversions are generally driven by the extent of country-specific tax benefits. They are also
more likely following prior conversions by other REOCs, and in countries with a larger share of
extant REITs. REIT conversions may be motivated by NAV discounts, especially if management’s
compensation is highly equity-based. This illustrates the importance of aligning the interests of
management and shareholders. On the other hand, relatively restrictive REIT criteria, such as the
disclosure and taxation of hidden values during the conversion process, are associated with signif-
icantly lower conversion probabilities. Countries that have eased REIT criteria have subsequently
seen significantly more conversions.
2.1 Chapter Introduction
Since their establishment in the U.S. in 1960, Real Estate Investment Trusts (REITs) have continually gained in popularity around the world. They currently exist in almost 40 countries, with many more in the process of adopting REIT regimes (EPRA, 2018a). In 2020, China announced the introduction of a public REIT structure for its infrastructure property companies (Reuters, 2020). The key advantage of a REIT structure relative to a Real Estate Operating Company (REOC) is liberation from corporate income taxes. The nuances of the regulations that govern REIT status differ across countries, but all require the majority of assets and/or income to be derived from real estate. REITs are also required to distribute most of their earnings to investors in the form of dividends.
As a result of these common characteristics, REITs have become a globally recognized
form of real estate ownership for retail and institutional investors seeking liquid vehicles
to invest in high-quality properties (Downs et al., 2019). The literature provides clear evi-
dence in favor of REIT conversions, i.e., REOCs adopting the REIT structure. For example,
Damodaran et al. (1997) document a significant increase in net income for U.S. REOCs
following adoption of a REIT structure. Delcoure and Dickens (2004) find that U.S. RE-
ITs have lower systematic risk and lower agency costs than REOCs. Moreover, Bond and
James (2004) and Rehkugler et al. (2012) find that European REITs trade at significantly
higher NAV premiums than REOCs. Damodaran et al. (2005), Brounen et al. (2013), and
Piao et al. (2017), using U.S. data, all find positive cumulative abnormal returns following
the announcement of a REOC-to-REIT conversion. Beracha et al. (2019) observe increas-
ing efficiency among U.S. REITs in the past ten years and estimate an associated reward
through a higher market valuation of 4% annually. Given these distinct benefits, it is thus
puzzling that the share of REITs relative to REOCs remains low in many countries. Why
do the managers of potentially eligible REOCs forgo the advantages of REIT structures, in
particular, the valuable tax benefits?
This paper examines the determinants of the REOC-to-REIT conversion decision. The extant literature has tended to focus on post-conversion effects. For example, Damodaran et al. (1997) examine changes in operational performance following organizational form changes, especially REIT conversions and deconversions (REITs reverting back to REOCs).
The authors conclude that their empirical evidence is consistent with REOCs trading off the tax benefits and reduced agency costs of the REIT structure against the associated con- straints on investment and dividend policy. However, they provide no direct evidence about what factors influence the conversion decision. Ling et al. (2020) examine the value implications of REIT conversions and deconversions, and find a positive announcement effect related to conversions. They also identify tax rates and the dividend yield as factors in the 29 U.S. REIT conversions in their sample.
This study contributes to the literature by providing the most comprehensive analysis to date of the factors that impact a REOC’s decision to adopt a REIT structure, as well as which barriers prevent REIT conversions. Our empirical analysis is based on 215 REOCs across 13 countries, of which 80 converted to REITs over the January 1999 – December 2018 period. This global setting enables us to capitalize on substantial cross-country het- erogeneity with respect to tax incentives and local REIT regime requirements. We also analyze the managerial motivations behind REIT conversions, such as undervalued share prices, peer-following behavior, and compensation-related incentives.
We first empirically analyze the REOC-to-REIT conversion decision using a panel logit
model. The dependent variable is binary, and indicates whether a REOC converts to a
REIT in a given period. Since we are interested in the circumstances surrounding the de-
cision, we consider the time lag between the decision and conversion dates. Carlock and
Wilkin (2018) argue that the entire conversion process can take up to 18 months. We also
account for the fact that the conversion decision precedes initiation of the process, so we
lag all explanatory variables by two years. This structure maximizes R-squared, although
our results are robust to shorter and longer lag structures. We use heteroscedasticity and autocorrelation robust standard errors to estimate the regression results. All model speci- fications control for the extent to which a REOC has fulfilled the regulatory REIT require- ments in its country.
We document that the tax benefit appears to be a motivator for REIT conversions. The higher the pre-conversion tax rate paid by a REOC, the higher its probability of adopting the REIT structure. On the other hand, the estimated taxation of hidden reserves triggered by a potential conversion is associated with significantly lower conversion probabilities.
It is therefore a clear barrier for some conversions. These findings contribute to the litera- ture by providing direct evidence for the hypothesis that the REIT–conversion decision is a cost-benefit trade-off.
Note further that our regression results reveal a negative relationship between the REIT–conversion decision and a REOC’s NAV spread. The NAV spread can be interpreted as the degree of over- or undervaluation relative to a firm’s intrinsic value as approximated by its NAV. NAV discounts are associated with higher conversion probabilities. This sug- gests that REOCs may attempt to achieve a more favorable public market valuation by converting to a REIT. In contrast, NAV premiums may signal affirmation of a REOC’s current business strategy, which could be hindered by the constraints associated with con- verting to a REIT.
Turning to market dynamics, we find that REOCs are more likely to convert to REITs
when the share of existing REITs in a country is higher. REIT conversions are also more
likely to occur following recent conversions by other REOCs in the same country. Both
results suggest herd-like behavior in the REIT–conversion decision. Lastly, we explore the
role of managerial incentives in the conversion decision. Empire-building CEOs may be
disincentivized to a certain extent from conducting conversions. This is due to constraints
on reinvestment options as REITs in all countries, such as, e.g., requirements to distribute large portions of income to shareholders. REITs are thus prohibited from reinvesting earn- ings to increase company size, to which CEO base salaries are potentially linked. This requirement may be less of a concern if the CEO’s remuneration is connected to the degree of shareholder value creation, rather than to firm size. We provide evidence that higher equity-based compensation, in the presence of NAV discounts, leads to an even stronger tendency to convert to a REIT structure.
Our research is relevant for many market participants in the listed real estate sector.
As the direct beneficiaries, REOC investors have a major interest in understanding con- version determinants. Financial market regulators will also be interested in the circum- stances under which REIT regimes can reach high levels of adoption. Because we account for differences in national REIT regimes, regulators can draw upon the international ex- perience to identify critical factors for the adoption rate of REIT regimes. Note that, in additional country-level Poisson regressions, we find that easing REIT criteria is associ- ated with significantly more conversions in subsequent periods. This suggests that REIT regime reforms may incentivize conversions if REITs fail to gain traction in a country. Fi- nally, governments and tax authorities are interested in the factors explaining the adoption rates of REIT regimes. From a fiscal perspective, REITs promise a potentially reliable tax income stream resulting from the taxation of dividends at an individual investor level. In contrast, the tax income stream from REOCs may be higher overall, but more volatile and postponed to future fiscal periods as REOCs typically make use of the option to retain earnings and accumulate hidden reserves.
The remainder of this article is organized as follows. The next section reviews the related literature, and develops testable implications about the REIT–conversion decision.
Section 2.3 introduces our data and methodology, while the empirical results are in Section
2.4. The final Section offers our conclusions.
2.2 Related Literature and Hypotheses
2.2.1 Cost-Benefit Trade-Off
Listed real estate companies in countries with REIT regimes can opt to convert to a REIT structure. The question for REOCs is whether they should sacrifice flexibility in investment allocation and profit policy to gain tax-exemption at a company level, as well as other se- lect benefits. The answer may depend on each country’s regulatory restrictiveness, market sentiment, the actions of peers, and firm-specific factors. In this subsection, we first ad- dress the direct implications of REIT conversions, in particular, the tax benefits and the direct tax costs.
Gyourko and Sinai (1999) provide a detailed discussion of the benefits and costs of RE- ITs in general. They highlight the substantial tax savings as a key advantage. Damodaran et al. (1997) examine organizational form changes for real estate corporations, business trusts, MLPs, and REITs, and compare pre- and post-transition financial characteristics.
The authors conclude that firms seem to trade the (dis)advantages of looser and tighter regimes against each other, conditional on their distress level. Their findings indicate taxes are a factor in organizational form changes.
While tax savings are the clearest motivator for REIT conversions, the degree of the
advantage differs among individual REITs. REOCs in countries with higher corporate tax
rates may have a stronger incentive to convert than those in countries with relatively low
tax rates. Among REOCs within the same country, there can be further differences. For
example, some REOCs use substantial levels of financial leverage to maximize their inter-
est tax shield and minimize their income tax burden, whereas other REOCs choose more
conservative financial structures. Chiang et al. (2018) also point out differences in orga-
nizational requirements, tax treatments, and external financing practices across the REIT
sector. Gyourko and Sinai (1999) argue that REITs also benefit from not having to follow
inefficient capital structures in order to generate large deductible tax shields and the asso- ciated hiring costs for consultants, attorneys, and accountants. In turn, we argue that the REIT–conversion decision may be driven by the effective firm-specific income tax rate.
Depending on the regulatory regime, there may be direct costs triggered by the REIT–
conversion process. Many REIT regimes require taxation of unrealized capital gains in the property portfolio as a part of the conversion process (see, for example, Mueller, 2010 and Brounen et al., 2013). Another example comes from the U.K., which, until 2012, imposed a 2% conversion charge on the gross market value of assets. Depending on firm-specific cir- cumstances, the costs can serve as a barrier for REIT conversions. Together, we formulate our first pair of hypotheses, as follows:
Hypothesis 1: Cost-Benefit Trade-Off
Hypothesis 1a:
The REIT–conversion decision is positively correlated with a REOC’s effective income tax rate.
and
Hypothesis 1b:
The REIT–conversion decision is negatively correlated with the direct costs asso- ciated with the conversion (e.g., taxation of unrealized capital gains).
2.2.2 Market Valuation
REITs and REOCs derive the vast majority of their value from the real estate assets on
their balance sheets. This makes them arguably easier to value than most non-real estate
companies. To this end, financial analysts that cover REITs and REOCs commonly use the
NAV, which can be thought of as a "sum of the parts" valuation. At least in theory, there are
few reasons why the price of a REOC would deviate substantially from the market value
of its real estate and other assets less debt. In fact, Patel et al. (2009) provide evidence that
temporary share price deviations from the NAV tend to revert back to a long-term mean.
And Woltering et al. (2018) find that an investment strategy of buying REITs and REOCs with the highest NAV discounts, while shorting those trading at the highest premiums, can produce significant abnormal returns.
We note that shareholders and the management of individual REITs trading at substan- tial NAV discounts may find little consolation in the literature’s observation that substan- tial deviations of share prices from NAV tend to be temporary. Consistent with this idea, Downs et al. (2019) find that U.S. REITs are more likely to be targeted by activist investor campaigns when their share prices are low relative to NAV.
The literature also suggests that REIT status can have a positive impact on price-to- NAV ratio. Rehkugler et al. (2012) and Bond and James (2004) find that REITs tend to trade at higher price-to-NAV ratios than REOCs. Moreover, Damodaran et al. (2005) and Piao et al. (2017) document positive cumulative abnormal returns of REOCs following REIT–conversion announcements. Beracha et al. (2019) observe efficiency gains among U.S. REITs in the 2010–2017 period and report a reward through market valuation of 4%
annually. Together, these findings suggest that REOCs may achieve a more favorable mar- ket valuation, and therefore decrease potential NAV discounts, by converting to REITs.
However, the opposite may be true for REOCs that trade at significant premiums to NAV, because they have fewer incentives to initiate potentially costly changes of their organi- zational forms. More importantly, the constraints associated with REIT structures may restrict this successful business strategy that has thus far been positively perceived by the market. Consequently, we posit that REOCs trading at a high price-to-NAV would be less inclined to convert. Hypothesis 2 reflects the potential impact of a REOC’s stock market valuation on the REIT–conversion decision:
Hypothesis 2:
The REIT–conversion decision is negatively correlated with a REOC’s NAV spread.
2.2.3 Herd Behavior
In addition to company-specific factors, the REIT–conversion decision may also be influ- enced by marketwide trends. For example, the academic literature documents various forms of herding behavior among market participants. According to Wylie (2005), herding occurs when a group of economic agents do not act solely on their own private informa- tion, but instead rely on the choices of other members of their group or peers. Choi and Sias (2009) find strong evidence of herding among institutional investors, who tend to fol- low each other into and out of certain investment sectors. Venezia et al. (2011) examine herding in the context of individual stock holdings, and provide evidence for it among both institutional and private investors.
The REIT–conversion decision, likewise, may be a function of peer group behavior.
For example, when a REIT regime is first introduced in a country, decision makers are likely to observe the actions of their peers before moving ahead on their own. As soon as several REOCs in a country have converted, the decision makers of the remaining REOCs may feel compelled to convert as well. Consistent with this idea, Roth and Kaspar (2016) identify market trends, corporate structure, and the regulatory environment as three of the twelve key areas of focus for REIT managers. Accordingly, our third hypothesis reflects the potential impact of herd behavior on the REIT–conversion decision:
Hypothesis 3:
The REIT–conversion decision is positively correlated with prior conversion deci- sions by industry peers.
2.2.4 Managerial Motivation
Note that a REIT conversion may be in the best interest of shareholders, but the decision
is made by the REOC’s management. Whether they tend to act in the best interest of in-
vestors may be a question of how interests are aligned. The literature documents a variety
of potential conflicts of interest between management and shareholders (see, for example, Jensen and Meckling, 1976 and Chiang et al., 2018). In the context of the REIT–conversion decision, a conflict can arise from the structural constraints the REIT structure imposes on management’s discretion to use cash flows. Ghosh and F. Sirmans (2005) find that man- agement compensation in the REIT sector tends to be linked to firm size. This creates an incentive for so-called empire-building behavior, i.e., a tendency to retain earnings and increase assets under management, rather than distributing cash flows to investors (Graff, 2001).
The literature also documents that appropriate incentive structures lead to an align- ment of interests between management and shareholders. A prominent solution to moti- vate managers is to link their personal wealth to operating efficiency. This can be achieved by tying bonus payments to performance criteria. Another approach is equity-based com- pensation, which ties the manager’s wealth to that of shareholders. Ghosh and F. Sirmans (2005) find that equity-based compensation positively impacts measures such as return on assets, capital, and equity. Consistent with this idea, Damodaran et al. (2005) find that the average insider stock ownership of executives from firms that have changed to stricter organizational forms is 25.6%. In contrast, it is only 2.5% for firms that have changed to looser structures. In order to test whether and how managerial incentives impact the REIT–conversion decision, we formulate our fourth hypothesis as follows:
Hypothesis 4:
The REIT–conversion decision is positively correlated with the level of equity-based
compensation of key executives.
2.3 Data and Methodology
2.3.1 Sample of REIT Conversions
To ensure that the REOCs in our sample are actually potential candidates for REIT con- versions, we base our empirical analysis on constituents of the FTSE EPRA/NAREIT De- veloped Real Estate Index between January 1999 and December 2018. The index includes listed real estate companies that derive at least 75% of total EBITDA from relevant real estate activities, which are defined as the ownership, trading, or development of income- producing real estate. Financing, construction, and property management of real estate are not included under relevant activities. Note that EPRA has minimum free-float market capitalization requirements. Because our sample is based on historic index constituents that are updated on a monthly basis, it is free from survivorship bias (EPRA, 2018a).
In total, our sample is comprised of 215 listed REOCs across 13 countries with REIT regimes: Belgium, Canada, France, Germany, Italy, Netherlands, South Africa, Spain, the U.K., the U.S., Japan, Hong Kong, and Singapore. Although South Africa is an emerging market, we include it as Africa’s most developed country, and because of its significant number of REIT conversions. Australia is not part of our sample because there are no REOCs during our sample period. Ten of the thirteen countries have at least one REIT conversion. The exceptions are Japan, Hong Kong, and Singapore. However, we include REOCs from these countries as counterfactuals, from which we hope to gain information about why they did not convert.
11The identification strategy aims to achieve a suitable counterfactual group among the representative property firms gathered by EPRA/NAREIT. Nadauld (2009) analyzes property companies participating in the creation of a REIT on a global scale. The author collects a sample from various sources and reports of limited evidence or even counter-intuitive results. Therefore, it is a prime goal for this paper to utilize a proper coun- terfactual by using only self-converting listed property companies fulfilling the EPRA rules and by requiring 24 months of listing (as in Ooi et al., 2007). In the end, the sample comprises converted and never-converted listed real estate companies. For the Asian Markets, we investigate spin-offs documented by EPRA and found only 3 relevant events in which an established REOC has created a new REIT. Therefore, we decided to keep a clearly defined counterfactual setting and consequently excluded those firms. Moreover, deselecting the REIT
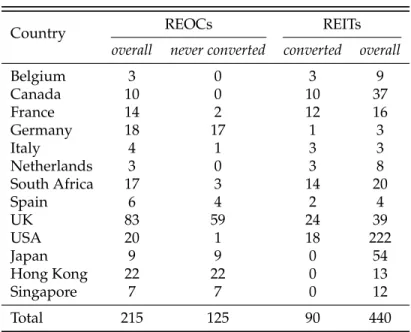
Table 2.1: Distribution of the Listed Real Estate Compa- nies (REOCs and REITs)
Country REOCs REITs
overall never converted converted overall
Belgium 3 0 3 9
Canada 10 0 10 37
France 14 2 12 16
Germany 18 17 1 3
Italy 4 1 3 3
Netherlands 3 0 3 8
South Africa 17 3 14 20
Spain 6 4 2 4
UK 83 59 24 39
USA 20 1 18 222
Japan 9 9 0 54
Hong Kong 22 22 0 13
Singapore 7 7 0 12
Total 215 125 90 440
Note:
This table shows the distribution of REOCs, REITs, and REIT conversions by country and in aggregate over the January 1999 – December 2018 sample period. The first column gives the overall number of REOCs, which is split up into those that never convert (column 2) and those which converted to REITs during our sample period (column 3). Column 4 gives the overall number of REITs, including converted REOCs.We identify conversion events by tracking both the IPO date and the REIT–conversion date. In the case of U.S. companies, this information comes from CRSP share code changes.
For all other countries, we use the S&P Global Market Intelligence database. We carefully screen company reports to complement the data. In total, we observe 90 REIT conversions.
Since we lag all explanatory variables in our main set of tests by 24 months, we lose ten conversions. We end up with a total of 80 REIT conversions.
Table 2.1 shows the distributions of REOCs, REITs, and REIT conversions by country
and in aggregate. The first column reports the overall number of REOCs, followed by
the number that did not convert (column 2), and the number that converted during our
sample period (column 3). Column 4 reports the overall number of REITs, including con-
versions. We note that 41.9% of all REOCs in our sample converted during the sample period. Furthermore, we observe a strong dispersion in REIT conversions across individ- ual countries. In Belgium, Canada, and the Netherlands, all REOCs converted. The vast majority of REOCs in France, Italy, South Africa, and the U.S. also converted. In contrast, few or no conversions took place in the other countries.
Figure 2.1: REIT Conversions, By Country, Over Time
Note:
This figure shows the number of country-level REOC- to-REIT conversions per year over our 1999 – 2018 sample period.Figure 2.1 shows the number of REIT conversions by country and year. The graph re- veals rather continuous conversion activity throughout the sample period. Consistent with Hypothesis 3, the figure also shows that country-level REIT conversions tend to occur in clusters. For example, between 2003 and 2006, we observe a high level of conversions in France. U.K. conversions occurred in two waves between 2007 and 2010, as well as be- tween 2013 and 2018. South African conversions are clustered between 2013 and 2014.
REIT conversions in the U.S. and Canada tend to be more evenly distributed.
Figure 2.2: Number of Listed Real Estate Companies Over Time
050100150
1999 2000 2001 2002 2003 2004 2005 2006 2007 2008 2009 2010 2011 2012 2013 2014 2015 2016 2017 2018 Converted REITs REOCs
Note:
This figure shows the aggregate number of REOCs (red bars) and converted REITs (blue bars) per year over our 1999 – 2018 sample period.Figure 2.2 shows the aggregate number of REOCs (red bars) and converted REITs (blue bars) over our sample period. Despite the steady increase in the number of conversions, a substantial number of potentially eligible REOCs refrained from converting.
2.3.2 Research Design and Variable Definitions
Our primary objective in this paper is to study the determinants of REOC-to-REIT con- versions. Our dependent variable is binary. It equals one if REOC i from country j con- verts to a REIT in quarter t and is zero in all previous quarters. Once a REOC converts to a REIT, it leaves our sample. This allows us to estimate the likelihood of conversion, rather than explaining the REIT structure. Our approach is consistent with Lewis et al.
(2011), who measure the adoption of clean technology in a farming context. Our panel
logit model, shown in Equation 2.1, estimates the impact of the explanatory variables on
REIT–conversion probability
2:
Conversion
i,j,t=
α0+
β1Effective Tax Rate
i,t−8+
β2Exit Tax Costs
i,t−8+
β3N AV Spread
i,t−8+
β4REIT Market Share
j,t−8+
β5Previous Conversions
j,t−1+
β6Cash Compensation
i,t−8+
β7Equity Compensation
i,t−8+
β8N AV Spread
i,t−8x Equity Compensation
i,t−8+
β9Asset Test
i,t−8+
β10Distribution Test
i,t−8+
β11Gearing Test
i,t−8+
β12Ownership Restrictions
j,t−8+
β13Size
i,t−8+
ei,j,t(2.1)
Carlock and Wilkin (2018) posit that the entire conversion process lasts from 12 to 18 months. Since we are interested in explaining the REIT–conversion decision, rather than the conversion date, we lag our explanatory variables by at least 6 quarters. An assessment of the trade-offs precedes initiation of the conversion process. Thus, to mitigate endogene- ity concerns, we lag all explanatory variables, except Previous Conversions, by two years.
3In additional robustness tests reported in Table A.2 in the Appendix, we use shorter time lags and find qualitatively similar results.
Next, we use company-specific and sectorwide variables to model the REIT–conversion decision. First, we examine whether and to what extent the decision is driven by a cost- benefit trade-off (Hypothesis 1). Prior studies have found that corporate taxation is the major benefit associated with the REIT structure for shareholders (see, for example, Gy- ourko and Sinai, 1999). Holding all else equal, REOCs with higher tax rates should be more inclined to convert than those with lower rates (Hypothesis 1a). REOCs’ actual tax rates are not only impacted by their countrywide corporate income tax rates, but also by
2Appendix Table A.1 summarizes the expected empirical implications.
3REOCs generally track the activities of their market competitors. Consequently, this variable captures the
local community tax rates and company-specific factors such as loss carryovers and other deductible tax easements. Therefore, we use the individual REOC’s effective tax rate as a proxy for the tax advantage. We calculate this measure as income tax expense divided by total pre-tax income (obtained from Refinitive’s Thomson Reuters Datastream database).
Subsequently, we account for the costs associated with a REIT conversion - a potential barrier to adopting the REIT structure (Hypothesis 1b). Conversion costs can be split into 1) the one-time costs of aligning the company with REIT qualification requirements, and 2) any ongoing costs for additional REIT corporate compliance requirements. Because we cannot directly observe hypothetical current and future expected costs, we focus on the po- tentially significant conversion costs. For example, all countries, except Singapore, Hong Kong, and South Africa, require an “exit tax” on the hidden reserves that can result from the difference between current market values of properties and their balance sheet values.
The U.K. does not require an exit tax, but applied a conversion charge prior to 2012. Hold- ing all else equal, REOCs with a higher exit tax should be less inclined to adopt the REIT framework. We approximate exit tax costs by multiplying a REOC’s price-to-book ratio (or price-to-NAV ratio in the case of U.S. REITs) by its effective tax rate. The underlying rationale is that hidden reserves are captured by a relatively high market valuation. For example, the NAV can be a lagged measure of true fundamental value in rapidly rising or falling real estate markets because properties are only reappraised every twelve months.
Thus, the stock market valuation may reflect the impact of future reappraisals.
4Hypothesis 2 tests whether undervalued REOCs use REIT conversions to reduce struc- tural NAV discounts, which are relative discounts due to the organizational form. In con- trast, REOCs trading at NAV premiums should show lower probabilities of conversion because they lack the market valuation incentive to change their organizational form. We
4Brähler and Schmidt (2014) show properties reported under IFRS accounting standards contain 20% hid- den reserves on average. We believe the market’s assessment is a good proxy for the difference between the true market value and the reported value.
calculate the NAV spread to measure the impact of market valuation on a REOC’s REIT–
conversion probability as follows:
N AV Spread
i,t= Market Value o f Equity
i,tN AV
i,t− 1 (2.2)
All of our sample countries, except the U.S., use NAV marked-to-market (IFRS versus GAAP). Under IFRS accounting, property values are based on regularly updated appraisal values, so the book value of equity is a good proxy for NAV. In contrast, U.S. REOCs report according to U.S. GAAP accounting, where property values are reported on the balance sheet by historical costs less cumulatively depreciated acquisition costs. Consequently, the book value of equity is not a good proxy for NAV for U.S. REOCs. For this reason, we calculate U.S. REOC NAVs from S&P Global Market Intelligence data (formerly SNL Fi- nancial). Specifically, we average the NAV estimates generated across financial analysts for each REOC as that REOC’s proxy NAV.
We use two proxies to test for the presence of peer-following behavior in the REIT–
conversion decision (Hypothesis 3). First, we test whether a higher share of REITs in a country increases the REOC’s likelihood of following its peers. We measure the share of converted REITs in terms of total market capitalization relative to the combined market capitalization of converted REITs and REOCs in each country (REIT Market Share
j,t−8).
Second, we calculate the rolling sum of REIT conversions in a country over the prior 24
months in order to test for peer-following behavior among REOC executives, or “REIT
waves” (Previous Conversions
j,t−1). An alternative explanation of our herding proxies is
that these variables capture an advantageous policy environment or business cycle for
REIT conversions.
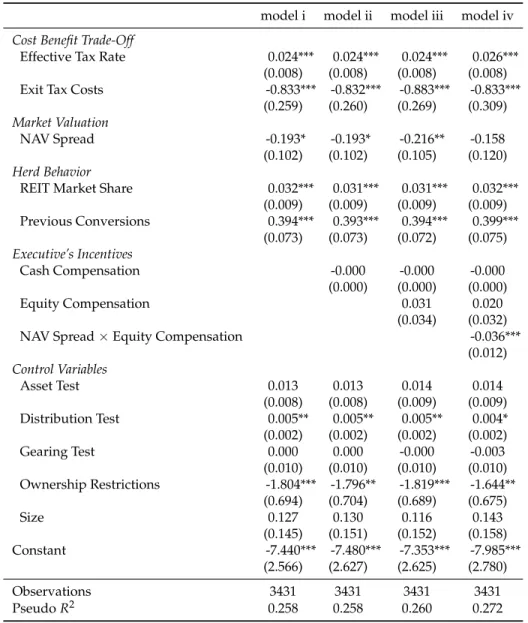
We then test for the role of managerial incentives in the REIT–conversion decision (Hy- pothesis 4) with remuneration data from S&P Capital IQ. We hypothesize that empire- building executives are less inclined to convert to REIT because REIT regulations imply giving up flexibility to maximize firm size. We use the cash compensation of key execu- tives to proxy for a compensation structure that may incentivize empire-building behavior.
Kim and Wiley (2019) and Graff (2001) document that cash remuneration of key executives and firm size are positively correlated. This provides an incentive for executives to maxi- mize their future earnings by increasing firm size.
5We follow Pennathur and Shelor (2002) and Alshammari (2004), and define cash remuneration as the sum of base salary, bonuses, and other cash payments per fiscal year. We then normalize cash compensation using the firm’s enterprise value.
In contrast, key executives may be more inclined to strive for becoming a REIT when their compensation is equity-based, and thus more aligned with the interests of sharehold- ers. The agency-conflict-reducing mechanism of linking compensation to stock perfor- mance is well-documented (see, for example Ghosh and F. Sirmans, 2005 and Damodaran et al., 2005). Following Pennathur and Shelor (2002) and Price et al. (2015), we use the natu- ral logarithm of equity compensation, which includes stocks, grants, and awards paid and credited, but excludes options. We expect a positive impact of equity-based compensation on REIT–conversion probability. Moreover, we include an interaction term between equity compensation and a REOC’s NAV spread to test whether conversions are more likely to occur under the combined presence of NAV discounts and higher degrees of equity-based compensation. Our rationale for this test is that, when the discount to NAV is higher, key executives have more reasons to expect to benefit from share price appreciation, and in turn to earn more equity-based compensation.
5According to Hope and Thomas (2008) and Jensen (1986), a major motivation for empire building are executives striving for cash compensation and status. As a consequence, they may take actions that are at odds with the maximization of shareholder value (Hall, 1999). We focus our attention on this behavior as opposed to lesser, competing theories.
We control for the degree to which REOCs have already fulfilled country-specific REIT criteria as a determinant. Our reasoning here is that a conversion may be more likely if a REOC is already poised to fulfill the legal requirements. At the same time, we also need to control for the fact that REOCs that are further from fulfilling the criteria are more likely to have a lower probability of adopting the REIT structure, regardless of their situation in our hypotheses. We note that a challenge with using our international dataset is that the REIT qualification criteria differ across countries. To achieve comparability across coun- tries, we measure the degree to which a REOC has already fulfilled the criterion relative to the country-specific REIT regulation ratio. If a country has no particular rule about a specific REIT criterion, the corresponding variable is set to zero, which implies no lack of fulfillment on the criterion. Country-specific regulation ratios are time-varying because the REIT requirements can change over time, which happened in several instances. Equa- tion 2.3 shows the sample calculation for the so-called “asset tests”, according to which a REIT’s qualifying assets must represent a minimum fraction of its total assets. For exam- ple, at least 75% of a German REIT’s assets must be invested in real estate. In the U.S., qualifying assets may include real estate, cash, cash items, and government bonds. The variable Asset Test
j,t−8represents the percentage deviation of a REOC’s qualifying assets relative to its respective country-specific regulation ratio:
Asset Testi,t= Qualifying Assets Ratioi,t−National Regulation Ratioj,t
National Regulation Ratioj,t
(2.3)
For the “distribution tests”, REITs are similarly required to fulfill country-specific ratios
for dividend distributions relative to taxable income. As in Equation 2.3, we measure an in-
dividual REOC’s current deviation from the country-specific required ratio. The “gearing
test” also measures the deviation of a REOC’s financial leverage from the country-specific
regulation. We capture any prevailing rules of ownership restrictions using an indicator variable that equals one if country j exhibits certain ownership rules at time t for minimum free-float or block-holding limits. An example from the U.S. is the "five or fewer" rule (see, for example, Downs et al., 2019 and Chiang et al. (2018)).
Our final control variable is firm size, as larger firms may benefit from economies of scale and scope during the REIT–conversion process. For example, their relative costs for obtaining and maintaining REIT status may be lower. We measure firm size as the natural logarithm of a REOC’s total market capitalization.
2.3.3 Summary Statistics
Table 2.2 provides descriptive statistics for our explanatory variables around REIT–conversion dates. The first set of descriptive statistics is for REOCs that convert to REITs. Values are measured 24 months before the official adoption of the REIT structure, and thus reflect the approximate point in time of the REIT–conversion decision. The second set shows the descriptive statistics for the same firms 24 months after conversion. The third and final set is for non-converting REOCs. To ensure comparability, the respective numbers are stacked and averaged over the REIT–conversion dates.
6The average effective tax rate of REOCs 24 months prior to their REIT conversion is 21.73%. Two years after conversion, this percentage drops to 6.12%. Note that the post- conversion effective tax is not zero, however. This is because REITs may face taxation on earnings that are not distributed, or be penalized for not meeting REIT criteria in the form of taxes. REOCs that do not convert tend to have a lower average effective tax rate (17.15%), indicating that the REIT tax structure may offer a lower incentive to use this ben-
6Consistent with Ke (2015), we winsorize the NAV spread at 5% and 95% levels to remove outliers. In addition, REIT test variables and management compensation measures are winsorized at the 1% and 99%
levels.
efit (Hypothesis 1a).
Our proxy for exit tax costs for REOCs 24 months before conversion is − 0.06. This suggests that converting REOCs on average do not seem to possess significant hidden re- serves that would be taxed in the case of a conversion. Once a REOC converts to a REIT, it can no longer be taxed for its hidden reserves, so the number drops to zero. On the other hand, REOCs that do not convert have significantly higher exit tax costs on average. This observation is consistent with cost-based barriers to REIT conversions (Hypothesis 1b).
Converting REOCs trade at NAV premiums. Lending support to Hypothesis 2, we find that, post-conversion, the average NAV spread significantly increases (31% vs. 56%).
REOCs that do not convert tend to trade close to their NAVs. Hence, they have a market valuation-based incentive to change their organizational form. However, the fact that RE- ITs trade at higher positive levels of NAV spreads is also documented by Rehkugler et al.
(2012) and Bond and James (2004).
Before conversion to a REIT, average REIT Market Share per country in our sample is 32.26%. At the corresponding conversion dates, it increases to 59.18% for REOCs that do not convert. Average REIT market share increases substantially two years after REIT con- version (71.31%). By the time of the REIT–conversion decision, there are on average 1.11 prior REIT conversions in the same country. Two years after conversion, this number has increased to 4.45. For non-converting REOCs, it is 2.97.
Cash-based compensation relative to enterprise value shrinks on average after con-
version (2.57 vs. 0.74). In contrast, equity-based compensation of key executives almost
doubles. Non-converting REOCs obtain relatively low levels of cash- and equity-based
compensation on average compared to those that convert.
Moreover, prior to conversion, converting REOCs are substantially closer to fulfilling the financial requirements associated with obtaining a REIT structure than non-converting REOCs. This suggests it is important to control for these factors in testing our hypotheses.
The asset test measures a REOC’s percentage deviation from the minimum required ratio of real estate and other qualifying assets relative to total assets in its country. And convert- ing REOCs are substantially closer to fulfilling the asset test than non-converting REOCs ( − 2.86% vs. − 11.15%). The same holds for the distribution test, where converting REOCs are − 9% below the requirement versus − 60.65% for non-converting REOCs. Moreover, prior to conversion, converting REOCs pass the gearing test, as their leverage ratios are on average 8% below the maximum ratio in their countries. In contrast, non-converting RE- OCs exhibit, on average, a leverage of 1% below the maximum leverage ratio. Also prior to conversion, 54% of converting REOCs are located in countries where the REIT structure is subject to ownership restrictions. REOCs that do not convert tend to be more exposed to ownership restrictions (97%). Thus, this factor may be a barrier to REIT conversions.
The descriptive statistics for our final control variable, Size, are relatively similar for REIT converters versus non-converters.
Appendix Table A.3 provides the correlation matrix of the explanatory variables. All
correlation estimates are well below the threshold of 0.8, suggesting multicollinearity should
not be a concern.
Data and Methodology Table 2.2: Sample Characteristics
REOCs before REIT Conversion REOCs after REIT Conversion REOCs w/o REIT Conversion
mean sd p25 p75 mean sd p25 p75 mean sd p25 p75
Cost-Benefit Trade-Off
Effective Tax Rate [%] 21.73 15.19 7.22 33.01 6.12 8.64 0.25 9.50 17.15 20.46 3.03 24.41
Exit tax costs [level] -0.06 0.88 0.00 0.23 0.00 0.00 0.00 0.00 0.16 0.21 0.03 0.22
Market Valuation
NAV Spread [%] 30.62 131.60 -16 30.5 56.28 216.90 -20 11 4.26 108.71 -42.08 8.86
Herd Behavior
REIT Market Share [%] 32.26 34.82 0.00 62.45 71.31 21.69 54.77 90.58 59.18 7.69 59.76 59.76
Previous Conversions [level] 1.11 1.89 0 2 4.45 3.90 1 7 2.97 0.63 3.14 3.14
Executive’s Incentives
Cash Compensaiton [level] 2.57 11.18 0.14 1.43 0.74 1.45 0.12 0.98 1.36 1.90 .13 1.66
Equity Compensation [level] 3.36 5.53 0.00 8.45 6.27 6.70 0.00 13.47 2.22 3.91 0.00 4.09
Share of Equity Compensation [%] 3.52 7.97 0.00 1.69 9.27 12.99 0.00 15.52 2.72 6.74 0.00 1.22 Control Variables
Asset Test [%] -2.86 30.18 -9.40 17.20 3.18 23.44 -.34 17.70 -11.15 36.96 -32.19 20.54
Distribution Test [%] -9.00 83.47 -78.54 26.16 15.34 81.09 -30.79 44.03 -60.65 47.90 -100.00 -31.4956
Gearing Test [%] -7.99 18.73 0 0 -8.34 17.03 0 0 -.76 8.43 0 0
Ownership Restrictions [level] 0.54 0.50 0 1 0.61 0.49 0 1 0.97 0.17 1 1
Size [level] 14.22 1.59 13.18 15.55 14.79 1.34 13.76 15.89 13.27 1.05 12.41 14.00
Note:
This table provides descriptive statistics on our explanatory variables around REIT–conversion dates. The first set shows descriptive statistics only for REOCs that later converted to REITs exactly 24 months before their official adoption of the REIT structure. The second set shows descriptive statistics for the same companies, but twenty-four months post- REIT conversion. The third and final set of descriptive statistics is for REOCs that did not convert. The respective numbers are averaged over all technical REIT–conversion dates. Detailed variable definitions are in section 2.3.2.2.4 Empirical Results
2.4.1 Company-Specific Determinants and Market Dynamics
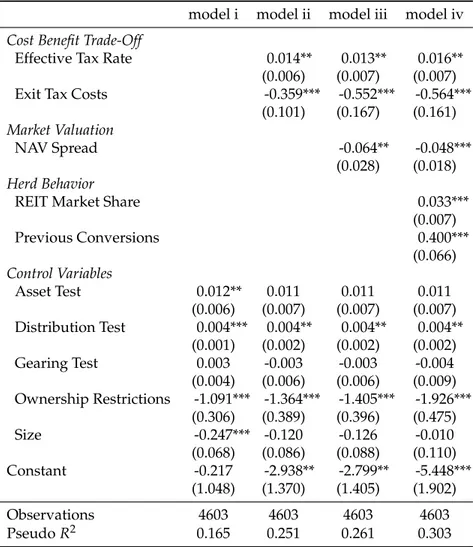
Our empirical results regarding a REOC’s conversion decision are organized into several subsections. In this subsection, we test our first three hypotheses using the full sample of 4, 603 observations. The respective panel logit regression results are in Table 2.3. The model (i) results in the first column focus on the set of control variables. The subsequent models (ii) – (iv) successively introduce the variables used to test Hypotheses 1 – 3. All regression results are estimated controlling for panel-specific heteroscedasticity and auto- correlation. We also control for the introduction of REIT regimes with an indicator variable that equals one in the two years following the introduction of a REIT regime in a country.
7Our empirical conclusions concerning the hypotheses are based on the statistical sig- nificance of the coefficients in model (iv), our main model. As proposed in Downs et al.
(2017), we analyze the economic implications graphically, again based on the model (iv) results. Figures 2.3 – 2.7 show how REIT–conversion probabilities change as a function of the respective explanatory variables, while all other explanatory variables are held con- stant at their pre-conversion means (as shown in Table 2.2).
Before analyzing the tax, managerial, and other incentives and barriers to obtaining the REIT structure, we first focus on our control variables. They measure the extent to which a REOC has already fulfilled the criteria for REIT status. Model (i) reveals that the coefficient on Asset Test
i,t−8is positive and statistically different from zero. Hence, a REOC whose share of real estate assets exceeds the minimum for REITs in its country has a higher conversion probability than those below the threshold. Similarly, the coefficient on DistributionTest
i,t−8is positive and significant.
7An anonymous referee has suggested that the presentation of our results would benefit from considering business cycles and alternative linear model specifications. To address these concerns, we perform robustness checks using linear probability models where we control for country, individual and year fixed effects. The results are remarkably robust and therefore not reported but they are available from the authors upon request.
Table 2.3: Logit Estimation Results of REOC-to-REIT Conversion Likelihood
model i model ii model iii model iv Cost Benefit Trade-Off
Effective Tax Rate 0.014** 0.013** 0.016**
(0.006) (0.007) (0.007) Exit Tax Costs -0.359*** -0.552*** -0.564***
(0.101) (0.167) (0.161) Market Valuation
NAV Spread -0.064** -0.048***
(0.028) (0.018) Herd Behavior
REIT Market Share 0.033***
(0.007)
Previous Conversions 0.400***
(0.066) Control Variables
Asset Test 0.012** 0.011 0.011 0.011
(0.006) (0.007) (0.007) (0.007) Distribution Test 0.004*** 0.004** 0.004** 0.004**
(0.001) (0.002) (0.002) (0.002)
Gearing Test 0.003 -0.003 -0.003 -0.004
(0.004) (0.006) (0.006) (0.009) Ownership Restrictions -1.091*** -1.364*** -1.405*** -1.926***
(0.306) (0.389) (0.396) (0.475)
Size -0.247*** -0.120 -0.126 -0.010
(0.068) (0.086) (0.088) (0.110)
Constant -0.217 -2.938** -2.799** -5.448***
(1.048) (1.370) (1.405) (1.902)
Observations 4603 4603 4603 4603
PseudoR2 0.165 0.251 0.261 0.303
Note:
This table shows the panel logit regression results of a REOC’s decision to convert to a REIT. The unit of obser- vation is the operating status in each quarter. The depen- dent variable equals one if REOCi from countryjconverts to a REIT in quarter t, and zero in all previous quarters.Explanatory variables are the company-specificEffective Tax Rate,Exit Taxestriggered by uncovering hidden reserves and NAV Spreads, as well as country-levelREIT Market Shareand number of Previous REOC-to-REIT Conversions in the same country. Control variables are country-specificREIT criteria and company Size. All independent variables are lagged by two years. The regression results are estimated controlling for a REIT regime introduction indicator variable, and using panel-specific heteroscedasticity and autocorrelation robust standard errors clustered at the company level (in parenthe-
This suggests that REOCs that exceed the minimum share of real estate-related income distributions also obtain a higher conversion probability.
8Figure 2.3: Marginal Effects of Company Effective Tax Rates
.005.01.015.02
REIT Conversion Probability
0 5 10 15 20 25 30 35 40 45 50
Pre-Conversion Effective Tax Rate
Note:
This figure shows how the REIT–conversion probabil- ity changes as a function of company-specific effective tax rate. The predicted probabilities are based on the regression results in Table 2.3, model (iv), where all other explanatory variables are held constant at their pre-conversion means, as shown in Table 2.2.In contrast, the coefficient on GearingTest
i,t−8is not statistically different from zero.
Thus, we find no evidence that restrictions on the extent to which REITs can use financial leverage pose any substantial barrier to REIT conversions. On the other hand, the coef- ficient on the OwnershipRestrictions
j,t−8variable is negative and significant, suggesting that major limitations on concentrations of shareholders are a barrier to REIT conversions in those countries. The impact of our control variables that capture formal REIT criteria are all robust across different model specifications except for Asset Test, which is only sig-
8Appendix Table A.4 provides a direct comparison of our logit regression results using the distribution test versus an approximate regulatory payout rule based on the dividend yield (Ling et al., 2020). Importantly, the distribution test yields superior results in an international context.