Originalbeitrag
Published online: 25 July 2015
© The Author(s) 2015. This article is published with open access at Springerlink.com
A. N. Kerscher () · W. Schäfers
Lehrstuhl für Immobilienmanagement, IRE|BS Institut für Immobilienökonomie, Universität Regensburg,
Universitätsstraße 31, 93040 Regensburg, Germany
e-mail: alexander.kerscher@irebs-core.de W. Schäfers
e-mail: wolfgang.schaefers@irebs.de
Corporate social responsibility and the market valuation of listed real estate investment
companies
Alexander Nikolaus Kerscher · Wolfgang Schäfers
Abstract This study investigates the relationship between the implementation of a corporate social responsibility (CSR) strategy and the corporate financial per- formance of listed real estate investment companies. The sustainability of a com- pany is measured using various self-constructed indices based on the Guidelines of the Global Reporting Initiative (GRI). Overall, a positive relationship can be established. An over-reporting of sustainability information dilutes this relation- ship. Furthermore, investors value initiatives which have a clear and coherent link to the enhancement of future value creation processes such as efforts to mitigate environmental impacts by reducing resource and energy consumption of buildings.
A two-stage least squares regression framework is used to account for the problem of endogeneity.
Keywords Corporate social responsibility · Global Reporting Initiative · Listed real estate · Real Estate Investment Trusts · GRI · CSR · 2SLS · Instrumental Variables · Component-wise Gradient Boosting
Corporate Social Responsibility und die Marktbewertung von börsennotierten Immobilienaktiengesellschaften
Zusammenfassung Die vorgelegte Studie untersucht den Zusammenhang zwischen der Implementierung einer Corporate Social Responsibility (CSR) Strategie und der
finanziellen Performance von börsennotierten Immobilienunternehmen. Zur Messung des Grades der Nachhaltigkeit eines Unternehmens werden Indizes herangezogen, welche auf den Guidelines der Global Reporting Initiative (GRI) basieren. Insgesamt kann ein positiver Zusammenhang festgestellt werden. Eine übermäßige Veröffent- lichung von Informationen zur Unternehmensnachhaltigkeit verwässert diesen Zu- sammenhang. Investoren schätzen insbesondere Nachhaltigkeitsinitiativen, welche einen eindeutigen und kohärenten Bezug zu einer Verbesserung zukünftiger Wert- schöpfung aufweisen. Beispiele für solche Initiativen sind die Verminderung von negativen Auswirkungen auf die Umwelt durch Reduktion von Ressourcen- und Energieverbrauch durch Gebäude. Um das Problem der Endogenität in der empirischen Untersuchung zu berücksichtigen, wird eine zweistufige Regression durchgeführt.
Schlüsselwörter Corporate social responsibility · Nachhaltigkeit ·
Global Reporting Initiative · Immobilien · Real Estate Investment Trusts · GRI · CSR · 2SLS · Instrumental Variables · Component-wise Gradient Boosting
1 Introduction
For long periods in history, societal needs and claims were largely neglected by govern- ments and business. However, in the wake of increasing democratization and progress- ing socioeconomic development in wide parts of Western societies, power relations have undergone considerable change (van Marrewijk 2003). Over time, civil society has gained substantial power which is channeled through NGOs and public organiza- tions. Today, corporations face an increased level of scrutiny from various stakehold- ers and find themselves as part of a complex nexus of distinctive interest groups. In this context, the most pressing drivers of change in societal expectations on business stem from increasing environmental awareness and increasing consumption alongside a shrinking supply of natural resources and geopolitical changes (McKinsey and Com- pany 2007). In order to ensure their long-term viability, corporations have no choice but to adapt to society’s changed expectations and to identify new approaches to strategic management that can meet the challenges thus posed.
As the environmental, social and political developments of recent decades unfolded, the concept of corporate social responsibility (CSR) attracted more and more attention among business leaders. While there is still much debate on what actually constitutes CSR and how it should be integrated into the conduct of busi- ness, business leaders across the board agree on one key insight: that CSR matters and, as a result, warrants incorporation into their company DNA. Indeed, the incor- poration of CSR is seen as one of the most important leadership challenges for busi- ness today. A growing number of organizations promoting a sustainable approach towards strategic management such as the United Nations Global Compact, the International Organization for Standardization or GRI lend support to this observa- tion. A further case in point is the fact that there are only a few, if any, high-profile listed corporations that have not yet made their CSR initiatives a permanent feature of their annual report.
In view of the rising number of real estate investment trusts (REITs) and the inces- sant growth of listed real estate operating companies (REOCs) increasingly gaining influence in the sector, the real estate investment industry cannot afford to ignore these global trends. Porter and Kramer (2006) argue that a company has the obligation to contribute to the solution of societal problems where these coincide with its specific business. There is little doubt that environmental issues are the areas in which the real estate investment industry can contribute the most. According to various sources, buildings are responsible for about 40 % of energy consumption and greenhouse gas emissions worldwide (UNEP 2009; USGBC 2008). Unsurprisingly, governments have identified buildings as a major lever in the fight against climate change and continue to impose stricter laws and regulations in order to reduce their consumption of energy.
Besides more general social areas like, for example, labor practices, the core business of listed real estate investment companies intersects with the expectations of society where public open spaces are concerned. As a consequence, the pro-active integra- tion of CSR into the strategic management of listed real estate investment companies appears to be a reasonable response to today’s urgent and important challenges.
In addition to the aforementioned social and environmental reasons, another major driver for this development is the growing volume of responsibly managed assets belonging to institutional investors. Given the fact that institutional investors are by far the largest shareholders of listed real estate investment companies, meeting their requirements is all the more important for publicly traded companies. According to the Global Sustainable Investment Alliance (2013), the volume of socially responsi- bly managed assets in Europe grew by 22.5 % from USD 7.15 trillion at the end of 2009 to USD 8.76 trillion at the end of 2011. This figure represents around 49 % of all professionally managed assets in Europe.
Consequently, listed companies in general and listed real estate investment com- panies in particular are seen to increasingly adopt the reporting guidelines provided by the GRI in order to enhance their transparency with regard to CSR. The number of worldwide issued GRI-aligned CSR reports rose from about 540 in 2006 to about 2600 in 2012. In the course of the same year, 75 companies from the real estate indus- try reported in line with the GRI framework (GRI 2014).
In this context, it is import to know if enhanced integration of CSR into core busi- ness functions positively affects the market valuation of a listed real estate investment company. In order to make strategic investment decisions, business executives of listed real estate investment companies need to know whether the integration of CSR into core business functions is appreciated and rewarded by investors through higher stock market valuations. This study contributes to the current debate on the profit- ability of CSR engagements by listed real estate investment companies. It employs a sophisticated method to identify the most value relevant CSR areas for an eminently homogenous sample of REITs and REOCs from nine different countries.
2 Literature review
The relationship between corporate social performance (CSP) and corporate financial performance (CFP) has been discussed and empirically examined in various studies
in the past. Probably the most prominent study using meta-analysis techniques to investigate the results of various underlying studies on the CSP-CFP link is con- ducted by Orlitzky et al. (2003) who meta-analyze 52 studies published between 1976 and 1997. Based on a positive average effect-size of 0.184 they conclude that there exists an overall positive association between CSP and CFP.1 This finding holds across industries and study contexts. Nevertheless, the generally positive association between CSP and CFP is mitigated by the choice of CSP and CFP measures as well as the chosen form of operationalization. Thus, the positive relationship between CSP and CFP fluctuates from highly positive to modestly positive across studies. More- over, the authors find no differences in the relationship between CSP and CFP when the studies under examination employ lagged values for the variables of interest. Fur- thermore, the authors suggest that this finding contradicts the trade-off theory which posits that a company which engages in CSR eventually suffers financial losses.
The most comprehensive meta-analysis using studies which investigate the CSP- CFP link was carried out by Margolis et al. (2009). The researchers investigate 251 studies on the subject and confirm an overall positive association between CSP and CFP. The calculated weighted mean effect-size is 0.105. Opposed to Orlitzky et al.
(2003), the authors find different average effect-sizes when the temporal sequence is considered. In the studies under examination, the relationship between CSP and lagged CFP is higher than for lagged CSP and CFP. Nevertheless, this does not con- tradict the virtuous circle theory since both relationships are positive and significant.
Looking closely at some studies from the finance literature investigating the CSP- CFP link yields further insight into the various sources of mitigating effects on the CSP-CFP relationship. In particular, there is evidence for a varying strength of this relationship based on the choice of CSP and CFP proxies, the use of control variables and the application of lagged variables.
Callan and Thomas (2009) conduct a GMM regression using a lagged variable structure. The CSP measures in the equations are from 2004 and all other variables stem from 2005. By this means, the authors are able to draw causal inferences on whether prior CSP influences current CFP. Overall, they report a positive and statisti- cally significant association between the used CSP measures and the CFP measures ROA, ROE and Tobin’s Q, but not ROS.
A different approach to investigating the causal relationship between CSP and CFP is taken by Garcia-Castro et al. (2010) who examine the CSP-CFP link using various proxies for CFP. CSP is measured by an equally weighted KLD index. Employing OLS, they replicate the results of previous studies that a positive and statistically significant relationship exists between CSP and Tobin’s Q, ROA, ROE and MVA.
However, based on the results obtained from a fixed effects model they conclude that the positive CSP-CFP association traces back to unobserved variables. The authors find evidence for the presence of endogeneity. A subsequently conducted 2SLS esti- mation controls for the endogeneity problem and reveals that the initially positive association between CSP and CFP turns insignificant for all four measures of CFP.
1 Within the reported meta-analyses, effect-size r refers to an aggregate measure which is used to investi- gate the CSP-CFP relationship. It is calculated using the (partial) correlations between CSP and CFP or t-statistics reported in underlying studies.
In 2011, Jo and Harjoto published a comprehensive research article providing evi- dence for a positive and very robust association between CSP and CFP. After control- ling for simultaneity bias and endogeneity by using second-stage Heckman regression analysis and an instrumental variables approach, they find a positive relationship between CSP and CFP as measured by an industry-adjusted Tobin’s Q. The authors take this as evidence for the confirmation of their proposed conflict-resolution theory.
According to the conflict-resolution theory, agency conflicts are mitigated, because top-management enhances stakeholder relationships by engaging in CSR activities which in turn positively affects firm value.
Schreck (2011) is the first to use an aggregated CSP measure based on the sus- tainability scorings provided by oekom research AG, a German-based CSR rating agency. Moreover, decomposed measures which refer to single subcategories of CSR are employed. OLS regression analysis reveals that there is no generic positive asso- ciation between CSP and CFP when the aggregate measure for CSP is used. How- ever, the use of CSR subcategory measures shows that “Corporate Governance” and
“Environmental Management” is positively and significantly associated with Tobin’s Q. Neither the employed instrumental variables regression nor the Granger causality tests are able to establish a causal relation that runs from one of the CSR measures to Tobin’s Q. The author concludes that the failure to establish a causal relation between CSP and CFP is predominantly due to the small sample size and limited data.
Erhemjamts et al. (2013) employ the method of OLS to investigate the relationship between CSP and CFP in an inter-industry sample. They find a positive relationship for the overall KLD score and CFP measured by Tobin’s Q and ROA. Additionally, they use a decomposed KLD score as a proxy for CSP. CSR strengths (concerns) are positively (negatively) related to CFP. In order to account for the problem of endogeneity, the authors use instrumental variables and employ the method of 2SLS.
The instruments pass the tests for instrument relevance and instrument exogeneity.
However, in the case of the equations which include only one endogenous regres- sor (overall KLD), the researchers are not able to reject the null hypothesis of weak instruments since the corresponding F statistic is below the critical value of 10 as proposed by Stock and Watson (2007). Nevertheless, after controlling for endogene- ity, the results of the OLS regression are confirmed.
The reviewed articles from the finance literature show that there are various ways of exploring the CSP-CFP link. The most important aspects of the selected studies relate to the operationalization of CSP and CFP as well as to the chosen method for investigating a possible link. In particular, it has become a common practice to account for endogeneity in studies analyzing the CSP-CFP link. Another important point is that the studies provide evidence for the appropriateness of Tobin’s Q as a measure for CFP. However, only two of the reviewed studies from the finance litera- ture employ an international data set. Hence, further research has to investigate the CSP-CFP link in a broader international framework.
Within the real estate literature the analysis of the CSP-CFP link is a rather new branch of research. Nevertheless, there are a number of articles which investigate the business case for CSR in the real estate industry. With regard to the measurement of CSP, Cajias et al. (2011) draw on an approach which has already been observed in the finance literature. Using a sample consisting of real estate service firms, development
companies, real estate investment companies and REITs, the authors employ several CSR scores based on seven dimensions of the KLD database. The applied test yields no evidence for the presence of Granger causality. Nevertheless, the authors find that contemporary CSP as measured by an overall CSR score is associated with a higher CFP as measured by Tobin’s Q. This effect is stronger for a weighted CSR score. For the CSR concerns score they find a negative relationship.
In another study Cajias et al. (2012) measure the CSP of a company by taking account of the amount and quality of reported sustainability information. Based on the GRI Guidelines, the researchers investigate 13 aspects of company reports covering the CSR subcategories “human rights and social responsibility”, “envi- ronmental responsibility”, “financial responsibility” and “transparency and disclo- sure quality”. The authors find that companies engaging in and reporting on overall CSR issues are associated with a higher financial performance at present. In par- ticular, a high performance in the field of employee relations exerts a significantly positive effect. Conversely, they find a negative relationship between the amount of disclosed real estate related sustainability information and asset turnover. The researches cite the high level of disclosure of real estate information which may disclose too much of a company’s operating strategy to the public as one possible reason for this finding.
Among others, the most important benefits of certified buildings are higher trans- action prices, higher rents and higher occupancy rates as compared to non-certified buildings (Dermisi 2009; Eichholtz et al. 2013; Fuerst and McAllister 2011; Reich- ardt et al. 2012). Eichholtz et al. (2012) find evidence that the financial benefits of investing into certified buildings also translate into an increased financial perfor- mance on a corporate level. The authors use LEED and ENERGY STAR certified portfolio space to determine the CSP of a REIT. After accounting for endogeneity, the researchers find that by increasing the share of LEED-certified buildings in the portfolio by 1 % a REIT is able to enhance its ROS by approximately 3.5 %. A 1 % increase of the share of ENERGY STAR-certified buildings in the portfolio is associ- ated with a 0.5 % increase of the REIT’s ROA.
Another research article providing evidence for the translation of green buildings’
superior financial performance into enhanced financial performance on the corporate level is provided by Sah et al. (2013). The authors differentiate between green REITs which are characterized by a corporate policy which is geared to sustainability and usual REITs. Accordingly, the proxy for CSP is introduced as a dummy variable indicating whether a REIT participates in the ENERGY STAR Partnership Program or not. CFP is measured by Tobin’s Q, ROA and abnormal earnings. The authors find that Green REITs, which are found to have a larger share of their property portfolios certified, are associated with higher CFP.
Overall, the findings from the real estate related literature on the investigation of the CSP-CFP link confirm the results obtained from the finance literature. They show that GRI-based measures are a valid proxy for CSP and that Tobin’s Q meets the requirements for an applicable CFP measure which reflects investors’ sentiments.
With regard to real estate, two studies were able to demonstrate that the financial advantages of a green property portfolio translate into an enhanced financial perfor- mance on the corporate level. This is a very important finding in support of the notion
that, especially with regard to the real estate investment industry, sustainability on the product level, i.e. property level, positively affects financial returns on a corporate level.
The majority of the few studies in the real estate literature focus on U.S. compa- nies and the one remaining study includes real estate service companies. In order to gain a more profound insight into the CSP-CFP link on a transcontinental level, it is therefore necessary to perform analyses with a broader international focus. This approach offers the opportunity of creating an exclusive sample of listed real estate investment companies of significant size. Moreover the utilization of the GRI Guide- lines as a proxy for CSP needs to be investigated further, since GRI-aligned reporting offers a convenient and transparent way for listed real estate investment companies to report on sustainability issues.
This study contributes to the current academic debate in the real estate literature in five distinct ways. First, the study focuses solely on listed real estate investment companies whose primary objective is the long-term investment in and management of real estate. All other companies operating in the real estate investment industry, such as real estate investment service providers or home-builders, are excluded. By employing such a homogenous sample the study satisfies the claim for intra-indus- try analyses. Second, most of the existing empirical literature on the subject to date relies on samples taken from U.S. companies. The sample upon which this study is based, by contrast, includes firms from nine countries in Europe, North America and the Asia-Pacific region. Third, this study uses an index based on the GRI reporting framework and the associated Construction and Real Estate Sector Supplement in order to measure a listed real estate investment company’s level of disclosure regard- ing issues of CSR. This approach ensures a precise, industry-specific and compre- hensive measurement of both a company’s engagement with and integration of CSR.
Fourth, an objective method called component-wise gradient boosting is applied in order to identify the most value relevant CSR reporting content. Finally, the method of instrumental variable estimation is used to take into account the increasingly addressed issue of endogeneity.
3 Hypotheses
Based on the literature review above, this study addresses the question whether a positive relationship between CSP as measured by a score based on the GRI Guide- lines as well as the respective Construction and Real Estate Supplement and CFP as measured by Tobin’s Q can be established for a transcontinental sample of 191 listed real estate investment companies. The following hypothesis is put forward to empiri- cally investigate the proposed link:
H1: The amount of disclosed CSR information by a listed real estate investment company is positively related to its market valuation.
The GRI reporting framework is a comprehensive tool to facilitate the dissemination of CSR information by companies as well as the reception of CSR information by
internal and external stakeholders. However, companies from different industries are susceptible to different interests from external and internal stakeholders to dif- ferent extents (Garcia-Castro et al. 2010; Cajias et al. 2011). Putting aside the GRI industry supplements, this raises the question as to whether the “one-size-fits-all”
framework may also lead to an over-reporting on CSR issues and therefore dilute the effect of CSR information which is specifically relevant for the real estate invest- ment industry.
As a consequence, it is of interest whether certain contents in disclosed CSR infor- mation are more value relevant for investors of listed real estate investment companies than others. It seems reasonable that, for instance, real estate specific CSR informa- tion has a larger or at least more significant association with the market value of a listed real estate investment company. Hence the following hypothesis is proposed:
H2: A too comprehensive measurement of CSR mitigates the relationship between CSP and CFP for listed real estate investment companies.
The literature review revealed that accounting for endogeneity increasingly became a common feature of studies investigating the CSP-CFP link. Accordingly, this study also addresses the issue of endogeneity. Thus, a last hypothesis is established.
H3: Reverse causality is present in the relation between the amount of disclosed CSR information by a listed real estate investment company and its market valuation.
4 Methodology
Based on the theoretical considerations as well as the literature review above, the hypotheses stated in the previous section are tested by means of statistical data analy- sis. All statistical calculations are performed with R, a free software environment for statistical computing and graphics.2
The proposed hypotheses are tested in a cross-sectional regression framework using ordinary least-squares estimation (OLS). In a first step, Tobin’s Q is regressed against a CSP score composed of all environmental and social GRI-performance indicators from the GRI Guidelines and the respective Construction and Real Estate Supplement and several control variables. In a further step the comprehensive CSP measure will be replaced by various sub-indices and more focused measures whose composition is explained in the following. Throughout the entire empirical analysis, all coefficient estimates are calculated based on standard errors robust to the presence of heteroscedasticity. The last part of the empirical study addresses the problem of endogeneity by applying the method of instrumental variables estimation and 2SLS.
2 For further information on R see R Core Team (2013). Among other R add−on packages used, the most specific ones are ggplot2, mboost and tonymisc. For more information on R packages refer to the corre- sponding manuals available at http://cran.r-project.org/web/packages/.
5 Sample
The universe from which the sample of listed REOCs and REITs is drawn comprises all active companies listed under the sectors “Real Estate Investment and Services”
and “Real Estate Investment Trusts” of Thomson Reuters Datastream (TRD) as of June 2012. An additional prerequisite is that the firms’ shares must be registered in a country where financial reporting of listed companies is required to be in line with the rules of the International Financial Accounting Standards (IFRS). The selected countries comprise Australia, Canada, France, Germany, Hong Kong, Netherlands, Singapore, Sweden and United Kingdom.
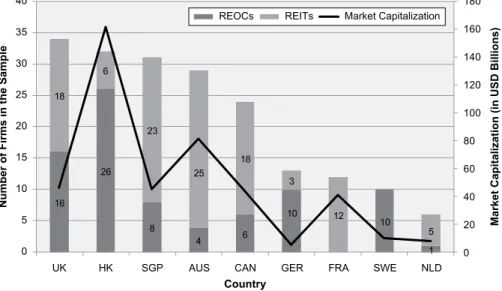
In order to ensure a homogenous sample with regard to company features and characteristics, certain qualifications have to be met. First, companies with a market capitalization of less than USD 50 million as of 31 December 2011 are not taken into account.3 Second, the minimum free float required to be included in the sample is set to 15 %.4 This requirement secures a certain degree of “investibility” and excludes listed real estate companies owned by single parties which are believed not to under- lie market competition for international institutional capital. In a third step, compa- nies whose major field of business is different to the long-term investment in and the operating of real estate are removed from the initial sample. Examples of those companies are real estate development companies as well as real estate consulting companies and real estate service providers. The decision for or against a firm to be included in the sample is based on whether the item IAS 40 investment property is the largest item within non-current assets on the consolidated statement of financial position and on the company’s strategy section in the annual report. In a last step, companies lacking data and annual reports in English are also excluded from the sample.5 Annual reports in English are a vital prerequisite in order to conduct a coher- ent content analysis with regard to the CSR variables. As a result, the final sample comprises 191 listed real estate investment companies (81 REOCs and 110 REITs) from nine different countries. (Fig. 1). Table 1 shows the composition of the final sample by country, REIT-status and aggregated market capitalization.
6 Variable selection and definition
Against the view of Callan and Thomas (2009) who argue that different measures have to be considered when investigating the CSP-CFP link, it is more important to avoid stakeholder mismatching as proposed by Wood and Jones (1995). In order to successfully investigate the CSP-CFP relationship it is therefore critical to employ one appropriate measure of CFP instead of various measures of CFP. The appropri-
3 Exchange rates were retrieved for the 31 December 2011 from the official website of the Financial Man- agement Service (FMS) which is a bureau of the United States Department of the Treasury.
4 The requirements of a minimum market capitalization of USD 50 million and a minimum free float of 15 % are in line with the rules for company inclusion of all four major indices provided by Global Property Research, a renowned provider of property indices.
5 The provision of websites, financial reports and press releases in English is a general recommendation by the EPRA Best Practices Recommendations. For further information see EPRA (2011), p. 5.
ate CFP measure is Tobin’s Q for two major reasons. First, Tobin’s Q consists of two main components, i.e. market value and total assets. It is therefore possible to capture the intangible value of a company’s CSR activities as indicated by a compa- ny’s disclosures. Furthermore, Tobin’s Q reflects the future benefits associated with a CSR engagement. Second, the denominator of Tobin’s Q which reflects replacement costs as proxied by total assets is particularly suited for listed real estate investment companies (Kohl and Schaefers 2012). Due to these companies’ business strategy of holding properties long term, IAS 40 “investment property” is by far the largest item on the balance sheet. According to IFRS regulations, investment properties have to be recognized at fair value and therefore cannot be written off. Moreover, in the case of listed real estate investment companies, most of the future cash flows associated with intangible assets is already incorporated in the balance sheet, because these cash flows are reflected in the annual DCF-based valuation of investment properties. As a consequence, the difference between market value and total assets predominantly refers to future benefits from intangible assets such as good management or the incor- poration of CSR into strategic management.
Three components are necessary to derive the variable for each company, i.e. mar- ket value, total debt and total assets. Since the share price and therefore the mar- ket value of a company change almost continuously, the closing price on the day 3 months after the fiscal year-end is chosen. The reason for this is that most stock- exchanges require listed companies to issue an annual report within 3 months after the end of the fiscal year. This ensures that the latest financial accounting data and information on a firm’s sustainability efforts is distributed and received by inves- tors. As a consequence, the market value already reflects this information. A similar approach is followed by Schreck (2011).
8. +. 6*3 $86 &$1 *(5 )5$ 6:( 1/'
0DUNHW&DSLWDOL]DWLRQLQ86'%LOOLRQV
1XPEHURI)LUPVLQWKH6DPSOH
&RXQWU\
5(2&V 5(,7V 0DUNHW&DSLWDOL]DWLRQ
Fig. 1 Final sample by country, REIT-Status and aggregated market capitalization. (The values on the primary ordinate refer to the columns and the values on the secondary ordinate refer to the line. (Source:
Own illustration))
In order to capture the amount of CSR relevant information provided by listed real estate investment companies and in order to make it comparable among firms, a CSR transparency score is developed. For the purpose of gaining a full insight into a company’s CSR engagement, the underlying content analysis examines not only annual reports but in particular stand-alone CSR reports as well as corporate websites (Unerman 2000). There are various examples of studies using the technique of con- tent analysis based on the GRI Guidelines in the literature on empirical research on CSR (Cajias et al. 2012; Cajias and Bienert 2011; Clarkson et al. 2008; Gamerschlag et al. 2011; Holder-Webb et al. 2009; Plumlee et al. 2010).
The variable CSR83 is a relative measure based on the 83 environmental and social GRI-performance indicators taken from the G3.1 Sustainability Reporting Guidelines and the Construction and Real Estate Sector Supplement.6 Following Gamerschlag et al. (2011), economic GRI-performance indicators are not considered,
6 Although the G4 Guidelines were available during the time of data analysis, the G3.1 version was used, because the data is from 2011/2012 when G4 was still unavailable. As a consequence no company in the sample reported on the GRI-performance indicators firstly introduced in the G4 version. However, it is not expected that using the G4 Guidelines would alter the results in any way.
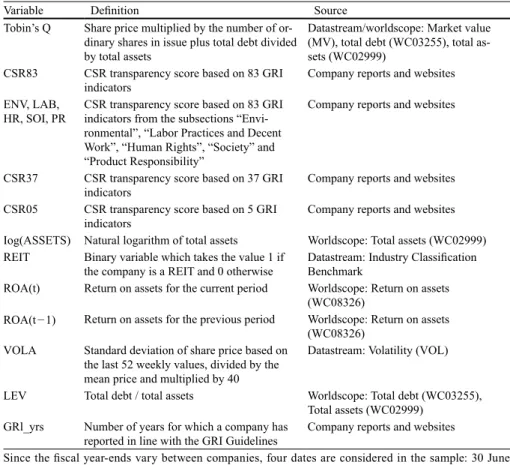
Table 1 Definition and sources of major variables used in this study. (Source: Own illustration)
Variable Definition Source
Tobin’s Q Share price multiplied by the number of or- dinary shares in issue plus total debt divided by total assets
Datastream/worldscope: Market value (MV), total debt (WC03255), total as- sets (WC02999)
CSR83 CSR transparency score based on 83 GRI
indicators Company reports and websites
ENV, LAB,
HR, SOI, PR CSR transparency score based on 83 GRI indicators from the subsections “Envi- ronmental”, “Labor Practices and Decent Work”, “Human Rights”, “Society” and
“Product Responsibility”
Company reports and websites
CSR37 CSR transparency score based on 37 GRI
indicators Company reports and websites
CSR05 CSR transparency score based on 5 GRI
indicators Company reports and websites
Iog(ASSETS) Natural logarithm of total assets Worldscope: Total assets (WC02999) REIT Binary variable which takes the value 1 if
the company is a REIT and 0 otherwise Datastream: Industry Classification Benchmark
ROA(t) Return on assets for the current period Worldscope: Return on assets (WC08326)
ROA(t − 1) Return on assets for the previous period Worldscope: Return on assets (WC08326)
VOLA Standard deviation of share price based on the last 52 weekly values, divided by the mean price and multiplied by 40
Datastream: Volatility (VOL)
LEV Total debt / total assets Worldscope: Total debt (WC03255), Total assets (WC02999)
GRl_yrs Number of years for which a company has
reported in line with the GRI Guidelines Company reports and websites
Since the fiscal year-ends vary between companies, four dates are considered in the sample: 30 June 2011, 30 November 2011, 31 December 2011 and 31 March 2012
as financial reporting according to IFRS is mandatory for all listed real estate invest- ment companies in the sample. Appendix 1 contains a full list of these indicators and corresponding descriptions.
One point is assigned to a company for every GRI-performance indicator which is reported either fully or partially. A zero is allocated in all other cases. The CSR- transparency score CSR83 for a listed real estate investment company is calculated as follows:
(1)
In the case of a company giving justified reasons for why certain indicators are not applicable and therefore not reported, the maximum number of achievable points is reduced by the number of substantiated omissions. CSR83 can take values between zero and one. The sub-indices ENV, LAB, HR, SOI and PR are analogously com- puted by dividing the number of reported GRI-performance indicators by the total number of achievable points in the respective sub-category.
However, the possibility of a problem related to the chosen method of measur- ing the sustainability of a listed real estate investment company cannot be excluded.
A company achieving a high CSR83-score may not necessarily report exclusively on value relevant GRI-performance indicators. The question of whether comments on each and every GRI-performance indicator can be assumed to be value relevant can thus not be avoided. With regard to listed real estate investment companies in developed countries, it would, for instance, be rather precarious to ascribe a value rel- evance to the GRI-performance indicators HR6 or EN27 which require information on business conduct concerning the problem of child labor or packaging of products, respectively. Based on this notion, a strict and full compliance to the GRI Guidelines may lead to an over-estimation of sustainability, due to the reporting of information irrelevant to investors.
Furthermore, it is possible that two companies reporting on the same set of indi- cators achieve a different transparency score. This is the case when a company explicitly states that a certain indicator is not relevant or applicable in which case the denominator would be reduced by one. It is therefore easier for companies that exclude certain indicators to achieve a higher score although the amount of informa- tion provided does not exceed the amount provided by a company which reports on the same set of indicators yet without having excluded any others.
Consequently, a second set of GRI-performance indicators is created. CSR37 is derived in the same way as CSR83, but only refers to 37 GRI-performance indicators which are assumed to be of importance to the investors of listed real estate invest- ment companies. The GRI-performance indicators included in this reduced measure are marked with a “yes” in column 3 of appendix 1. As all indicators are deemed value relevant, substantiated omissions reducing the maximum number of achievable points are not considered.
There is one major weakness in the previously described method of obtaining CSR37 and its respective sub-indices. Despite being based on reasonable grounds, the choice of GRI-performance indicators of supposed relevance for real estate
CSR number of reported GRI performanceindicators maximum
83= − .
number of achievable points
investment companies is, after all, discretionary. To weaken this argument, an addi- tional method of identifying relevant GRI-performance indicators is applied which is fully based on a computational optimization algorithm. Generally, component-wise gradient boosting is a technique used to perform a variable selection based on the associated impact strength of explanatory variables on the dependent variable. The aim of this method is to find the optimal set of explanatory variables to predict an independent variable. In so doing, the method is able to test which GRI-performance indicators included in CSR37 are the most important.7 Analogous to the calculation of CSR83 and CSR37, the five most relevant GRI-performance indicators are chosen to create a new CSR-disclosure variable called CSR05.
The five GRI-performance indicators used to derive CSR05 based on the applica- tion of component-wise gradient boosting are marked with a “yes” in column 4 of appendix 1. The identified GRI-performance indicators come from the GRI-subcat- egories Product Responsibility, Environment and Labor Practices and Decent Work.
This result suggests that in particular those indicators are value relevant which pro- vide information on sustainability in the core-business of real estate investment com- panies, i.e. environmental sustainability in the real estate portfolio.
In order to prevent distorted results, a set of several control variables is included in the analyses. Table 1 provides a overview of all relevant variables used in the study as well as corresponding definitions and sources.
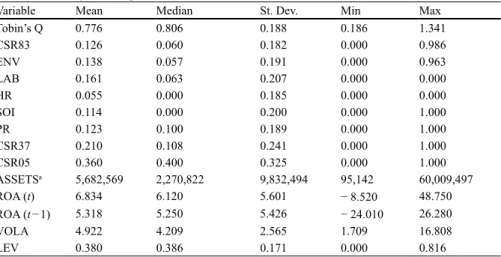
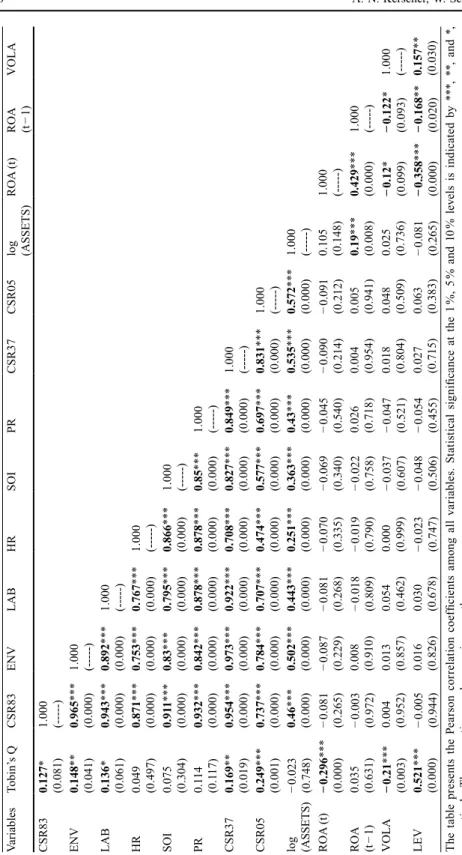
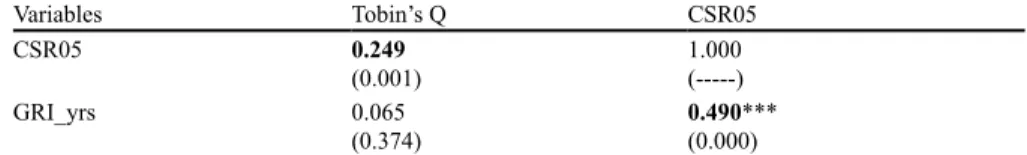
The summaries of descriptive statistics and the Pearson correlation matrix of all variables used throughout this study are depicted in Table 2 and Table 3, respectively.
7 See Hofner et al. (2014) for a comprehensive introduction to component-wise gradient boosting and its application using R.
Table 2 Summary of descriptive statistics
Variable Mean Median St. Dev. Min Max
Tobin’s Q 0.776 0.806 0.188 0.186 1.341
CSR83 0.126 0.060 0.182 0.000 0.986
ENV 0.138 0.057 0.191 0.000 0.963
LAB 0.161 0.063 0.207 0.000 0.000
HR 0.055 0.000 0.185 0.000 0.000
SOI 0.114 0.000 0.200 0.000 1.000
PR 0.123 0.100 0.189 0.000 1.000
CSR37 0.210 0.108 0.241 0.000 1.000
CSR05 0.360 0.400 0.325 0.000 1.000
ASSETSa 5,682,569 2,270,822 9,832,494 95,142 60,009,497
ROA (t) 6.834 6.120 5.601 − 8.520 48.750
ROA (t − 1) 5.318 5.250 5.426 − 24.010 26.280
VOLA 4.922 4.209 2.565 1.709 16.808
LEV 0.380 0.386 0.171 0.000 0.816
St. Dev. standard deviation, Min and Max minimum and maximum values per variable
aThe variable ASSETS is given in USD thousands
Table 3Pearson correlation matrix VariablesTobin’s QCSR83ENVLABHRSOIPRCSR37CSR05log (ASSETS)ROA (t)ROA (t − 1)VOLA CSR830.127* (0.081) 1.000 (---)
ENV0.148** (0.041)0.965*** (0.000) 1.000 (---)
LAB0.136* (0.061)0.943*** (0.000)0.892*** (0.000) 1.000 (---)
HR
0.049 (0.497) 0.871*** (0.000)0.753*** (0.000)0.767*** (0.000) 1.000 (---)
SOI
0.075 (0.304) 0.911*** (0.000)0.83*** (0.000)0.795*** (0.000)0.866*** (0.000) 1.000 (---)
PR0.114 (0.117)0.932*** (0.000)0.842*** (0.000)0.878*** (0.000)0.878*** (0.000)0.85*** (0.000) 1.000 (---)
CSR370.169** (0.019)0.954*** (0.000)0.973*** (0.000)0.922*** (0.000)0.708*** (0.000)0.827*** (0.000)0.849*** (0.000) 1.000 (---)
CSR050.249*** (0.001)0.737*** (0.000)0.784*** (0.000)0.707*** (0.000)0.474*** (0.000)0.577*** (0.000)0.697*** (0.000)0.831*** (0.000) 1.000 (---)
log (ASSETS)− 0.023 (0.748)0.46*** (0.000)0.502*** (0.000)0.443*** (0.000)0.251*** (0.000)0.363*** (0.000)0.43*** (0.000)0.535*** (0.000)0.572*** (0.000) 1.000 (---)
ROA (t)− 0.296*** (0.000)− 0.081 (0.265)− 0.087 (0.229)− 0.081 (0.268)− 0.070 (0.335)− 0.069 (0.340)− 0.045 (0.540)− 0.090 (0.214)− 0.091 (0.212) 0.105 (0.148) 1.000 (---)
ROA (t − 1)
0.035 (0.631)
− 0.003 (0.972)
0.008 (0.910)
− 0.018 (0.809)− 0.019 (0.790)− 0.022 (0.758) 0.026 (0.718) 0.004 (0.954) 0.005 (0.941)
0.19*** (0.008)0.429*** (0.000)
1.000 (---)
VOLA− 0.21*** (0.003)
0.004 (0.952) 0.013 (0.857) 0.054 (0.462) 0.000 (0.999)
− 0.037 (0.607)− 0.047 (0.521) 0.018 (0.804) 0.048 (0.509) 0.025 (0.736)
− 0.12* (0.099)− 0.122* (0.093) 1.000 (---)
LEV0.521*** (0.000)− 0.005 (0.944) 0.016 (0.826) 0.030 (0.678)
− 0.023 (0.747)− 0.048 (0.506)− 0.054 (0.455) 0.027 (0.715) 0.063 (0.383)
− 0.081 (0.265)− 0.358*** (0.000)− 0.168** (0.020)0.157** (0.030) The table presents the Pearson correlation coefficients among all variables. Statistical significance at the 1 %, 5 % and 10 % levels is indicated by ***, **, and *, respectively. The respective p-values are in parentheses
7 Empirical results
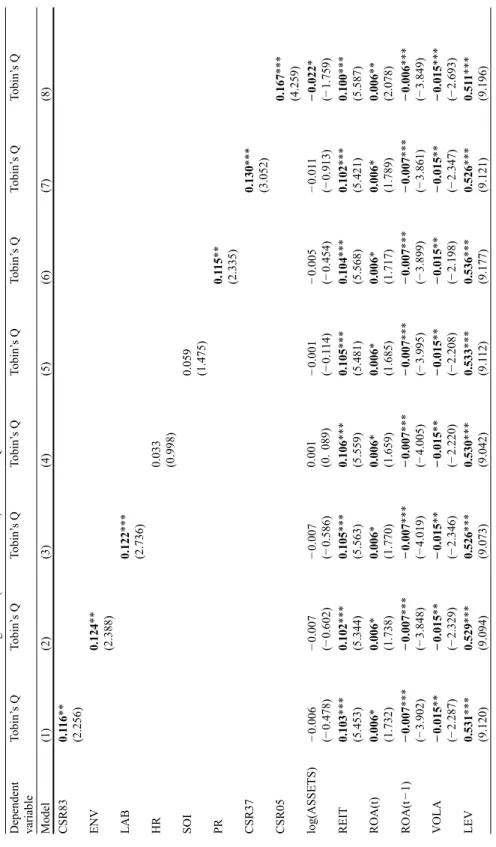
This section introduces the results of the cross-sectional regression analysis using OLS. Tobin’s Q is regressed separately on CSR83 and its sub-indices as well as on a set of several control variables in models (1)–(6). Model (7) and model (8) introduces CSR37 and CSR05, respectively, to explain the variation in Tobin’s Q. The results are presented in Table 4.
Model (1) represents the CSR83 base model. The coefficient estimate for CSR83 is 0.116 and statistically significant at the 5 % level. The increase or decrease of CSR83 is only possible by a multiple of 1205 % points, because reporting on one more GRI-performance indicator invariably leads to an increase of 1205 (= 100/83)
% points. According to the model, the additional reporting on one more GRI-per- formance indicator is on average associated with an increase of Tobin’s Q by 0.002 holding all other factors constant. Thus, the theoretical difference in Tobin’s Q of a company which fully reports on all GRI-performance indicators and a company which does not report on any GRI-performance indicators is 0.116, all other factors held fixed. Models (2)–(6) are analogous to the base model but use the single com- ponents of CSR83 to explain the variation in Tobin’s Q. The coefficient estimates for all sub-indices of CSR83 show positive signs as expected. However, even though the coefficient estimates for ENV, LAB and PR are statistically significant at least on the 5 % level, it is not possible to reject the null hypothesis that the coefficient estimates of HR and SOI are different from zero. Insofar, when decomposing CSR83 into its main components, only ENV, LAB and PR seem to be value relevant.
Instead of CSR83 model (7) uses CSR37 as proxy for CSP. Besides the increased adjusted R2 (0.474) which provides evidence for a better model fit, also the coef- ficient estimate of CSR37 increases in magnitude and is now highly significant. In summary, using CSR37 instead of CSR83 yields more robust results. Taking into account the removal of the over-reporting bias, the general enhancement of the model can be considered as reasonable. Nonetheless, the method used to derive CSR37 is highly arbitrary and the doubts regarding its sufficiency cannot be dispelled. In view of these limitations, model (8) uses the computationally derived CSR05 vari- able which comprises the five most influential GRI-performance indicators. The five CSR-performance indicators can be found in column 5 of appendix 1.
Using CSR05 as a proxy for CSP in model (8) improves the overall model fit fur- ther as the adjusted R2 is now 0.509. As compared to model (7) both the magnitude as well as the significance of the CSP coefficient estimate increase. In conclusion, focusing on just a few very value relevant GRI-performance indicators yields more robust and less diluted results.
All control variables, except log(ASSETS), are statistically significant at least on the 10 % level across all eight models. The variable log(ASSETS) only becomes significant in the CSR05 model. The insignificance of log(ASSETS) for most of the models mirrors the results of Callan and Thomas (2009) and Garcia-Castro et al.
(2010). Across all models, REITs are supposed to show a Tobin’s Q which is on average around 0.100 higher than the Tobin’s Q for REOCs, holding all other factors constant. ROA of the current period is positively correlated with Tobin’s Q, whereas ROA of the previous period is negatively correlated with Tobin’s Q. However, the
Dependent variable
Tobin’s QTobin’s QTobin’s QTobin’s QTobin’s QTobin’s QTobin’s QTobin’s Q Model(1)(2)(3)(4)(5)(6)(7)(8) CSR830.116** (2.256) ENV0.124** (2.388) LAB0.122*** (2.736) HR
0.033 (0.998)
SOI
0.059 (1.475)
PR0.115** (2.335) CSR370.130*** (3.052) CSR050.167*** (4.259) log(ASSETS)− 0.006 (− 0.478)− 0.007 (− 0.602)− 0.007 (− 0.586)
0.001 (0. − 0.001− 0.005− 0.011− 0.022* 089)(− 0.114)(− 0.454)(− 0.913)(− 1.759) REIT0.103***0.102***0.105***0.106***0.105***0.104***0.102***0.100*** (5.453)(5.344)(5.563)(5.559)(5.481)(5.568)(5.421)(5.587) ROA(t)0.006*0.006*0.006*0.006*0.006*0.006*0.006*0.006** (1.732)(1.738)(1.770)(1.659)(1.685)(1.717)(1.789)(2.078) ROA(t − 1)− 0.007***− 0.007***− 0.007***− 0.007***− 0.007***− 0.007***− 0.007***− 0.006*** (− 3.902)(− 3.848)(− 4.019)(− 4.005)(− 3.995)(− 3.899)(− 3.861)(− 3.849) VOLA− 0.015**− 0.015**− 0.015**− 0.015**− 0.015**− 0.015**− 0.015**− 0.015*** (− 2.287)(− 2.329)(− 2.346)(− 2.220)(− 2.208)(− 2.198)(− 2.347)(− 2.693) LEV0.531***0.529***0.526***0.530***0.533***0.536***0.526***0.511*** (9.120)(9.094)(9.073)(9.042)(9.112)(9.177)(9.121)(9.196)
Table 4Results of the cross-sectional regression (OLS estimation) of Tobin’s Q on various CSR-variables and control variables
Dependent variable
Tobin’s QTobin’s QTobin’s QTobin’s QTobin’s QTobin’s QTobin’s QTobin’s Q Model(1)(2)(3)(4)(5)(6)(7)(8) Intercept0.671*** (25.440)0.695*** (25.519)0.685*** (25.903)0.590*** (24.918)0.615*** (25.042)0.661*** (25.851)0.739*** (26.414)0.877*** (32.504) N191191191191191191191191
F-Statistic (25.440***25.519***25.903***24.918***25.042***25.851***26.414***32.504*** p-value)(0.000)(0.000)(0.000)(0.000)(0.000)(0.000)(0.000)(0.000) 2Adjusted R0.4640.4660.4690.4550.4580.4650.4740.509 The table presents the estimators for the coefficients of the OLS regression of Tobin’s Q on various CSR-variables and control variables. T-values are calculated on the basis of White heteroscedasticity-robust standard errors and presented in parentheses below the respective estimates. Statistical significance at the 1 %, 5 % and 10 % level is indicated by ***, **, and *, respectively
Table 4(continue)
economic significance of both is rather low, given the very small values of the respec- tive coefficient estimates. In line with various other empirical studies which also measure risk by the variation in stock returns, VOLA is negatively associated with Tobin’s Q (Cajias et al. 2011; Cajias et al. 2012; Erhemjamts et al. 2013). LEV, how- ever, is positively related to long-term financial profitability. This stands in contrast to the findings of Erhemjamts et al. (2013) and Schreck (2011) but corresponds to the findings of Garcia-Castro et al. (2010) and Cajias et al. (2011).
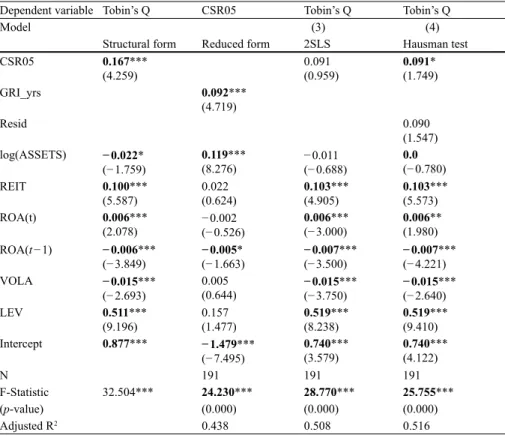
As has been shown, the problem of endogeneity is being increasingly addressed in studies examining the link between CSP and CFP. Hence, this study also takes this issue into account. With regard to the present problem, the structural form equation and the reduced form equation are:
(2)
and
(3)
respectively.
In the case at hand, the variable CSR05 is suspected to be endogenous. The reason for this assumption goes back to the potential correlation between CSR05 and the error due to reverse causality. The variable GRI_yrs is defined as described in Table 1.
It is assumed that after a listed real estate investment company has decided to address sustainability issues within the annual company reporting, the company’s ability and willingness to report on CSR relevant matters increases over time. This means that the longer a company reports on CSR relevant issues, the higher the amount and qual- ity of publicized CSR information. The variable GRI_yrs is thus taken to accurately predict CSR05 and in turn serves as an appropriate instrument for CSR05 (Table 5).
For the sake of clarity, model (1) illustrates the same model as model (8) in Table 4 which equals the structural form Eq. (2) in this case. Model (2) depicts the estima- tion results for the reduced form Eq. (3) using CSR05 as the dependent variable and GRI_yrs as the explanatory variable of interest or instrument, respectively. The coef- ficient estimate of GRI_yrs is 0.092 and is significant at the 1 % level. This result sug- gests that listed real estate investment companies which report in accordance with the GRI Guidelines for many years are more likely to report on the five GRI-performance indicators which are included in CSR05. A glance at the estimator for log(ASSETS) reveals that larger firms show a higher propensity to report on the CSR05-indicators, as the coefficient estimate is positive and also significant at the 1 % level. The F-sta- tistic (which is not reported in the table) used to test the null hypothesis that the coef- ficient estimate of GRI_yrs is zero confirms the assumption of instrument relevance.
It indicates a value of 22.264 which is well above the critical value of 10 as pro- posed by Stock and Watson (2007) and therefore rejects the null hypothesis of a weak instrument. With regard to the requirement of instrument exogeneity, it is not possible to conduct an empirical test since GRI_yrs is the only instrument and the model is
Tobins Q CSR ASSETS REIT ROA t
ROA t
log
= + +
( )
+ +( )
+ −
β β β β β
β
0 1 2 3 4
5
05
(( )
1 +β6VOLA+β7LEV +u_ log
CSR GRI yrs ASSETS REIT ROA t
ROA t 05
1
0 1 2 3 4
5
= + +
( )
+ +( )
+ −
β β β β β
β