Encoding, Storing and Searching of Analytical Properties and Assigned Metabolite Structures
I n a u g u r a l - D i s s e r t a t i o n zur
Erlangung des Doktorgrades
der Mathematisch-Naturwissenschaftlichen Fakultät der Universität zu Köln
vorgelegt von
Tobias Helmus
aus Münster
Köln, 2007
Berichterstatter: PD Dr. C. Steinbeck
Prof. Dr. D. Schomburg
Tag der mündlichen Prüfung: 11.06.2007
Abstract
Metabolites and other small organic molecules are of major importance in many different fields of natural sciences. They play crucial roles in metabolic networks, and knowledge about their properties and interactions helps to understand complex biological processes and whole biological systems. Thus, data describing small organic molecules on a structural level is recorded in a multitude of biological and chemical laboratories on a daily basis.
Consequently, a large amount of highly interconnected data already exists and continuously is produced. This leads to a strong need for software systems and data formats supporting the scientists in exchanging, processing, storing and searching molecular data under preservation of its semantics.
The aim of this project was to develop tools, applications and algorithms to be used for the efficient encoding, collection, normalisation and analysis of this data. These should be supportive in the process of dereplication, structure elucidation, analysis of molecular interactions and publication of the so gained knowledge. It frequently is impossible, or at least very difficult and time consuming, to determine the structure and functionality of an unknown compound directly. Therefore, this commonly is realised indirectly by describing a molecule via its properties. In a next step, these properties can be used to predict its structural and functional features.
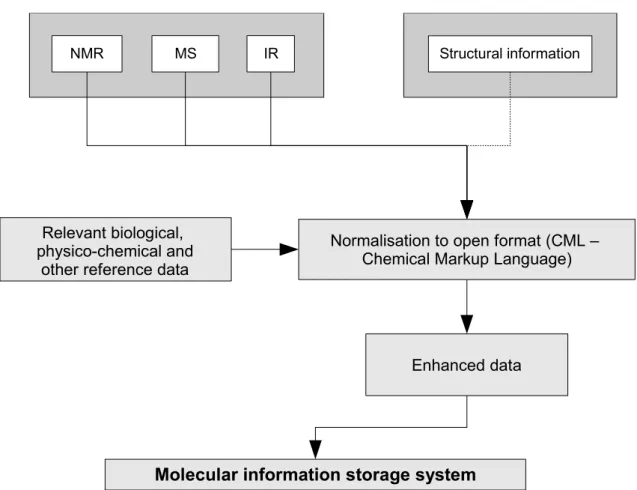
In this context, tools were developed, that allow the visualisation of structural and spectral data, the structured displaying and manipulation of extending meta data and properties as well as the import and export of a variety of spectroscopic and structural data formats. This functionality was extended by applications enabling the assignment of structural and spectroscopic features to each other and analysis methods. Additionally, a framework for the structured deposition and management of large amounts of molecular data in the file system and in various relational database systems was created. To ensure the lossless encoding of spectroscopic data under preservation of its semantics, an open, standardised and highly structured data specification was defined - CMLSpect. CMLSpect is extending the existing CML (Chemical Markup Language) vocabulary and therewith allows for easy handling of connected structural and spectroscopic information.
The set of applications and methods developed in the course of this project was integrated
into the Bioclipse platform for bio- and chemoinformatics, providing the user with a high
quality interface and developers with an easy to extend plug-in architecture.
Zusammenfassung
Informationen über Metabolite und andere kleine organische Moleküle sind von entscheidender Bedeutung in vielen verschiedenen Bereichen der Naturwissenschaften. Sie spielen z.B. eine entscheidende Rolle in metabolischen Netzwerken und das Wissen über ihre Eigenschaften, hilft komplexe biologische Prozesse und komplette biologische Systeme zu verstehen. Da in biologischen und chemischen Laboren täglich Daten anfallen, welche diese Moleküle beschreiben, existiert eine umfassende Datengrundlage, die sich kontinuierlich erweitert. Um Wissenschaftlern die Verarbeitung, den Austausch, die Archivierung und die Suche innerhalb dieser Informationen unter Erhaltung der semantischen Zusammenhänge zu ermöglichen, sind komplexe Softwaresysteme und Datenformate nötig.
Das Ziel dieses Projektes bestand darin, Anwendungen und Algorithmen zu entwickeln, welche für die effiziente Kodierung, Sammlung, Normalisierung und Analyse molekularer Daten genutzt werden können. Diese sollen Wissenschaftler bei der Strukturaufklärung, der Dereplikation, der Analyse von molekularen Wechselwirkungen und bei der Veröffentlichung des so gewonnenen Wissens unterstützen. Da die direkte Beschreibung der Struktur und der Funktionsweise einer unbekannten Verbindung sehr schwierig und aufwändig ist, wird dies hauptsächlich indirekt, mit Hilfe beschreibender Eigenschaften erreicht. Diese werden dann zur Vorhersage struktureller und funktioneller Charakteristika genutzt.
In diesem Zusammenhang wurden Programmmodule entwickelt, welche sowohl die
Visualisierung von Struktur- und Spektroskopiedaten, die gegliederte Darstellung und
Veränderung von Metadaten und Eigenschaften, als auch den Import und Export von
verschiedenen Datenformaten erlauben. Diese wurden durch Methoden erweitert, welche es
ermöglichen, die gewonnenen Informationen weitergehend zu analysieren und Struktur-
und Spektroskopiedaten einander zuzuweisen. Außerdem wurde ein System zur
strukturierten Archivierung und Verwaltung großer Mengen molekularer Daten und
spektroskopischer Informationen, unter Beibehaltung der semantischen Zusammenhänge,
sowohl im Dateisystem, als auch in Datenbanken, entwickelt. Um die verlustfreie
Speicherung zu gewährleisten, wurde ein offenes und standardisiertes Datenformat definiert
(CMLSpect). Dieses erweitert das existierende CML (Chemical Markup Language)
Vokabular und erlaubt damit die einfache Handhabung von verknüpften Struktur- und
Spektroskopiedaten.
Die entwickelten Anwendungen wurden in das Bioclipse System für Bio- und
Chemoinformatik eingebunden und bieten dem Nutzer damit eine hochqualitative
Benutzeroberfläche und dem Entwickler eine leicht zu erweiternde modulare
Programmarchitektur.
Abbreviations
ANDI Analytical Data Interchange
AnIML Analytical Information Markup Language
API Application Programming Interface
ASCII American Standard Code for Information Interchange
ASTM American Society for Testing and Materials
AWT Abstract Window Toolkit
BibTeXML BibTeX Markup Language
BioML Biopolymer Markup Language
BSML Bioinformatic Sequence Markup Language
CAS Chemical Abstract Service
CASE Computer Assisted Structure Elucidation
CDK Chemistry Development Kit
CI Chemical Ionisation
CML Chemical Markup Language
COSY Correlation Spectroscopy
DOM Document Object Model
DTD Document Type Definitions
EBI European Bioinformatics Institute
EI Electron Impact Ionisation
ELN Electronic Lab Notebook
EPL Eclipse Public License
ESI Electrospray Ionisation
FAB Fast Atom Bombardment
FAQ Frequently Asked Questions
GUI Graphical User Interface
HMBC Heteronuclear Multiple Bond Coherence
HQL Hibernate Query Language
HSQC Heteronuclear Single Quantum Coherence
HSQL Hypersonic SQL Database
HTML Hypertext Markup Language
IDE Integrated Development Environment
InChI IUPAC International Chemical Identifier
IR Infrared
IUPAC International Union of Pure and Applied Chemistry J2EE Java 2 Platform, Enterprise Edition
JCAMP Joint Committee on Atomic and Molecular Physical Data
JDBC Java Database Connectivity
JFC Java Foundation Classes
LAN Local Area Network
LGPL GNU Lesser General Public License
LIMS Laboratory Information Management System MALDI Matrix Assisted Laser Desorption Ionisation
MathML Mathematical Markup Language
MS Mass Spectrometry
NIST National Institute of Standard
NMR Nuclear Magnetic Resonance
NOESY Nuclear Overhauser Enhancement Spectroscopy
OLE Object Linking and Embedding
OS Operating System
OSGI Open Services Gateway Initiative
OSI Open Source Initiative
PCA Principal Component Analysis
PDB Protein Data Bank
PDBML Protein Data Bank Markup Language
PNG Portable Network Graphics
QSAR Quantitative Structure-Activity Relationship
RCP Rich Client Platform
RDBMS Relational Database Management System
RDF Resource Description Framework
RSS Rich Site Summary, RDF Site Summary or Really Simple Syndication
SBML Systems Biology Markup Language
SGML Standard Generalized Markup Language
SMF Service Management Framework
SMILES Simplified Molecular Line Entry Specification
SOA Service Oriented Architecture
SOAP Simple Object Access Protocol
SQL Structured Query Language
STMML Scientific-Technical-Medical Markup Language
SVG Scalable Vector Graphics
SWT Standard Widget Toolkit
TCOSY Total Correlation Spectroscopy
UI User Interface
URI Uniform Resource Identifier
UV Ultraviolet
VM Virtual Machine
W3C World Wide Web Consortium
WAN Wide Area Network
WSDL Web Service Description Language
XHTML Extensible HyperText Markup Language
XLink XML Linking Language
XML Extensible Markup Language
XPath XML Path Language
XPointer XML Pointer
XQuery XML Query Language
XSD XML Schema Definition
XSL Extensible Stylesheet Language
XSL-FO XSL Formatting Objects
Index of Tables
Table 1: Overview of the most important molecular elements contained in the CML core
definition... 92
Table 2: The spectrum specific CML elements... 99
Table 3: CML elements commonly occurring in CML encoded spectral data...103
List of Figures Data accumulation within the "omics" towards systems biology... 1
Diagram visualising the concept of choke points... 2
Diagram of a potential information flow in life sciences... 4
Schematic model of dereplication process and CASE... 9
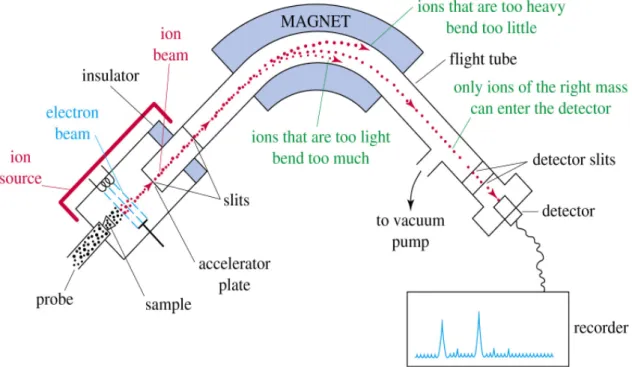
Schematic Illustration of an EI-Mass Spectrometer... 15
Schematic diagram of the planned information flow within system to develop... 24
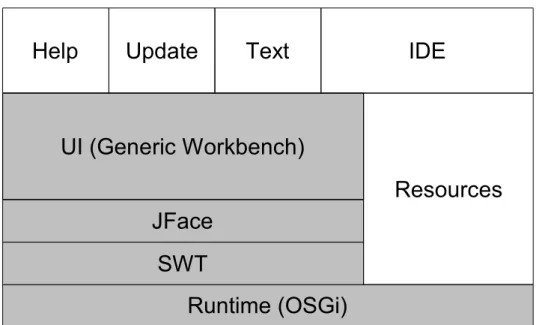
Schematic RCP diagram... 29
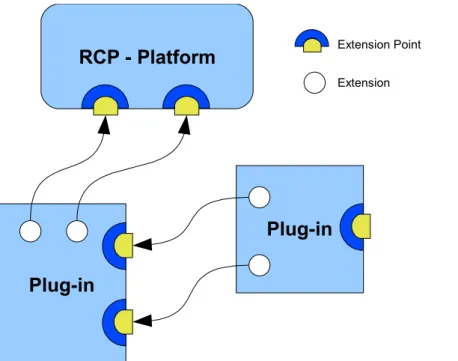
Eclipse plug-in connection via extension points... 31
Relation of SWT, JFace and Eclipse Workbench... 35
The Bioclipse plug-ins... 40
The Bioclipse object model... 42
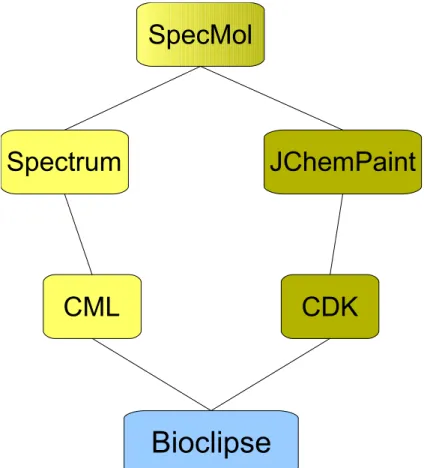
Connection of the cheminformatics modules... 47
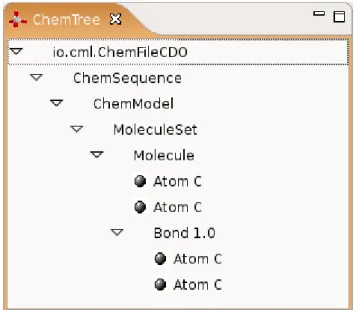
The ChemTree view... 50
Screenshot of the 2D-Structure view displaying 3 structures in a tabular way... 51
Screenshot of the general properties view extended with CDK specific properties...52
Wizards for the creation of new molecules... 53
Illustration showing the embedded JChemPaint editor... 55
An exemplary extract of the JCAMP-DX meta data dictionary...58
Section of a JCAMP-DX encoded peak spectrum. ... 60
Screenshot of the two pages forming the "new Spectrum" wizard... 62
The peak table view... 63
The continuous spectrum view visualising an IR spectrum of dodecyl-benzene... 64
The meta-data view... 65
The peak spectrum view displaying a mass spectrum of pyrrolidine... 65
Diagram showing the schema used for the generation of the meta data editor... 66
Screenshot of the dialog for adding meta data entries... 67
The "new SpecMolResource" wizard... 70
SpecMolResource and its child resources... 70
Class diagram illustrating the resource dependencies of the SpecMolResource...71
The assignment editor... 72
Concept of object-relational mapping... 75
A high level schema of the Hibernate architecture... 76
Schema displaying how extension-points are used to realise db connection via Hibernate..78
Exemplary Hibernate mapping file... 79
E/R diagram of the chemoinfomatics tables... 80
UML diagram of the DB related resources... 81
Diagram showing the traditional publishing process... 84
Diagram of a improved publishing process... 84
The XML family... 90
CML example section of arginine... 92
The CML components... 94
A typical analytical block as found in synthetic organic papers... 98
Depiction showing parts of a NMRShiftDB exported CML file... 100
Example spectra showing different peak shapes and coupling phenomena... 102
CMLSpect example encoding for a UV/Vis spectrum... 117
IR spectrum encoded in CMLSpect... 118
A CMLSpect encoded mass spectrum... 119
Exemplary section of the Schematron file defining the NMRShiftDB convention. ... 120
Exemplary sections of the JCAMP-DX mapping file... 121
Table of Contents
1 Introduction... 1
1.1 Systems Biology and Metabolomics... 6
1.2 Computer Assisted Structure Elucidation... 9
1.3 Spectroscopy and Spectroscopic Data Formats... 12
1.3.1 Spectroscopic Data Formats... 17
1.4 Open Data, Open Source, Open Standard... 19
1.4.1 Open Source... 19
1.4.2 Open Standard & Open Data... 20
1.5 Client-Server-Architecture... 21
1.5.1 Thin Clients... 21
1.5.2 Rich Clients... 22
2 Aim of the Project... 23
3 Eclipse & Eclipse Rich Client Platform... 27
3.1 Rich Client Platform... 28
3.1.1 Component Model... 30
3.1.2 Workspaces & Resources... 32
3.1.3 Workbench & UI Toolkits... 33
3.1.3.1 The Standard Widget Toolkit – SWT... 33
3.1.3.2 JFace... 34
3.1.3.3 Workbench... 35
3.1.3.4 Perspectives... 36
3.1.3.5 Editors & Views... 36
3.1.3.6 Wizards... 37
3.1.4 Platform Integration... 37
3.1.5 Help System... 38
3.1.6 Eclipse Summary... 38
4 The Bioclipse Framework... 39
5 Software and Methods Developed... 47
5.1 Structure Handling... 49
5.1.1 The CDK Plug-in... 49
5.1.2 Embedding JChemPaint... 54
5.2 Spectrum Handling... 57
5.2.1 The CML Plug-in... 57
5.2.2 The JCAMP-DX Format... 59
5.2.3 General Spectrum Support... 61
5.3 Assignment of Spectral and Structural Data... 69
5.4 Database Connection... 73
5.4.1 Database Systems & Object-Relational Mapping... 74
5.4.1.1 Relational Databases... 74
5.4.1.2 Object-Relational Mapping... 75
5.4.2 Implementation of Database Connections... 77
6 Semantics and Dictionaries for Metabolomics Data Representation... 83
6.1 The Extensible Markup Language (XML)... 87
6.2 The Chemical Markup Language (CML)... 92
6.3 The CMLSpect Vocabulary for Spectral Data... 97
7 Conclusions & Outlook... 105
8 References... 111
9 Appendix ... 117
1 Introduction
1 Introduction
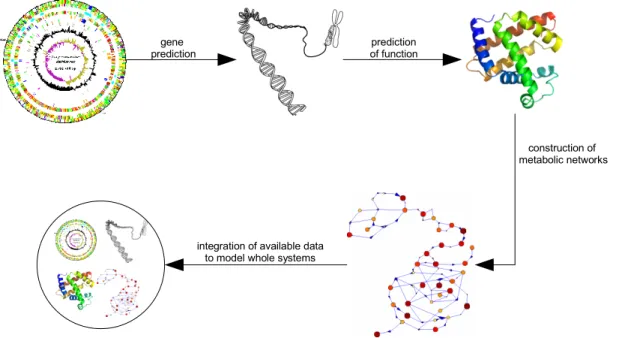
Systems biology aims at achieving a system level understanding of organisms and biological systems by integrating the data and information emerging from modern molecular biology. It uses data generated in e.g. Genomics, Proteomics and Metabolomics, to draw a complete picture of a system by analysing the interactions of the components and the resulting dynamics (see Chapter 1.1 for a more detailed introduction to systems biology).
These fields successively use the results of their predecessors to build new more complex perceptions with every step (shown in Figure 1). The identification of genomes enables the prediction of genes, leading to the possibility to predict their function. By integrating the function of a number of genes, it is possible to create pathways and connect them to metabolic networks. All this data is used in systems biology in an integrative way to model whole biological systems.
The most recent of the “omics” fields, Metabolomics, focusses on the identification and quantification of an organisms metabolites, enzymes and their interactions. With this information large metabolic networks can be constructed, enabling the identification of metabolites and enzymes, which are crucial for the survival of an organism (see Chapter 1.1
Figure 1: Diagram displaying the connection of the different “omics” fields and how the data generated by them is used by systems biology to understand complete organisms and systems.
gene
prediction prediction
of function
construction of metabolic networks
integration of available data to model whole systems
1 Introduction
page 7ff for more information on Metabolomics).
By abstracting these networks using graph theory, it is possible to determine parts of the network with special importance. Rahman et al. showed, that based on graph theoretical calculation of shortest path and connectivity information of metabolites, it is possible to identify the importance of single compounds. A “load point” in this model describes a highly connected hot spot in a metabolic network. “Choke points”, in contrast, are forming bottlenecks within the network, as they describe enzymes, that uniquely consume or produce a certain metabolite [1] (see Figure 2).
An inactivation of a “choke point” would result in the regarding metabolite not being consumed or produced any more. This is of major interest in drug development, as these points present potential drug targets. Additionally, a “choke point” analysis could help to identify potential adverse effects of a drug candidate by performing similarity or interaction analyses of the determined choke points and the drug candidate under analysis.
As metabolites are small organic molecules and their interactions are based on chemical reactions, chemical information is needed to understand the single steps within such a network. For that reason, small molecules and the knowledge about their structure, their properties and their interactions are of major importance for reproducing and understanding metabolic networks.
This importance of small molecules leads to an increased demand for experimental Figure 2: This depiction shows a section from a metabolic network represented
as a graph. The nodes are representing the metabolites, whereas the edges stand
for the enzymes and the reactions catalysed by them. The central grey coloured
node (6) is a choke point as well as the adjacent edges. (Image taken from [1]).
1 Introduction
information describing chemical compounds on a structural level. As the type of data used in this context (spectra, reactions, etc.) is generated on a daily basis in biological and chemical laboratories all over the world, one would expect a very solid knowledge base to be available to the scientific community. However, there exist several hurdles avoiding that this data is being re-used. These hurdles can be divided into three distinct classes:
• Publications: Information in science was traditionally published in printed media.
Even thought this process changed towards digital publication, the related data is in most cases not stored with or linked to the publication, the information is published without its semantic and ontological context and the information is very difficult to be searched and extracted.
• Storage: A good deal of the data generated in the daily work of scientists is not stored in structured and communally agreed databases at all, or at least not freely accessible for machine processing.
• Encoding: Another major issue within scientific information management is the encoding of the available data. There are many different, very often proprietary data formats used for storing and exchanging data. This leads to information loss on conversion and makes it very difficult to process the encoded data in an automated manner by computer software.
A potential information flow for analytical data in life sciences is shown in Figure 3. This data is typically processed with the help of machine vendor applications and therefore is normally digitally available, but most often not in a format allowing for easy interchange.
There is a strong need for communally agreed, openly specified and standardised data formats, enabling for easy processing, exchange and extension of the data. This would enable the data to be published and stored in some pool of freely accessible repositories.
These repositories do not need to be centralised and unified, but probably better form a pool of interconnected institutional and governmental storage systems. If data formats are agreed upon and scientific information is exchanged with its semantics, there is even software imaginable, that would help the scientist in validation and subsequent preparation of this data for the publication either in a scientific journal, a web page or anywhere else.
The current publication process of analytical data is erroneous, as the data itself normally is
just partly published in form of analytical blocks within chemical publications (see Figure
42 for an example). To access this data by software systems, it is at the moment necessary
1 Introduction
to perform chemical archaeology by trying to recover as much of the information as possible. Therefore, an additional software layer for retrieving the relevant data is needed.
This data might then form the basis for new experiments leading to new perceptions.
Figure 3: Schematic diagram showing a potential information flow within life sciences. Data is processed and validated by software systems, the extracted information is prepared for publication, whereas the data is being encoded and stored in data repositories. The direct linkage of the deposited data to the published information enables for computer based extraction of requested information and data.
An aly tical Po ol
Repository Pool
R1
R2
R3
R4
R5
Software:
●
p rocessing
●
validation
●
encoding
●
deposition
Pub licatio n
Software:
●
reading
●
extraction
●
retrieval
1 Introduction
Many of the tasks performed on chemical data are depending on large sets of data.
Databases are e.g. used to check if a molecule under examination is already known. If this is not the case retrieval of additional information about the molecule or similar ones can be helpful in elucidating its structure and learn about its properties. In biology there already exists a number of open and freely accessible databases (e.g. Protein Data Bank (PDB) [2], Kyoto Encyclopedia of Genes and Genomes (KEGG) [3], Universal Protein Resource (UniProt) [4]). In chemistry in contrast, even though it has a long history of compiling data and storing it in large collections of information, these are in most cases only accessible for paying customers.
Nevertheless, there is a growing number of approaches towards this ideal flow of information, as there are more and more repositories being set up and many journals start to give authors the possibility to publish their scientific results in an open accessible manner.
Furthermore, the first publishers start to enhance the traditional publication with data facts and semantics in machine processable formats [5].
Within this project, tools, algorithms, applications and data formats were developed, that support scientists in exchanging, processing, storing and searching molecular data under preservation of its semantics.
The other sections within this chapter give an introductory overview on general concepts
that form the basis for this work and identify the necessity and demand this work is
emerging from. The resulting overall objectives will be explained briefly in Chapter 2,
followed by a presentation of the software systems used as a basis for the developed
methods, algorithms and applications in Chapters 3 and 4. In Chapter 5 these applications,
algorithms and methods and their underlying concepts, that were used and developed within
this thesis, are described in detail. The last chapter is giving a condensed recapitulation of
the results of this work and gives an outlook on future and ongoing projects.
1 Introduction
1.1 Systems Biology and Metabolomics
Modern systems biology aims at understanding physiology and disease from the level of molecular pathways, regulatory networks, cells, tissues, organs and ultimately the whole organism. More generally it is described as aiming at the system-level understanding of biological systems as a whole [6] [7].
This is achieved by the accumulation, integration and analysis of complex data from multiple experimental and theoretical sources using tools developed in highly interdisciplinary environments [8]. These environments are built by scientist from very different fields of natural sciences (e.g. Molecular Biology, Proteomics, Genomics, Metabolomics, Informatics, Physics, Mathematics, Biochemistry and Chemistry), bringing in their knowledge and methods.
This challenging task was enabled by the strong progress in technical methodology and the large amount of new data associated with this. Important mile stones to be named here are the complete identification of the human genome [9] and the major improvements achieved in the field of high-throughput-methods.
In addition to the recently generated data, there is a large magnitude of relevant information
“hidden” in printed media like journal articles and books. To make this information accessible, techniques for information extraction and data mining are used and enhanced [10]. Furthermore, the data has to be encoded in standardised, robust and long lasting data formats. To ensure as well the high quality as the easy availability of all this data to the scientists, it has to be shared in online databases and/or open data repositories [11].
Focussing on the whole set of components and their interactions within a system is in contrast to the “traditional” way of hypothesis driven science. There, it is common to break down a problem into smaller units, to examine these units separately and afterwards try to generalise the obtained conclusions by recombining them. However, this procedure is contrary to the general assembly of complex systems.
A complex system is built by interacting parts, whose interactions lead to new properties
and functions. This formation of emergent properties causes an irreducibility of these
systems, as they could never be monitored looking at their subunits alone. Complex systems
are simulated on a hypothetical level by using modelling techniques from the field of
computer sciences and mathematics. These models allow scientists to accomplish two very
important tasks [10]:
1.1 Systems Biology and Metabolomics
• The prediction of a systems behaviour in reaction to any perturbation
• The redesign of a network to create new emergent system properties
For ensuring the lossless exchange of the so designed models and the related data, new formats are being developed that unify their expression (e.g. the Systems Biology Markup Language (SBML) [12]).
Thus, the scope of systems biology is ranging from data generation and integration, over computer based simulation of networks and systems, to experimental techniques like in- vivo modelling, by introducing perturbations into example organisms on different levels (genetic or environmental) [13].
A very large portion of the data used in system biology is derived from experiments within the so called “omics” fields, e.g. Genomics, Transcriptomics, Proteomics and Metabolomics. The tools developed within this work are mostly to be used for data handling of Metabolomics and other chemical data, but do not directly support data emerging from the other “omics” fields. Therefore, just Metabolomics will be described in detail in the following.
Metabolomics is the study of the whole metabolome of a biological system by identification and quantification of the contained metabolites and their relationships [14]. A metabolome is defined as being the “complement of metabolites of an organism” [15]. Metabolites are the intermediates and products of the metabolism, through which cells acquire energy and build cellular components.
Metabolic reactions can be divided into two different types [7]:
1. Catabolic reactions: gain of energy by breaking down complex compounds to smaller units
2. Anabolic reactions: consumption of energy for the construction of complex compounds
Metabolite examination is very commonly used in analytical biochemistry with a broad variety of methods applied for metabolite identification. The currently most frequently utilised procedures are [14][15]:
• The combination of a separation step (commonly gas or liquid chromatography)
with mass spectrometry
1 Introduction
• Analyses based on Nuclear Magnetic Resonance (NMR) spectroscopy
NMR spectroscopy has the advantage, that it is non destructive and therefore can better be used for the continuous measuring of metabolic profiles.
The analytical methods used to study the metabolome typically result in a large amount of high-dimensional data sets. For the interpretation of this data multivariate analysis methods like Principal Component Analysis (PCA), hierarchical clustering, evolutionary computing algorithms and other machine learning approaches are used [16].
One very common way of metabolite identification is the comparison of a pattern as unique as possible, describing the studied substance, with an existing library having reference patterns stored. This requires the existence of comprehensive and accessible data repositories with data stored in a standardised format. The qualitatively and sometimes even quantitatively determined data resulting from these interpretation steps is then used to infer biochemical networks or pathways. Beside the concentration of the molecules, their rates of change are of special interest for the modelling of metabolic networks.
Beside the academic interest of drawing a complete map of the constituents of a cell and their interactions, Metabolomics has an impact on a variety of applications, especially in medicine [16]. The investigation of the metabolome rises the probability of finding potential new drugs and/or new lead structures for drug development. By understanding metabolic pathways and networks the chance to intervene and to find ways to possibly increase or decrease the production rate of a certain metabolite grows. Metabolic profiles of a cell can be used for diagnosis of diseases, differentiation of healthy and diseased cells and can be used as quick tests for certain metabolic malfunctions [16][17].
Nobeli and Thornton highlighted in this context the importance of well organised and standardised public domain databases for the collection and retrieval of Metabolomics data and the development of open source software for data handling and data analysis especially in the field of chemoinformatics [16].
This is what the Bioclipse framework (see Chapter 4) is aimed at. It is providing supportive
tools and applications for the different fields of systems biology. The applications and
methods developed in this work are aimed at supporting scientists in the collection,
administration and analysis of experimental data. The main focus is on data derived by
metabolomic research whereas modules developed by other scientists cover the fields of
proteomics and genomics research.
1.2 Computer Assisted Structure Elucidation
1.2 Computer Assisted Structure Elucidation
As scientists in such diverse fields like biochemistry, biotechnology, molecular biology, pharmacology and chemistry are constantly synthesizing new compounds or have the necessity of identifying newly discovered substances, the characterisation and structural elucidation of these compounds is of major importance.
Modern experimental techniques are generating data on a much higher rate, than it can be interpreted even by experts. Therefore, methods were and still are developed, that make use of computers within the process of structure determination.
In this context, chemoinformatics has long been developing tools for the Computer Assisted Structure Elucidation (CASE) of these unknown compounds. At the moment this field experiences a renaissance due to increased computer power, decreased memory prices and the decreased execution time of wet-lab experiments [18][19].
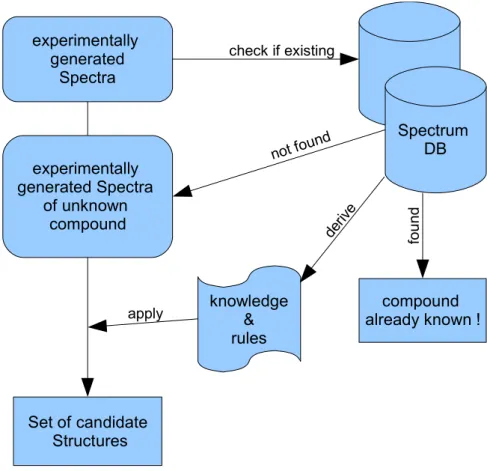
Figure 4: Schematic model of a dereplication process with attached Computer Assisted Structure Elucidation (CASE) steps.
experimentally generated
Spectra
Spectrum DB check if existing
knowledge
&
rules
Set of candidate Structures
apply experimentally generated Spectra
of unknown compound
compound already known ! not f ound
fo un d
de riv e
1 Introduction
CASE systems are typically knowledge and rule based systems, which derive structure information from spectroscopic data and use structure generators to build all possible isomers in agreement with the spectroscopic data (see Figure 4). Finally, these isomers will be verified by e.g. a comparison of predicted spectra with the original experimental data.
The better the coverage with spectroscopic data, the fewer solution structures are suggested by these systems.
There exist mainly two different approaches to solve the structure generation process:
deterministic and stochastic procedures. The deterministic methods try to generate all feasible structures, that match the input data. In contrast, the stochastic methods use algorithms and so called machine learning methods, that stochastically optimise the molecular structure towards agreement with given structural properties. Deterministic procedures are very often improved by the simulation of experts decisions and therefore are normally based on large knowledge bases. Furthermore, there exist hybrid approaches that combine these two procedures.
In order to derive rules or train machine learning methods, CASE systems often work on top of large databases of spectral data associated with structural features and physico-chemical properties of the molecule [20][21]. These databases are e.g. used for performing sub- spectrum and sub-structure searches to find good starting structures for the elucidation process. On the next level of this process, known correlations between spectra and structures are used to predict structural and/or spectral properties of compounds, that are not part of the database [22]. The last step in this process is the generation of fitting structures and the ranking of the so gained datasets [23][24][20].
Especially the different types of Nuclear Magnetic Resonance (NMR) spectroscopy (e.g.
13