Vibrational Spectroscopy for Fundamental Cell Behavior Analyses in a Wound Healing Model
Dissertation zur Erlangung des akademischen Grades des Doktors der Naturwissenschaften (Dr. rer. nat.)
eingereicht in der Fakultät für Chemie der Technischen Universität Dortmund
vorgelegt von
Melissa Mariani, MSc Immunology & Immunogenetics aus Amerika
Oktober 2009
Table of Contents
List of Abbreviations...v
Zusammenfassung und Ausblick...vii
Chapter 1: Introduction...1
Chapter 2: The Tissue Environment...6
2.1 Why Wound Healing?...7
2.2 Summary of Epidermal Wound Healing………7
2.3 Epidermal Environment.………9
2.4 Keratinocytes………...10
2.5 Extracellular Matrix (ECM)……….11
2.6 Conclusion………...11
Chapter 3: Vibrational Spectroscopic Theory & Bio-Medical Applications……...14
3.1 Why Vibrational Spectroscopy?...15
3.2 Raman Spectroscopy………16
3.2.1 Raman Scattering………..17
3.2.2 Raman Spectral Data……….21
3.2.3 Coupling Raman Spectroscopy with Microscopy……….22
3.2.4 Benefits of Raman Spectroscopy ……….24
3.3 IR Spectroscopy………...27
3.3.1 FT-IR Instrumentation………..29
3.3.2 Benefits of FT-IR………..31
3.4 Conclusion………...32
Chapter 4: Real-Time Reverse Transcriptase Quantitative Polymerase Chain Reaction (RT-qPCR) & Associated Benefits With Imaging Correlation…..…….…36
4.1 Analysis of Nucleic Acids………...37
4.2 Background………..37
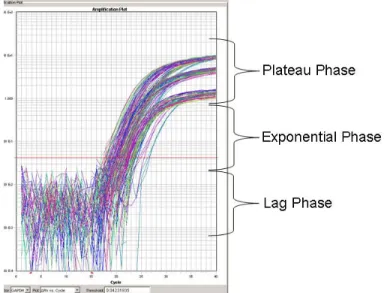
4.2.1 Data Processing……….41
4.2.2 Applications………..43
4.2.3 Correlation With Imaging………...………..44
4.3 Conclusion………...44
Chapter 5: Impact of Fixation On in vitro Cell Culture Lines Monitored With
Raman Spectroscopy...………...47
5.1 Introduction………...48
5.2 Methods………50
5.2.1 Cell Culture………...50
5.2.2 Cell Sample Preparation………...51
5.2.3 Raman Measurements………...51
5.2.4 Cell Staining………..51
5.2.5 Data Analysis………51
5.3 Results & Discussion………...52
5.3.1 Raman Spectra of HaCaT Monolayer Samples Using Varied Preservation Methods………..54
5.3.2 Raman Spectra of C.A. MM6 Monolayer Samples Using Varied Preservation Methods………..57
5.3.3 Effects of Sample Preparation Methods Between Cell Lineages……….59
5.4 Conclusion………...60
Chapter 6: FT-IR Mapping of Keratinocyte Organizational Profiles During in vitro Wound Healing………..………..………63
6.1 Introduction………..64
6.2 Methods………65
6.2.1 Cell Culture………...65
6.2.2 Time-Lapse Video………....65
6.2.3 Stimulated Wounding Sample Preparation………...66
6.2.4 FT-IR Mapping……….66
6.2.5 Spectral Data Analysis………..67
6.2.6 Gene Expression Quantification………...67
6.2.6.1 RNA Extraction……….67
6.2.6.2 cDNA Synthesis……….68
6.2.6.3 RT-qPCR………...68
6.2.7 Statistical Analysis………69
6.3 Results & Discussion………...70
6.3.1 Time 0………...70
6.3.2 4 Hours………..74
6.3.3 12 Hours………76
6.3.4 36 Hours………77
6.4 Conclusion………...78
Chapter 7: High Resolution Imaging & Gene Expression Profiling of ECM Localization & Lipid Profiles in Epidermal Keratinocytes During in vitro Wound Healing………...………...81
7.1 Introduction………..82
7.2 Methods………82
7.2.1 FT-IR Mapping……….82
7.2.2 Spectral Data Analysis………..83
7.2.3 Immunofluorescence……….83
7.3 Results & Discussion………...84
7.3.1 Protein/ ECM Distribution………86
7.3.2 Lipid Distribution………..90
7.3.3 RT-qPCR Analysis………...92
7.4 Conclusion………...94
Chapter 8: Lipid Distribution During Stimulated Re-Epithelialization Through Micro-Raman & Tip-Enhanced Raman Scattering (TERS)………….…….…...96
8.1 Introduction………..97
8.2 Methods………98
8.2.1 Micro-Raman Imaging………..98
8.2.2 Tip-Enhanced Raman Spectroscopy (TERS) Line Scans………...99
8.3 Results & Discussion………...99
8.3.1 Micro-Raman Imaging………..99
8.3.2 TERS Results………..102
8.4 Conclusion……….109
Chapter 9: Micro-Raman Detection of Nuclear Membrane Lipid Fluctuations in Senescent Epithelial Breast Cancer Cells...……….…………112
9.1 Introduction………113
9.2 Methods………..114
9.2.1 Cell Culture & Raman Sample Preparation………114
9.2.2 Micro-Raman Imaging………114
9.2.3 Data Analysis………..115
9.2.4 RT-qPCR………115
9.2.5 Statistical Analysis………..116
9.3 Results & Discussion……….116
9.4 Conclusion……….122
Chapter 10: Conclusion & Outlook...…...……..………..……...124
Appendix A……….129
1. Bio-Rad Automated Gel Electrophoresis……….130
2. Microarray Results………...132
3. Reference Gene Results………...135
Curriculum Vitae………...137
Danksagung/ Acknowledgements……….………...….139
List Of Abbreviations ATCB β-actin
BSA Bovine Serum Albumin C.A Classically Activated
DAPI 14’,6-diamidino-2-phenylindole FT-IR Fourier-Transform Infrared FN Fibronectin
HCA Hierarchical Cluster Analysis CAV1 Caveolin-1
CAV2 Caveolin-2
cDNA Complimentary Deoxynucleic Acid cm-1 Wavenumber
Ct Cycle Threshold
dNTPs Deoxyribonucleoside triphosphate dATP 2’-deoxyadenosine 5’-triphosphate dTTP deoxytimidine triphosphate
dGTP 2’-deoxyuanosine 5’-triphosphate dCTP deoxycytidine 5’-triphosphate DMEM Dulbecco’s Modified Eagle’s Medium DOX Doxycycline
ECM extracellular matrix EGF Epidermal Growth Factor FCS Fetal Calf Serum
FRET Fluorescence Resonance Energy Transfer GAPDH glyceraldehyde 3-phosphate dehydrogenase H&E Hematoxylin & Eosin
HMBS hydroxymethylbilane synthase IL-1b Interleukin-1b
IL-6 Interleukin-6 IL-8 Interleukin-8 ITGA2 Integrin-alpha 2 ITGA3 Integrin-alpha 3 KRT16 Keratin 16
LPS Lipopolysaccharide MMP Matrix Metalloproteinase mRNA Messanger Ribonucleic Acid NEAA Non-Essential Amino Acids
NFκB Nuclear-factor kappa B P/S Pennicillin/Streptomycin PBS Phosphate Buffered Saline PBST Phosphate Buffered Saline + Tween PCA Principle Component Analysis PCR Polymerase Chain Reaction
PPARβ/δ Proliferator-Activated Receptor Beta/Delta RT Reverse Transcription
RT-qPCR Reverse Transcription Quantitative Polymerase Chain Reaction SERS Surface-Enhanced Raman Spectroscopy
TBP TATA binding protein
TERS Tip-Enhanced Raman Spectroscopy TIMP Tissue Inhibitor Metalloproteinase TGF-β Transcription Growth Factor- beta
TNF-α Tumor Necrosis Factor- alpha UBC Ubiquitin C
UHCA Unsupervised Hierarchical Cluster Analysis
YWHAZ Tyrosine 3-monooxygenase/tryptophan 5-monooxygenase activation protein
Zusammenfassung und Ausblick
Spektroskopische Techniken sind seit langem etablierte Analysemethoden in der physikalischen Chemie und liefern eine vollständige chemische Zusammensetzung einer Probe durch markerfreie Analyse. Im Unterschied dazu werden in herkömmlichen Versuchsvorschriften in den Lebendwissenschaften Analysemethoden angewendet, die die Proben beeinflussen, wie z. B. das Markieren. Diese invasiven Schritte können durch eine Verknüpfung von spektroskopischen Techniken mit dem Bereich der Lebendwissenschaften erfolgreich umgangen werden.
Der Schwerpunkt in den Lebendwissenschaften wurde kürzlich auf Grund der Zunahme an Beliebtheit beider „omik“ Wissenschaften und Systembiologie umgelenkt, wobei die Aufmerksamkeit von einzelnen Komponenten zum Verständnis dieser Komponenten im Kontext des gesamten Systems überging. Hierbei ist die Erforschung einzelner Komponenten und das Verständnis ihrer komplexen Einbindung in biologische Systeme in den Brennpunkt gerückt. Da die Spektroskopie eine nichtinvasive, labelfreie Analysemethode bietet, wächst auch das Intersse, diese Verfahren zunehmend in der Grundlagenforschung der Lebendwissenschaften anzuwenden.
Gekoppelt mit den Fortschritten bei der multivariaten Datenanalyse besitzen die Anwendungen der Fourier Transform Infrarot (FT-IR) und Raman Spektroskopie einen besonderen Reiz, auf Grund ihrer Möglichkeit, lebende oder fixierte Proben mit einer lateralen Auflösung weniger Mikrometer bis in den Nanometerbereich zu untersuchen.
Allerdings muß für die Einbindung dieser spektroskopischen Techniken in die biologische Grundlagenforschung und biomedizinische Diagnostik ihre Zuverlässigkeit und Konsistenz durch Vergleiche mit den aktuellen Gold-Standard-Methoden bewiesen werden. Die empfindlichste Methode für die Detektion von mRNA ist derzeit die reverse Transkriptase PCR (RT-PCR), die auf Grund ihrer bewährten Beiträge in biologischen Studien und biomedizinischer Diagnostik genutzt wurde, um die Ergebnisse der spektroskopischen Analysen zu bestätigen und auch um die gesamte Interpretation der spektralen Daten zu unterstützen.
In dieser Arbeit wurden spektroskopische bildgebende Verfahren auf das gut verstandene Modell der epidermalen Wundheilung angewendet. Der hoch komplexe Vorgang der Re- Epithelisierung umfasst Signale der Zell-Zell- und Zell-Substrat-Kommunikation, die zu Zellpolarisierung, Migration und Organisation führen. Trotz der übereinstimmenden Meinung, dass diese morphologischen Veränderungen stattfinden, bleiben die genauen biophysikalischen Prozesse, die zu ihrer Entstehung und Aufrechterhaltung beitragen, kaum verstanden.
Zudem werden die Vorteile der Kombination von schwingungsspektroskopischer Bildgebung mit chemometrischer Datenanalyse und RT-qPCR deutlich ihre Stärken als kombinierte Methode für in vitro Zellstudien. Beginnend mit einer Abschätzung der Einflüsse einer Fixierung auf die spektroskopische Probenanalyse, bis hin zu komplexeren Aufgaben, wie z. B. die in vitro Untersuchung fundamentaler Zell-Zell- Mechanismen während der epidermalen Re-Epithelisierung, zeigten die Schwingungsspektroskopie und RT-qPCR großes Potential für Anwendungen in komplexeren in vitro Modellsystemen und für weitere Anwendungen in Bereichen der biomedizinischen Diagnostik, einschließlich Krebs-Metastase, Gewebezüchtung und Drogeneinwirkung.
Diese Arbeit hat erfolgreich die Vorteile dieses multidisziplinären Ansatzes gezeigt und bietet einen Ausblick auf weiterführende Studien über epidermale Wundheilung und Zell- Organisationsprofile. Darüber hinaus haben die Vorteile der Kombination von spektroskopischer Bildgebung mit RT-qPCR deutlich gezeigt, dass zusätzlich eine Quantifizierung erreicht werden kann, wie auch eine Bestätigung der Ergebnisse, wobei beides grundlegende Voraussetzungen für vertrauenswürdige biologische Studien und aktuelle biomedizinische Diagnostik sind.
Chapter 1
Introduction
Spectroscopic techniques have long been established methods of sample analysis in physical chemistry and provide the total chemical composition of a sample through label- free analysis. Traditionally, experimental protocols in the life sciences differ by often employing perturbing methodologies, like sample labeling, for analyses. By bridging spectroscopic techniques into the realm of life sciences, these invasive stages have been successfully circumvented.
Biological applications of vibrational spectroscopy commenced in the 1950s with the first reports on proteins and amino acids1. The first spectra of cells were reported in the early 1980s using resonance Raman spectroscopy to study antibiotic interactions with nucleic acids2. In 1991 the identification of whole-cells and bacterial strains was achieved with infrared (IR) spectroscopy3. The extent of data presented from these pioneering biological studies demanded the development of statistical techniques capable of extracting the desired information. Consequently, the development of multivariate analysis tools has facilitated exploring increasingly complex matrices, like whole tissue samples.
The focus of the life sciences has been redirected from a recent surge in the popularity of both ‘omics’ studies and systems biology, taking the focus off of individual components and shifting it toward understanding components within a system context. Studying individual components and understanding their complex association within biological systems has become the focal point. Functional and structural changes in these components, like surface proteins, during interactions and in varying cell states hold the answers to targets for diagnostic and preventative endeavors4. With spectroscopic studies providing a non-invasive, label-free method of analysis, interest in applying these applications to the increasingly fundamental studies of the life sciences has grown5.
Coupled with the advances in multivariate data analysis, Fourier transform infrared (FT- IR) and Raman spectroscopy are of particular appeal from their ability to assess live or preserved samples with lateral resolutions spanning a few microns down to the nanometer scale.
Likewise, as the medical and pharmaceutical industries continue toward an increasingly quantitative path, all techniques implemented for diagnostic use must be capable of providing some degree of quantification. FT-IR and Raman spectroscopy possess an intrinsic degree of quantitation along with multivariate data, compared with the traditional univariate data obtained from conventional imaging techniques. This is particularly of interest for the highly complex, heterogeneous samples often found in biological studies. However, for the incorporation of these spectroscopic techniques into fundamental biological studies and biomedical diagnostics, their reliability and consistency must be confirmed by means of comparison with current gold-standard techniques.
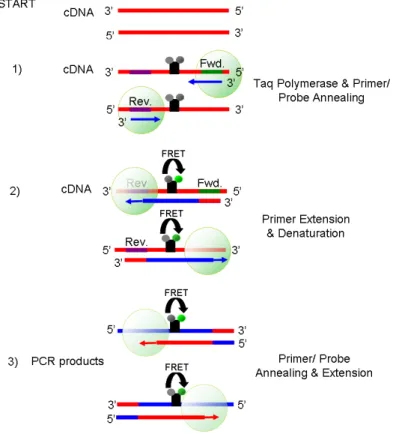
Real-time reverse transcription–quantitative polymerase chain reaction (RT–qPCR) is at present the most sensitive technique for messenger ribonucleic acid (mRNA) detection, providing robust PCR product measurements. Additionally, RT-qPCR is commonly applied to clinical diagnostics, making the technique an industry standard for RNA product detection and quantification6-8. An increase in RT-qPCR applications, combined with the growing importance of clinical diagnostics, has permitted both areas to develop in parallel. Reflecting these advancements, the value of RT-qPCR in quantitative clinical diagnostics has increased largely through the stochastic integration of fluorochromes that can be directly related to qualitative measurements9. From the established contribution of RT-qPCR in biological studies and biomedical diagnostics, this technique was used to both confirm spectroscopic analyses and contribute to overall spectral data interpretations.
This body of research applied spectroscopic imaging techniques to the well known model of epidermal wound healing. Wound healing and chronic wounds continue to represent a significant burden to both patients and health care systems, effecting millions of patients annually and leading to a financial set-back nearing $20 billion per fiscal year within the US alone10. To gain a better handle on wound treatments, a more developed understanding of the healing process is needed. The highly complex process of re- epithelialization alone incorporates numerous cues from cell-cell and cell-substrate
communication leading to cell polarization, migration and organization. Despite the consensus that these morphological occurrences take place, the precise biophysical processes that contribute to their onset and maintenance all remain poorly understood.
To apply spectroscopic studies to this in vitro model system, the understanding of sample preparation for subsequent analysis was critical. With this in mind, Chapter 5 describes the effects of sample preparation on Raman spectral analyses and suggests a method for standardization.
Following sample preparation, Chapters 6 through 9 display applications of spectroscopic techniques paired with RT-qPCR for use with the in vitro model system of epidermal wound healing. These imaging techniques provided phenotypical sample analyses, while RT-qPCR presented a snapshot of the genotype, enabling a ‘systems’ view of cell behavior. This multifaceted approach was found particularly advantageous for studying associated molecular cues during wound healing, including cell polarization, migration and organization.
This body of work culminates with the success of a multidisciplinary approach and provides an outlook for continued work on both epidermal wound healing, cell organizational profiles and applications of spectroscopic imaging with RT-qPCR for biological studies and biomedical diagnostics.
References
1. M. C. Tobin, Science, 1968, 161, 68-69.
2. M. Manfait, A. J. Alix, P. Jeannesson, J. C. Jardillier and T. Theophanides, Nucleic Acids Res, 1982, 10, 3803-3816.
3. D. Naumann, D. Helm and H. Labischinski, Nature, 1991, 351, 81-82.
4. R. J. Swain and M. M. Stevens, Biochem Soc Trans, 2007, 35, 544-549.
5. J. R. Baena and B. Lendl, Curr Opin Chem Biol, 2004, 8, 534-539.
6. S. A. Bustin, J Mol Endocrinol, 2000, 25, 169-193.
7. S. A. Bustin and T. Nolan, J Biomol Tech, 2004, 15, 155-166.
8. D. G. Ginzinger, Exp Hematol, 2002, 30, 503-512.
9. W. P. Halford, V. C. Falco, B. M. Gebhardt and D. J. Carr, Anal Biochem, 1999, 266, 181-191.
10. L. Branski, G. Gauglitz, D. Herndon and M. Jeschke, Burns, 2009, 35, 171-180.
Chapter 2
The Tissue Environment
2.1 Why Wound Healing?
While wound healing has been extensively studied, the localized and transient nature of migratory behavior makes elucidating precise cell-cell mechanisms involved in migration and the transport of intra-cellular components particularly difficult1, 2. As with many cell actions, cell migration involves a combination of localized cell-cell and cell-substrate interactions mediated by transient molecular signaling. With epidermal wound healing incorporating so many aspects of cell communication, it provides a well characterized model to explore the fundamental cell behavior and their interactions with their environment, leading to migration onset, termination and successive organizational profiles.
2.2 Summary of Epidermal Wound Healing
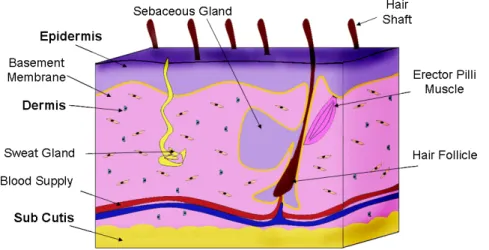
The skin is the largest organ of the body and is formed by multiple structural layers (Figure 2.1). In the event of wounding, the onset of healing processes are critical for upholding its function as an environmental barrier3. The biological process of wound healing is detailed, incorporating most aspects of the immune system for the regeneration of destroyed tissue with new, living tissue and requires three distinct stages for complete tissue regeneration (Figure 2.2)4.
Figure 2.1 Structural overview of tissue. An intricate and well-orchestrated interplay between cells of the 3 main layers (shown in bold) of skin occurs to maintain tissue homeostasis. The epidermal layer is the thinnest (0.1-0.2 mm thick)5 and provides the first layer of defense. The epidermis is attached to the dermis by the basement membrane, anchoring the 2 main layers together through its collagenous network. Hair follicle cells that aid in maintaining the epidermis reach this region from their dermal origin by diffusion through the dermal capillary network. Once keratinocytes from the dermis reach the epidermis, they differentiate upwards, forming the multiple layers among the epidermis (see Figure 2.3).
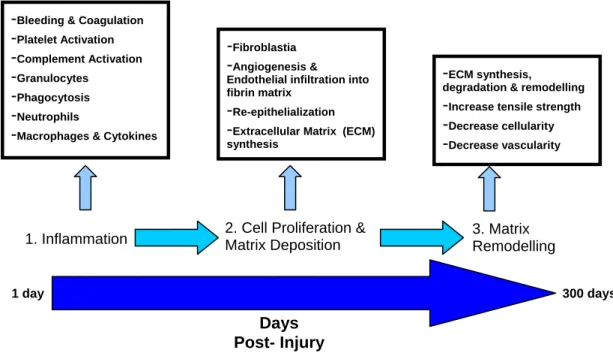
Figure 2.2 Summary of wound healing mechanisms. These detailed healing stages are implemented immediately following trauma to the skin and continue for days to years post-injury to reinstate tissue integrity.
The healing process commences with the formation of a fibrin clot at the wound site, closely followed by an inflammatory response to the skin trauma and concludes with cell proliferation and maturation6,7. Both innate and adaptive immune responses are called upon for the production of new tissue4. This includes complex reactions and interactions between cytokines, chemokines, growth factors and multiple cell lineages7.
Shortly following the inflammatory response, re-epithelialization combines a refined orchestration of several cellular processes, commencing with basal keratinocyte activation on the wound edge.
Keratinocytes dominate the epidermis and are present in differentiated forms throughout 5 layers (Figure 2.3). These epidermal layers work synergistically to provide the first line of defense from external threats like infection and maintain internal homeostasis. Not only do basal keratinocytes attach to the basement membrane, connecting the epidermis with the dermis; basal keratinocytes are also instrumental in regenerating damaged tissue in the event of wounding by reconstructing the damaged epidermis through proliferation and re-epithelialization. Phenotypic and genotypic modifications include the dynamic re-organization of inter-cellular components like actin microtubules and filaments, the expression and redistribution of integrin and cadherin adhesion complexes and the overall polarization of cells toward the gradient of attractants from the opposing wounded edge8, 9.
Days Post- Injury
1 day 300 days
1. Inflammation 2. Cell Proliferation &
Matrix Deposition
3. Matrix Remodelling
-Bleeding & Coagulation
-Platelet Activation
-Complement Activation
-Granulocytes
-Phagocytosis
-Neutrophils
-Macrophages & Cytokines
-Fibroblastia
-Angiogenesis &
Endothelial infiltration into fibrin matrix
-Re-epithelialization
-Extracellular Matrix (ECM) synthesis
-ECM synthesis,
degradation & remodelling
-Increase tensile strength
-Decrease cellularity
-Decrease vascularity
These amendments spatially regulate signal transduction pathways and provide traction for the protruding lamellipodia that emerge.
Once polarization has prepared cells for migration, gradients of diffusible factors and electrochemical signals assist in the generation and transmission of migratory forces to initiate and sustain migratory behavior8, 10-12. These necessary modifications, combined with the requirement for a scaffold to support migrating cells enables the onset of re-epithelialization, beginning within hours post- wounding13. Proximal cells are recruited to participate in migration by the amplification of chemotactic signals from activated cells on the wound edge, enhancing re-epithelialization14.
Migratory activity persists until cells from opposing wound edges come into contact, setting off
‘contact inhibition’15. Increased proliferation replenishes damaged and dead cells while aiding keratinocyte directional sensing and migration, although does not govern migratory activity16,17.
The final stages also include the reorganization of the ECM and contraction of the newly formed tissue. Contraction occurs as a result of fibroblast modulation into myofibroblasts, which contain α- smooth muscle actin to facilitate closing the wound space18,19. Upon completion of the healing process, a scar develops by the formation of healthy tissue sealing the injury site20.
2.3 Epidermal Environment
The epidermis is a hydrophobic 5-layer conglomerate of cells that provides the body with the first barrier from the environment. Epidermal layers include the stratified corneum, stratified granulosum and stratified spinosum layers and are composed primarily of keratinocytes (Figure 2.3).
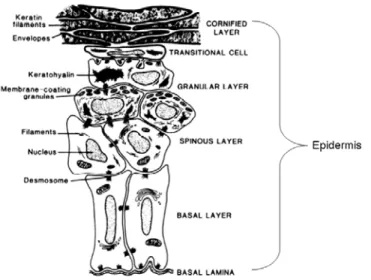
Figure 2.3 Morphological & structural changes in keratinocyte growth & differentiation3. Keratinocytes differentiate upward from the basal layer toward the cornified layer. As keratinocytes differentiate, their morphology changes drastically. Cells become smaller and more granular in the spinous and granular layer, while cells in the transitional and cornified layers possess no nuclei and predominately contain keratin filaments to provide a waterproof coating.
As cells develop in the stratified spinosum, they migrate up to the stratified corneum, forming between 20 to 30 layers of dead cells that are removed during desquamification. There are no blood vessels within the epidermis, forcing cell nourishment by blood capillary diffusion through the basement membrane, which provides an anchor between the epidermis and dermis.
2.4 Keratinocytes
As mentioned, keratinocytes are the prevailing cell type within the epidermis, originating in the basal layer from proximal stem cell differentiation and differentiate upward to form the epidermis3 (Figure 3). These cells were originally cultured in a lab just over 30 years ago21, 22 and lead to the production of small sheets of cells ranging from 2-3 layers thick23 and have been shown to migrate in response to stimulated wounding, making them an ideal model for re-epithelialization studies. Moreover, their cytokine profiles are largely unchanged from that of their in vivo environment during keratinocyte differentiation states24, 25.
2.5 Extracellular Matrix
The extracellular matrix (ECM) fills the intra-cellular space among keratinocyte sheets and includes multiple protein components. The scaffold that is formed by ECM proteins is vital for supporting cell motility and functionality, cell interactions and overall tissue structure. Important proteins for the
structure of the ECM include multiple types of collagen (predominately types I and III), fibronectin, hyaluronic acid and laminin. Additionally, various matrix metalloproteinases (MMP), like MMP9, can be found throughout the ECM and act as proteolytic enzymes that can degrade and rebuild the ECM during normal conditions and wound healing26, 27.
Through these various ECM components, a scaffold is formed to promote cell activity and instigating cell-cell interactions. Through the presence, maintenance or absence of a component, cellular interactions can be induced, modified or even completely inhibited28. Specifically through juxtacine signaling, cells can receive signals for proliferation, differentiation, and even a select form of programmed cell death that occurs once cells detach from their extracellular matrix scaffold, anoikis29.
2.6 Conclusion
The organizational profiles of keratinocyte during re-epithelialization and the associated mechanisms for proximal cell recruitment enabling mass migration remain poorly understood. Understanding cell interactions and their effects on cell migration and organization during re-epithelialization can provide insight into these caveats.
Imaging of fixed samples has been very useful in measuring cell movement and changes in cell phenotypes, particularly through increasingly widespread techniques like fluorescence resonance energy transfer and fluorescence recovery after photo-bleaching with confocal and total internal reflection microscopy30-34. Through genetic cell labeling, specific intra-cellular components have been visualized in a contextual setting, whilst protein labeling has been able to monitor cytoskeletal component turnover and post-translational mechanisms35,36. Fluorescent labeling of signaling components that direct cytoskeletal formations are also commonly used, as with phosphoinisitol-3 kinase labeling, and have been employed to track both conformational changes in components and changes in distribution37. However, all techniques implement invasive, costly and time-consuming methods and often render the samples useless for additional downstream analysis. It is from these setbacks that the benefits of spectroscopic analyses methods can be fully appreciated and will be further addressed in the forthcoming chapter.
References
1. M. Digmana, P. Wisemanb, C. Choic, A. Horwitzc and E. Grattona, PNAS, 2009, 106, 2170- 2175.
2. P. Girard, E. Cavalcanti-Adam, R. Kemkemer and J. Spatz, Soft Matter, 2007, 3, 307-326.
3. R. L. Eckert, Physiol Rev, 1989, 69, 1316-1346.
4. T. Watson, In Touch, 2003.
5. S. MacNeil, Nature, 2007, 445, 874-880.
6. A. K. Tsirogianni, N. M. Moutsopoulos and H. M. Moutsopoulos, Injury, 2006, 37 Suppl 1, S5-12.
7. G. Broughton, 2nd, J. E. Janis and C. E. Attinger, Plast Reconstr Surg, 2006, 117, 1e-S-32e-S.
8. L. Smilenov, A. Mikhailov, R. Pelham Jr., E. Marcantonio and G. Gundersen, Science, 1999, 282, 1172-1174.
9. A. R. Horwitz and J. T. Parsons, Science, 1999, 286, 1102-1103.
10. D. A. Lauffenburger and L. G. Griffith, Proc Natl Acad Sci U S A, 2001, 98, 4282-4284.
11. M. Vicente-Manzanares, C. Choi and A. Horwitz, J Cell Science, 2009, 122, 199-206.
12. C. E. Pullar and R. R. Isseroff, J Cell Sci, 2005, 118, 2023-2034.
13. H. Larjava, L. Koivisto and L. Hakkinen, Chapter 3: Keratinocyte Interactions with Fibronectin During Wound Healing, Tex Landes Bioscience, Inc, Austin, TX, 2002.
14. P. Kriebel, V. Barr, E. Rericha, G. Zhang and C. Parent, J Cell Science, 2008, 183, 949-961.
15. W. K. Nahm, B. D. Philpot, M. M. Adams, E. V. Badiavas, L. H. Zhou, J. Butmarc, M. F. Bear and V. Falanga, J Cell Physiol, 2004, 200, 309-317.
16. C. A. Parent and P. N. Devreotes, Science, 1999, 284, 765-770.
17. H. Tao, A. J. Berno, D. R. Cox and K. A. Frazer, PLoS ONE, 2007, 2, e697.
18. J. J. Tomasek, G. Gabbiani, B. Hinz, C. Chaponnier and R. A. Brown, Nat Rev Mol Cell Biol, 2002, 3, 349-363.
19. J. J. Tomasek, J. McRae, G. K. Owens and C. J. Haaksma, Am J Pathol, 2005, 166, 1343-1351.
20. A. Bayat, McGrouther, DA., Ferguson, MWJ, BMJ, 2003, 326, 88-92.
21. J. G. Rheinwald and H. Green, Nature, 1977, 265, 421-424.
22. J. G. Rheinwald and H. Green, Cell, 1975, 6, 331-343.
23. H. Green, O. Kehinde and J. Thomas, Proc Natl Acad Sci U S A, 1979, 76, 5665-5668.
24. J. Ansel, P. Perry, J. Brown, D. Damm, T. Phan, C. Hart, T. Luger and S. Hefeneider, The Journal of Investigative Dermatology, 1990, 94, 101S-107S.
25. A. Grone, Veterinary Immunology and Immunopathology, 2002, 88, 1-12.
26. J. M. Lamar, V. Iyer and C. M. DiPersio, J Invest Dermatol, 2008, 128, 575-586.
27. T. Salo, M. Makela, M. Kylmaniemi, H. Autio-Harmainen and H. Larjava, Laboratory Investigation; A Journal of Technical Methods & Pathology, 1994, 70, 176-182.
28. E. O'Toole, Clin. Exp. Derm, 2008, 26, 525-530.
29. S. M. Frisch and R. A. Screaton, Curr Opin Cell Biol, 2001, 13, 555-562.
30. M. E. Huot, C. M. Brown, N. Lamarche-Vane and S. Richard, Mol Cell Biol, 2009, 29, 1933- 1943.
31. J. Morgan, R. Huckfeldt and R. O. Wong, Exp Eye Res, 2005, 80, 297-306.
32. Y. Sako and T. Uyemura, Cell Struct Funct, 2002, 27, 357-365.
33. L. Soon, F. Braet and J. Condeelis, Microsc Res Tech, 2007, 70, 252-257.
34. M. Parsons, B. Vojnovic and S. Ameer-Beg, Biochem Soc Trans, 2004, 32, 431-433.
35. B. N. Giepmans, S. R. Adams, M. H. Ellisman and R. Y. Tsien, Science, 2006, 312, 217-224.
36. D. M. Chudakov, S. Lukyanov and K. A. Lukyanov, Trends in Biotechnology, 2005, 23, 605- 613.
37. A. J. Ridley, M. A. Schwartz, K. Burridge, R. A. Firtel, M. H. Ginsberg, G. Borisy, J. T.
Parsons and A. R. Horwitz, Science, 2003, 302, 1704-1709.
Chapter 3
Vibrational Spectroscopic Theory & Bio-Medical Applications
3.1 Why Vibrational Spectroscopy?
With the cause of many diseases still largely unknown, many empirical treatments are used to improve patients’ quality of life. However, as with most empirical treatments, patient immunity can develop rendering it useless, treatments are not sufficiently aggressive or produce unwanted side-effects. This harbors a significant burden on the patient, both financially and emotionally. The medical industry is also affected by this burden from not only repeated patient-clinic visits, but also from patient complaints, which in extreme cases could lead to legal action, and a subsequent toll on practice resources.
With this in mind, it is not surprising that the demands on research and technical capabilities have been faced with increasing pressure. This pressure is projected into the various realms contributing to personalized clinical diagnostics, treatment and prevention. More specifically, researchers are being demanded to identify analyte targets more swiftly and quantitatively. In turn, diagnostics are increasingly required to provide higher throughput and enhanced diagnostic capabilities (cheaper, more precise and reliable) aiming to better understanding fundamental cell behavior. This insight can be applied to develop increasingly personalized medicine while also enabling pharmaceuticals to develop and test promising treatments more succinctly.
Given the current demands, an insurgence toward techniques capable of molecular- specific analyses on whole biological processes has developed. Imaging techniques have displayed particular promise from their ability to provide molecule-level analysis in the context of a tissue-size scale while providing a degree of quantification. Moreover, imaging techniques lend themselves nicely to personalized medicine, enabling more precise diagnosis and subsequent treatment. However, most current imaging techniques require elaborate sample preparation, the use of exogenous labels and provide poorly quantifiable results. Associated labeling techniques also require cumbersome protocols, making them often more costly and can result in non-specific sample binding, increasing the likelihood of false-positives. With this in mind, novel techniques circumventing these set-backs, like micro-Raman spectroscopy and FT-IR, are in great demand.
3.2 Raman Spectroscopy
Raman scattering was first discovered in 19281, where it was described as the ‘molecular diffraction of light’. This form of photon scattering was found to differ in energy and signal intensity from Rayleigh scattering, with Raman scattering occurring in only every 1 in 106 – 108 photons. Without delay, Raman spectroscopy found a position in the chemical and materials analysis field, studying mixtures, pure substances, identifying compositions and characterizing chemical structures. As little to no sample preparation is required, samples could be non-invasively studied, lending the technique to a wide variety of applications.
It was not until the advent of the laser in the 1960’s that Raman spectroscopy was capable of providing constant and intense light for sample excitation under reproducible conditions. Following this development, detection electronics also became considerably more efficient and hence compatible with smaller sample volumes. From the wealth of multivariate information in a single Raman spectrum and the ability to better assess small sample components non-invasively and non-destructively, exploratory applications involving biological matter were initiated. As biological endeavors grew in prevalence, tailored instrumentation, laser wavelengths and sample preparation became the focus of scrutiny.
Although reproducible conditions could now be achieved, biological samples possessed their own related drawbacks. These samples are often present in limited quantities, possess heterogeneous composition and compartmentalized targets, require microscopy, and produce high auto-fluorescence. This results in complex spectra and often difficult spectral deconvolution. These areas of concern have been addressed through the enhancement of associated instrumentation and also novel techniques for spectral evaluation like multivariate data analysis, better suiting studies of this nature and aiding the development of the micro-Raman spectroscopy widely used today
3.2.1 Raman Scattering
In context to the generally better known absorption spectroscopies, the excitation of energy levels in Raman proceeds via a ‘detour’. In microwave, infrared or uv/vis absorption spectroscopy, the intensity loss at specific wavelengths is detected. This photon absorption happens when the energy difference between two levels matches a wavelength of the source. This is valid for all levels namely rotational, vibrational and electronic levels and is illustrated in Figure 3.1 for a vibrational level that corresponds to an infrared absorption. In the same figure the quantum state picture of Raman spectroscopy for the same vibrational levels is shown.
Figure 3.1 Induced excitation states of molecules via Stokes, Rayleigh or Anti-Stokes excitation patterns. Following laser excitation, molecules are excited to short-lived virtual states and return to their ground state by photon emission. Emitted photons can be of higher energy than incidence light (Anti-Stokes) or of lower energy than incidence light (Stokes) or of equal energy (Rayleigh scattering). In the case of absorption spectroscopies, incident energy is compared with the transmitted energy, indicating the amount of energy absorbed at a certain wavelength.
In contrast to absorption spectroscopy, where either a broadband excitation is used or the wavelength is scanned over the entire range of interest, for Raman spectroscopy a monochromatic light source is required. If this monochromatic source is far from a resonance, most of the photons will not interact with the sample, which is generally the case for transparent media. Nevertheless, a few photons excite the molecule in a so-called virtual level. From that level, most photons are simply reemitted at the same wavelength giving rise to elastic or Rayleigh scattering, a radiation that can also be detected orthogonal to the excitation direction. Even fewer photons are reemitted at wavelengths shifted in energy with respect to the excitation. The amount of the difference in energy is exactly the difference between the initial state and the final energy level of the molecule and is called Raman scattering. Most often, this is used for vibrational spectroscopy, but
νexc.
ν Stokes
ν exc.
ν Rayleigh
Vibrational Ground State
Virtual levels
Δν vib Energy
ν Anti-Stokes
ν exc.
the same arguments hold for rotational or electronic energy levels as specific selections rules must be considered as well.
The quantum mechanic level description is straight forward for visualizing the involved energy levels. Classic theory can also be used to understand the processes and the molecule properties that influence the intensity of Raman lines. Firstly, the incoming electromagnetic field (E) acting on a target molecule must be characterized for a specific time by a frequency (ω0) and amplitude (Ε0):
1
Any electromagnetic field (E) consequently induces an electrical dipole (µ) (2), where α refers to the polarisability of the molecule.
2
If the oscillation of an electromagnetic field (1) is combined with the induction of a dipole (2), the dipole then oscillates with respect to the field (3).
3
On top of the oscillating induced dipole, the molecule also vibrates either in its ground state or also higher excited states. A vibrating molecule can be expressed as:
4
ωR is the resonance frequency of the vibrating molecule, where q0 is the normal coordinate. In turn, the polarisability can now be expanded around q=0 using a Taylor expansion:
5
This expression for the polarisability can now be inserted into formula (3) for the dipole oscillation, as follows:
6
Expanding the term above, it can be rewritten as:
7
In this formula, the first term corresponds to elastic scattering as it is not influenced by the vibration of the molecule, the second and third terms refer to inelastic scattering. In particular, the second term refers to the red shifted stokes Raman scattering and the third term to the blue shifted anti-stokes Raman scattering. Hence, formula (7) readily explains the distinct Raman band positions of individual molecules.
The intensity of molecular polarisability can also be classically obtained using the emitted power of a hertzian dipole since it is also valid for induced dipoles (8).
8
The induced dipole (2) can be combined with the above formula to obtain the intensity of molecular polarizability and is displayed as follows:
9
For the Stokes portion of Raman scatting, ω = ω0 - ωR must be inserted to describe the induced oscillating dipole and the squared field is equal to the intensity, hence:
10
For the classical calculation of scattering intensities, α must be replaced with δα / δq .
11
From formula (11), it can be noticed that apart from molecular properties influencing the polarisability of the molecule, the Raman intensity depends directly on the intensity of the excitation source and on the fourth power of the excitation frequency. The latter dependency has practical aspects as a change in excitation wavelength from eg. 800 nm to 400 nm is accompanied by a 16-fold increase in scattering intensity. Practically, this can be difficult to directly monitor as spectral dependencies of instrumentation can influence the observed scattering. Other aspects like electronic resonances must also be considered before merely blue-shifting the Raman excitation to increase the intensity.
3.2.2 Raman Spectral Data
Since the difference in energy between incident and excited photons corresponds to a transition in molecule state, energy levels and resulting Raman spectra are unique for each molecule2. Even though Raman scattering produces a fairly weak overall signal, signal intensity depends on bond strength as well as quantity present. Raman spectra are then displayed as scattered intensity for the y-axis versus the relative shift in energy in wavenumber (cm-1) for the x-axis. This representation is independent of the actual excitation wavelength used to excite the molecules and represents the differences in eigenstates of the absolute energy states of a molecule3.
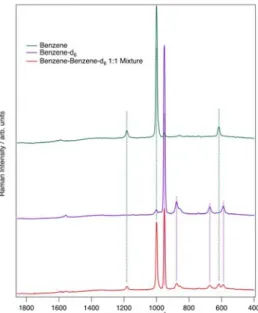
Here, the vibrational Raman spectra of benzene, deuterated benzene and a mixture of both are shown (Figure 3.2). This example visualizes not only the effect of isotopic labeling, but also how an assignment of different compounds can be made simply by a comparison of known spectra.
Figure 3.2 Raman spectra of benzene, deuterated benzene and a mixture of both substances.
Even though Raman scattering produces a fairly weak overall signal, signal intensity depends on bond strength as well as mass. In the case of benzene, shown in Figure 3.2, the intense band around 1003 cm-1 is attributed to ring breathing, whereas the smaller features at 606 cm-1 and 1178 cm-1 result from CH- bending vibrations4. For deuterated
benzene, these features are all present with an isotopic shift. The most intense band at 1003 cm-1 can be seen at the lower wavenumber 997 cm-1 and results from the mass difference of H vs D. The smaller features can also be seen to have shifted to lower wavenumbers in the deuterated benzene sample due to the same reasons. When solutions are combined, features from both benzene and deuterated benzene samples can be clearly identified, illustrating the importance of proper referencing.
3.2.3 Coupling Raman Spectroscopy with Microscopy
The microscope has long been an ideal platform for sample analysis, allowing the region of interest to be targeted. The incorporation of confocal microscopy with Raman spectroscopy revolutionized the scope of adaptations and in 1990 was first applied to study single cells and chromosomes5. This pairing simplified biological studies and enabled a 3-dimensional image translation and magnification of the sample relative to the microscope objective. Moreover, the confocal pinhole inflicts a geometry that ensures only select photons are collected from the back-scatter, reaching the detector. This precision enhances the ability to quantify spectra by providing spatio-temporal information of their origin, useful in identifying and quantifying specific localities.
By guiding a laser through an objective lens, a near-diffraction limited spatial resolution and increased collection efficacy can be achieved6. The laser beam can be made much tighter, increasing the intensity per area and can provide a spatial resolution below 1 µm, enabling biologically important structures including individual nuclei, mitochondria, cilia and regions of cell-interaction to be analyzed7-10. The minimally invasive micro-Raman process maintains sample integrity and direct sampling in either air or aqueous environments can be carried out maintaining viability. Raman micro-spectroscopy can also provide confocal resolution with appropriate wavelength selection, permitting measurements on different planes below the sample from a reduced absorption of the laser by the sample11.
Figure 3.4 Instrumentation for a Micro-Raman Spectroscopy set-up to conduct sample imaging. The collimated laser light is directed through a band pass filter with appropriate wavelength selection and is focused through a microscope objective onto the sample. The backscattered light is collected through the objective and after filtering with a Notch filter to reject elastically scattered signal, the light is transmitted through the confocal pinhole into the spectrometer. The signal is then directed onto a grating which disperses the light and eventually guided onto the detector to collect the Raman spectrum.
Most micro-Raman spectroscopic measurements implement a confocal setup, exciting and collecting the backscatter from the same location using the 180˚ collection geometry (Figure 3.4). High numerical apertures provide increased Raman performance but can be hindered by spherical aberrations6.
The innovation of micro-Raman spectroscopy has enabled the collection of detailed information pertaining to analyte molecular structure and composition on multiple focal planes. Micro-Raman spectroscopy continues to be a growing area of research, providing a spatial resolution surpassing that of IR spectroscopy and providing quantitative chemical insight. Its versatility can be best observed by the broad range of applications like the characterization of molecular structure in biological samples (e.g. cells, tissues) and distinguishing differences between cells as a result of growth cycles, physiological behavior or even physiological states (e.g. activation states)12.
Through technological advancements, fully automated xy maps and line scans can now be collected of selected sample areas, upholding the spatial resolution of the analyte requisite for both single cell and full tissue analysis. A sampling region is broken into a series of pixels that are color coordinated based on the height of a chosen peak area (Figure 3.5).
A. B. C.
Figure 3.5 Micro-Raman imaging of a single MCF-7 cell and subsequent quantitative analysis13. An image is mapped by an automated stage and computer system duo. Each pixel can possess an individual spectrum and the total mapped spectra are compared by the signal intensity of a selected band. Intensities are assigned a color in relation to intensity (blue = high intensity, red = low intensity) and the image is converted into a spectral map. A & B) Visible image of an MCF-7 cell and chemical imaging specific for the intensity of CH- stretching throughout the cell (80 x 80 pixels and a 0.5µm spot size). C) Hierarchical clustering of the spectral image specific for the
‘fingerprint region’ (1800-675cm-1) displays the localities of sub-cellular components.
Spectroscopic imaging of cells is still a new and exciting area of research, although shows great promise to provide novel ways of interpreting samples. As a result, both micro-Raman spectroscopy and micro-Raman imaging possess great potential for use in diverse applications.
3.2.4 Benefits of Raman Spectroscopy
Interest in Raman spectroscopy has grown considerably over the past 20 years. Attractive features include its non-invasive and non-destructive nature, in addition to no sample dilutions or extensive preparation necessary (Table 3.1). Raman spectroscopy also provides multivariate sample analysis, ideal for complex biological systems. Combined, these advantages illustrate the high sensitivity of Raman spectroscopy and its likelihood to accommodate a range of sample types and their respective industries.
Foremost, the good spatial resolution employed by Raman spectroscopy (1-100 µm) permits studying individual species and their structures in complex samples. This is an attribute specifically advantageous for single cell and imaging studies, something more difficult with related techniques like IR.
Advantages also include the ability to work using aqueous solutions in conventional glassware and the opportunity to monitor reactions, particularly when stretching vibrations are involved. For pharmaceutical studies on drug activity, this is tremendously beneficial. Final product conformations can also be maintained and their activity can be studied in their natural environment, shedding light onto in vivo compound reactions.
Moreover, as most drug active molecules contain a degree of un-saturation, producing a strong signal in the Raman ‘fingerprint region’ between 400- 2000 cm-1, detecting symmetrical stretching provides a significant advantage over IR spectroscopy.
Imaging Techniques
Spatial Resolution
Sample Preparation
Molecular Probe Use
Visualized Target
Information Obtained
Acquisition Time
Cell to Result Time
Quantification Ref.
Micro-Raman Spectroscopy
Approx. 500
nm Not required N/A
Proteins, RNA/DNA,
lipids, carbohydrates
Chemical composition
Milli- Seconds-
Hours;
dependent on sample size
Min. –
Hours Absolute & Relative 2, 14
Fluorescent In-Situ
Hybridization N/A
Chemical &
formalin fixation, labeling
DNA primers conjugated
to a fluorophore
DNA & RNA sequences, chromosomes
Gene sequence
presence Min. – Hours Min. –
Hours Absolute & Relative 14
Immunohistochemistry N/A
Formalin fixation, labeling
Antibodies for cell labeling
Cell constituent localization
Proteins Min.- Hours Min. –
Hours Relative
15
Atomic Force Microscopy
Atomic resolution
Intermolecular forces &
sample immobilization
N/A
Sample Mapping, including whole cell
surface &
individual components
Topographical
& nm scale structural information
Min. Min. N/A 16
Electron Microscopy Approx. 5 nm
Cryo or chemical fixation, gold
sputtering, dehydration,
sectioning
N/A Proteins &
Cells
Protein Structure, Cell conformations
Seconds Min.-
Hours Relative 17
Multi-Photon
Microscopy 15-1000 nm
Chemical fixation, sectioning
Rhodamine amide, quantum
dots, fluorescent
proteins, dyes
Visualization of cell structures
Structural &
topographical information
Seconds Min.-
Hours Relative 18, 19
Tip- Enhanced Raman
Spectroscopy 5-50 nm Tip preparation N/A
Proteins, RNA/DNA,
lipids, carbohydrates
Chemical composition
Seconds- Min.;
dependent on sample and
tip
Min.-
Hours Relative
20, 21
Secondary Ion Mass
Spectrometry - SIMS 50 nm
Cryopreservatio
n N/A
Whole cells, intracellular structures
Molecular &/or elemental composition of
the sample
Seconds- Min.
Min.-
Hours Absolute & Relative 22, 23
Maldi-Imaging
Down to 500 nm
Sectioning &
MALDI-matrix application
N/A
proteins, peptides, metabolites,
biomarkers
Drug development,
biomarker characterization,
Min.-Hours Min.-
Hours Relative 24-26
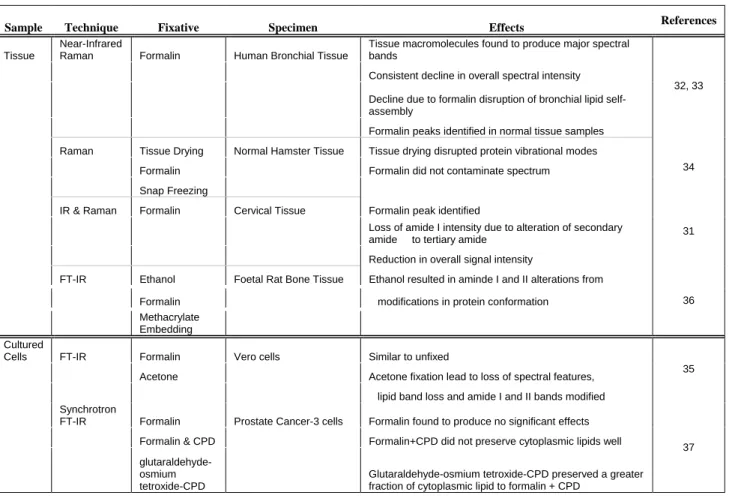
Table 3.1 Imaging techniques and their quantification capabilities. Micro-Raman spectroscopy, FISH, FT-IR, Immunohistochemistry, AFM, Electron Microscopy, Multi- Photon Microscopy, SIMS and Maldi-Imaging are all prevalent imaging techniques, whilst TERS and CARS are novel spectroscopic additions to these imaging techniques.
3.3 IR Spectroscopy
Although the advantages of Raman spectroscopy have been clearly elucidated in the previous section, the application of Raman’s sister technique IR spectroscopy can be better suited to larger samples. IR spectroscopy is known as the sister technique to micro- Raman from its ability to provide corresponding spectral data by following a different series of selection rules. The infrared region of the electromagnetic spectrum includes 3 regions: the near-, mid- and far- infrared regions based on their proximity to visible light.
Conventional IR spectroscopy typically applies mid- infrared light (4000-400 cm-1) and is useful in studying fundamental vibrations and structural composition.
While Raman spectroscopy is based on light scattering from molecules, IR spectroscopy is based on absorption and molecular dipoles. When infrared radiation interacts with different forms of matter, the radiation is absorbed when it matches a specific energy transition. This incident radiation that is absorbed by the matter results in fewer photons being transmitted. These transmitted photons are sent to a detector for spectral development and subsequent analysis.
As stated, IR radiation must match a specific molecular vibration for an absorption process, exploiting the many modes that molecules can rotate. Energy levels are related to the common wavenumber scale, with higher ‘wavenumbers’ (cm-1) equating to higher energy levels. The overall absorption frequencies are determined by the molecular potential energy surface shape, the associated vibronic coupling and the atomic mass. As molecules have N atoms, allowing in general 3N degrees of freedom. The vibrational modes of molecules account for 3N-6 degrees of freedom (except for linear molecules with 3N-5), displaying the number of ways the atoms in a molecule can vibrate27. All molecules show typical vibrational modes, making the IR spectrum specific to the molecule, as with Raman spectroscopy. For a molecule to be IR-active, a change in its permanent dipole must occur.
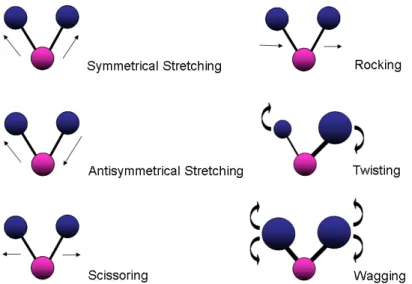
For more complex samples like cells, many bonds will absorb the IR radiation, enabling multiple vibrations to occur related to their respective chemical groups27. An example of such an occurrence can be seen when looking at the types of vibrations from a common group, like methylene (CH2). As the H- atoms are bound on either side of the C-, six different frequencies can occur following absorption of IR radiation. These include symmetrical and anti-symmetrical stretching, wagging, rocking, twisting and molecular scissoring (Figure 3.6).
Figure 3.6 The six different types of vibrational modes of CH2 that are detected in an IR spectrum. A common example of such vibrations can be noticed with CH2 group vibrations, as they are commonly found in many organic compounds like lipids, and undergo all six of these different vibrations.
These individual frequencies possess characteristic IR absorbance frequencies and are visualized through plotting all of the absorbance frequencies. The resulting ‘spectrum’
can be displayed in either ‘ % Transmission’ (%T) or ‘Absorbance’ (A) mode. A %T spectrum displays where the IR radiation was transmitted, meaning where there was no absorbance and the radiation was 100% transmitted through the sample. On the other hand, an A spectrum displays the same chemical information but is based on where the radiation was absorbed and how much, depending on the intensity of the dipole change (Figure 3.7).
A.
90 80 70 Transmission (%) 60
4000 3500 3000 2500 2000 1500 1000
Wavenumber (cm-1) B.
0.5 0.4 0.3 0.2 0.1
Absorbance (a.u.)
4000 3500 3000 2500 2000 1500 1000 Wavenumber (cm-1)
Figure 3.7 (A) An example of a cell spectrum in % Transmission (T%), while (B) displays an example of a cell spectrum in Absorbance. The y-axis units are different based on what the spectral plot is displaying. For spectra in T%, the y-axis reaches 100%
for complete absorption of the IR radiation, while for Absorption spectra, the y-axis represents the amount of IR radiation absorbed at each wavenumber.
Molecules that do not have a change in dipole moment are termed infrared inactive. In the case of a CO2, its symmetric stretching mode does not undergo a change in the dipole moment, making it IR-inactive (the vibration is still Raman active). Meanwhile, the asymmetric stretch of CO2 does undergo a change in dipole moment, thus enabling it to absorb IR radiation and produce an IR-active spectrum. Another IR-inactive molecule is the diatomic molecule N2, from its lack of dipole moment and how, even when stretching, a dipole moment is not produced.
3.3.1 FT-IR Instrumentation
The most commonly applied method of IR spectroscopy is Fourier-Transform IR (FT-IR) from its ability to measure all the IR frequencies simultaneously by using an interferometer to collect an interferogram of the sample signal and digitize the signals for downstream use. Standard FT-IR instrumentation begins with an interferometer. This interferometer prepares the IR radiation source for sample analysis. The most prevalent type of interferometer is the Michelson interferometer configuration. These interferometer configurations only differ by incorporating a movable mirror in the place of one of the stationary mirrors in the Michelson configuration (Figure 3.8).
Figure 3.8 Instrumentation for a FT-IR set-up to conduct sample imaging. The IR source is sent through a half-silvered mirror in the interferometer, allowing half of the beam to be reflected off of a stationary mirror while the other beam half reflects off of a moving mirror to introduce a time delay. Both beams rejoin and are reflected through an objective and onto the sample for absorption. The resulting IR beam that results following sample absorption is then transmitted through a slit into the monochromator to ensure other wavelengths are not present and is reflected onto a grating to disperse the beam into its respective wavelengths which continue on to the detector for spectral compilation.
To begin with, an IR radiation source is channeled through a beam-splitting mirror that is half reflective and half transmissive (half-silvered), splitting the beam into two parts. One half will be reflected at a 90˚ angle and the other will continue through the mirror until it reaches an oscillating mirror. This moving mirror will completely reflect the IR beam 180˚, introducing a time delay in the beam, and it will continue until it reaches the beam- splitter, where it interferes with the beam reflected from the stationary mirror and is then reflected towards the sample. The other half of the incident IR radiation beam was reflected to a stationary mirror, where it will also be reflected 180˚. Both beams will rejoin past the beam-splitter, referred to as the transmitted beam, and will continue through to the sample. The induced time delay in the temporal coherence of one of the beams is used to measure the time delay at each setting, allowing the time variable to become a spatial coordinate for subsequent FT by the following formula (12) into a spectrum.
dv e
v I t
S ∫−∞∞ iv t
= ( )
− 2π)
(
12The above formula compiles all the contributing frequencies from the molecular vibrations to provide a signal S(t) in the form of time. Continuing this, a subsequent formula can be used to provide a non-zero value in the case of S(t) containing a variable that is equivalent to the oscillating function, as shown in formula (13), while remembering formula (14).
dt e
t S v
I ( ) = 2 Re ∫
−∞∞( )
2iπvt 13χ χ sin cos i
e ix = +
14Following sample analysis, the varying percent of the beam transmitted is sent into a detector for subsequent plotting and digitization. The signal variations with respect to the moveable mirror are detected producing an ‘amplitude vs. length’ plot that can undergo a FT for deconvolution of the amplitude waves, producing an ‘intensity vs. cm-1’ plot.
3.3.2 Benefits of FT-IR
One of the most prevailing advantages of FT-IR is its quantitative capability. Although micro-Raman spectroscopy can provide quantitative data as well, FT-IR analysis implements a much stronger signal quality for spectral acquisition and subsequent quantification. Understanding the Beer-Lambert Law provides the foundation to the quantitative capabilities of FT-IR, where transmittance of a sample at a known wavelength is described as the ratio of the radiant power that is given off from the back- end of a sample of an identical wavelength to the incident radiation power. This is described as shown in formula (15).