1000 Genomes-based meta-
analysis identifies 10 novel loci for kidney function
Mathias Gorski
1,2,*, Peter J. van der Most
3,*, Alexander Teumer
4,*, Audrey Y. Chu
5,6,*, Man Li
7,8, Vladan Mijatovic
9, Ilja M. Nolte
3, Massimiliano Cocca
10,11, Daniel Taliun
12, Felicia Gomez
13, Yong Li
14, Bamidele Tayo
15, Adrienne Tin
7, Mary F. Feitosa
13, Thor Aspelund
16,17, John Attia
18,19, Reiner Biffar
20, Murielle Bochud
21, Eric Boerwinkle
22, Ingrid Borecki
23, Erwin P. Bottinger
24, Ming-Huei Chen
5, Vincent Chouraki
25, Marina Ciullo
26,27, Josef Coresh
7, Marilyn C. Cornelis
28, Gary C. Curhan
29,30, Adamo Pio d’Adamo
31, Abbas Dehghan
32, Laura Dengler
2, Jingzhong Ding
33, Gudny Eiriksdottir
16, Karlhans Endlich
34, Stefan Enroth
35, Tõnu Esko
36, Oscar H. Franco
32, Paolo Gasparini
37,38,
Christian Gieger
39,40,41, Giorgia Girotto
37,38, Omri Gottesman
24, Vilmundur Gudnason
16,42, Ulf Gyllensten
35, Stephen J. Hancock
18,43, Tamara B. Harris
44, Catherine Helmer
45,46, Simon Höllerer
1, Edith Hofer
47,48, Albert Hofman
32, Elizabeth G. Holliday
19, Georg Homuth
49, Frank B. Hu
50, Cornelia Huth
41,51, Nina Hutri-Kähönen
52, Shih-Jen Hwang
5, Medea Imboden
53,54, Åsa Johansson
35, Mika Kähönen
55,56, Wolfgang König
57,58,59, Holly Kramer
15, Bernhard K. Krämer
60, Ashish Kumar
53,54,61, Zoltan Kutalik
21, Jean-Charles Lambert
25, Lenore J. Launer
44, Terho Lehtimäki
62,63, Martin H. de Borst
64, Gerjan Navis
64, Morris Swertz
64, Yongmei Liu
33, Kurt Lohman
33, Ruth J. F. Loos
24,65, Yingchang Lu
24,
Leo-Pekka Lyytikäinen
62,63, Mark A. McEvoy
18, Christa Meisinger
41, Thomas Meitinger
66,67, Andres Metspalu
36, Marie Metzger
68, Evelin Mihailov
36, Paul Mitchell
69, Matthias Nauck
70,71,
Albertine J. Oldehinkel
72, Matthias Olden
1,5, Brenda WJH Penninx
73, Giorgio Pistis
10, Peter P. Pramstaller
12, Nicole Probst-Hensch
53,54, Olli T. Raitakari
74,75, Rainer Rettig
76, Paul M. Ridker
6,77, Fernando Rivadeneira
78, Antonietta Robino
38, Sylvia E. Rosas
79, Douglas Ruderfer
24, Daniela Ruggiero
26, Yasaman Saba
80,
Cinzia Sala
10, Helena Schmidt
80, Reinhold Schmidt
47, Rodney J. Scott
81,82, Sanaz Sedaghat
32,
Albert V. Smith
16,42, Rossella Sorice
26,27, Benedicte Stengel
68, Sylvia Stracke
83, Konstantin Strauch
39,84, Daniela Toniolo
10, Andre G. Uitterlinden
78, Sheila Ulivi
38, Jorma S. Viikari
85,86, Uwe Völker
49,71,
Peter Vollenweider
87, Henry Völzke
4,71,88, Dragana Vuckovic
37,38, Melanie Waldenberger
40,41, Jie Jin Wang
69, Qiong Yang
89, Daniel I. Chasman
6,90,91, Gerard Tromp
92, Harold Snieder
3, Iris M. Heid
1, Caroline S. Fox
5, Anna Köttgen
14,93,†, Cristian Pattaro
12,†, Carsten A. Böger
2,†& Christian Fuchsberger
12,†1
Department of Genetic Epidemiology, University Regensburg, Regensburg, Germany.
2Department of
Nephrology, University Hospital Regensburg, Regensburg, Germany.
3Department of Epidemiology, University of Groningen, University Medical Center Groningen, P.O. box 30.001, 9700 RB Groningen, The Netherlands.
4Institute for Community Medicine, University Medicine Greifswald, Walther-Rathenau-Str. 48, 17475 Greifswald, Germany.
5
NHLBI’s Framingham Heart Study, Framingham, MA 01702, USA.
6Division of Preventive Medicine, Brigham and Women’s Hospital and Harvard Medical School, Boston, MA, 02215, USA.
7Department of Epidemiology, Johns Hopkins Bloomberg School of Public Health, 615N Wolfe St, Baltimore, MD, 21205, USA.
8Division of Nephrology and Department of Human Genetics, University of Utah, USA.
9Department of Life and Reproduction Sciences, University of Verona, Strada Le Grazie 8, 37134, Verona, Italy.
10Division of Genetics and Cell Biology, San Raffaele Scientific Institute, 20132, Milano, Italy.
11Department of Medical, Surgical and Health Sciences, University of Trieste, 34100, Trieste, Italy.
12Center for Biomedicine, European Academy of Bozen/Bolzano (EURAC), affiliated to the University of Lübeck, Bolzano, Italy.
13Division of Statistical Genomics, Department of Genetics, Washington University School of Medicine, St Louis, MO, 63108, USA.
14Division of Genetic Epidemiology, Medical Center and Faculty of Medicine - University of Freiburg, Freiburg, Germany.
15Loyola University Chicago, 2160 South First Avenue, Bldg 105, Maywood, IL 60153, USA.
16Icelandic Heart Association, Kopavogur, Iceland.
17University of Iceland, Reykjavik, Iceland.
18School of Medicine and Public Health, University of Newcastle, Australia.
19Public Health Program, Hunter Medical Research Institute, Newcastle, New South Wales, Australia.
20Clinic for Prosthodontic Dentistry, Gerostomatology and Material Science, University Medicine Greifswald, Ferdinand- Sauerbruch-Str., 17475 Greifswald, Germany.
21Institute of Social and Preventive Medicine, Lausanne University Hospital (CHUV), Route de la Corniche 10, 1010, Lausanne, Switzerland.
22University of Texas Health Science Received: 14 October 2016
Accepted: 20 February 2017 Published: 28 April 2017
OPEN
Center at Houston, USA.
23Regeneron Genetics Center, Regeneron Pharmaceuticals, Tarrytown, NY, USA.
24The Charles Bronfman Institute for Personalized Medicine, Ichan School of Medicine at Mount Sinai, USA.
25Inserm U1167, Lille University, Institut Pasteur de Lille, Lille, France.
26Institute of Genetics and Biophysics, “Adriano Buzzati-Traverso”-CNR, Via P. Castellino 111, 80131 Napoli, Italy.
27IRCCS Neuromed, via dell’Elettronica, Pozzilli (Is), Italy.
28Department of Preventive Medicine, Northwestern University Feinberg School of Medicine, 680 N Lake Shore Drive, Suite 1400 Chicago, IL 60611, USA.
29Renal Division, Brigham and Women’s Hospital, USA.
30Channing Division of Network Medicine, Brigham and Women’s Hospital, Boston, MA, USA.
31Clinical Department of Medical, Surgical and Health Science, University of Trieste, Italy.
32Department of Epidemiology, Erasmus Medical Center, Rotterdam, The Netherlands.
33Wake Forest School of Medicine, USA.
34Institute of Anatomy and Cell Biology, University Medicine Greifswald, Friedrich-Loeffler-Str. 23c, 17475 Greifswald, Germany.
35Department of Immunology, Genetics, and Pathology, Biomedical Center, SciLifeLab Uppsala, Uppsala University, SE-75108 Uppsala, Sweden.
36Estonian Genome Center, University of Tartu, Tartu, Estonia.
37Department of Medical Sciences, Chirurgical and Health Department, University of Trieste, Trieste, Italy.
38Institute for Maternal and Child Health - IRCCS “Burlo Garofolo”, Trieste, Italy.
39Institute of Genetic Epidemiology, Helmholtz Zentrum München, German Research Center for Environmental Health, Ingolstädter Landstr. 1, 85764 Neuherberg, Germany.
40
Research Unit of Molecular Epidemiology, Helmholtz Zentrum München - German Research Center for Environmental Health, Neuherberg, Germany.
41Institute of Epidemiology II, Helmholtz Zentrum München, German Research Center for Environmental Health, Ingolstädter Landstr. 1, 85764 Neuherberg, Germany.
42
Faculty of Medicine, University of Iceland, Reykjavik, Iceland.
43Health Services Research Group, University of Newcastle, Australia.
44Intramural Research Program, Laboratory of Epidemiology and Population Studies, National Institute on Aging, USA.
45INSERM, Centre INSERM Research Center U1219, Bordeaux, France.
46
University Bordeaux, ISPED, Bordeaux, France.
47Clinical Division of Neurogeriatrics, Department of Neurology, Medical University of Graz, Austria.
48Institute of Medical Informatics, Statistics and Documentation, Medical University of Graz, Austria.
49Interfaculty Institute for Genetics and Functional Genomics, University Medicine Greifswald, Friedrich-Ludwig-Jahn-Str. 15a, 17475 Greifswald, Germany.
50Department of Nutrition, Harvard School of Public Health and Channing Division of Network Medicine, Brigham and Women’s Hospital, USA.
51
German Center for Diabetes Research (DZD), Neuherberg, Germany.
52Department of Pediatrics, Faculty of Medicine and Life Sciences, University of Tampere, Tampere 33014, Finland.
53Unit Chronic Disease Epidemiology, Swiss Tropical and Public Health Institute, Basel, Switzerland.
54University of Basel, Switzerland.
55Department of Clinical Physiology, Tampere University Hospital, Tampere 33521, Finland.
56Department of Clinical Physiology, Faculty of Medicine and Life Sciences, University of Tampere, Tampere 33014, Finland.
57Deutsches Herzzentrum München, Technische Universität München, Munich, Germany.
58DZHK (German Centre for Cardiovascular Research), partner site Munich Heart Alliance, Munich, Germany.
59Department of Internal Medicine II - Cardiology, University of Ulm Medical Center, Ulm, Germany.
60University Medical Centre Mannheim, 5th Department of Medicine, University of Heidelberg, Theodor Kutzer Ufer 1–3, 68167 Mannheim, Germany.
61Institute of Environmental Medicine, Karolinska Institute, Stockholm, Sweden.
62Department of Clinical Chemistry, Fimlab Laboratories, Tampere 33520, Finland.
63Department of Clinical Chemistry, Faculty of Medicine and Life Sciences, University of Tampere, Tampere 33014, Finland.
64University Medical Center Groningen, University of Groningen, The Netherlands.
65The Mindich Child Health Development Institute, Icahn School of Medicine at Mount Sinai, USA.
66Institute of Human Genetics, Helmholtz Zentrum München, German Research Center for Environmental Health, Neuherberg, Germany.
67Institute of Human Genetics, Technische Universität München, Munich, Germany.
68
Inserm U1018, University Paris-Sud, UVSQ, University Paris-Saclay, Villejuif, France.
69Centre for Vision Research, Department of Ophthalmology and Westmead Institute for Medical Research, University of Sydney C24, NSW, 2145, Australia.
70Institute of Clinical Chemistry and Laboratory Medicine-University Medicine Greifswald, Ferdinand-Sauerbruch-Str., 17475 Greifswald, Germany.
71DZHK (German Center for Cardiovascular Research), partner site Greifswald, Greifswald, Germany.
72Department of Psychiatry, University of Groningen, University Medical Center Groningen, P.O. box 30.001, 9700 RB, Groningen, The Netherlands.
73Department of Psychiatry, Vrije Universiteit, VU University Medical Center, NESDA, A.J. Ernststraat 1187, 1081HL Amsterdam, The Netherlands.
74Department of Clinical Physiology and Nuclear Medicine, Turku University Hospital, Turku 20521, Finland.
75Research Centre of Applied and Preventive Cardiovascular Medicine, University of Turku, Turku 20520, Finland.
76Institute of Physiology, University Medicine Greifswald, 17475 Greifswald, Germany.
77Division of Cardiovascular Medicine, Brigham and Women’s Hospital and Harvard Medical School, Boston MA 02115, USA.
78
Department of Internal Medicine, Erasmus Medical Center, Rotterdam, The Netherlands.
79Joslin Diabetes Center. Harvard Medical School, Boston, MA, USA.
80Institute of Molecular Biology and Biochemistry, Centre for Molecular Medicine, Medical University of Graz, Austria.
81School of Biomedical Sciences and Pharmacy, University of Newcastle, Australia.
82Molecular Medicine, Pathology North Ph. 0409926764, Newcastle, Australia.
83Clinic for Internal Medicine A, University Medicine Greifswald, Ferdinand-Sauerbruch-Str., 17475 Greifswald, Germany.
84
Institute of Medical Informatics, Biometry and Epidemiology, Chair of Genetic Epidemiology, Ludwig-
Maximilians-Universität, Munich, Germany.
85Division of Medicine, Turku University Hospital, Turku 20521, Finland.
86
Department of Medicine, University of Turku, Turku 20520, Finland.
87Department of Internal Medicine, Lausanne University Hospital (CHUV), Lausanne, Switzerland.
88DZD (German Center for Diabetes Research), Site Greifswald, Greifswald, Germany.
89Department of Biostatistics, Boston University School of Public Health, 715 Albany Street, Boston, MA 02118, USA.
90Division of Genetics, Brigham and Women’s Hospital and Harvard Medical School, Boston MA, USA.
91Broad Institute of MIT and Harvard, Cambridge MA 02142 USA.
92Weis Center for Research, Geisinger Clinic, Danville, Pennsylvania, USA.
93Department of Epidemiology, Johns Hopkins Bloomberg School of Public Health, Baltimore, USA.
*These authors contributed equally to this work.
†These authors jointly supervised this work. Correspondence and requests for materials should be addressed to M.G. (email: mathias.gorski@klinik.
uni-regensburg.de) or C.F. (email: christian.fuchsberger@eurac.edu) or C.P. (email: cristian.pattaro@eurac.edu)
HapMap imputed genome-wide association studies (GWAS) have revealed >50 loci at which common variants with minor allele frequency >5% are associated with kidney function. GWAS using more complete reference sets for imputation, such as those from The 1000 Genomes project, promise to identify novel loci that have been missed by previous efforts. To investigate the value of such a more complete variant catalog, we conducted a GWAS meta-analysis of kidney function based on the estimated glomerular filtration rate (eGFR) in 110,517 European ancestry participants using 1000 Genomes imputed data. We identified 10 novel loci with p-value < 5 × 10
−8previously missed by HapMap-based GWAS. Six of these loci (HOXD8, ARL15, PIK3R1, EYA4, ASTN2, and EPB41L3) are tagged by common SNPs unique to the 1000 Genomes reference panel. Using pathway analysis, we identified 39 significant (FDR < 0.05) genes and 127 significantly (FDR < 0.05) enriched gene sets, which were missed by our previous analyses. Among those, the 10 identified novel genes are part of pathways of kidney development, carbohydrate metabolism, cardiac septum development and glucose metabolism. These results highlight the utility of re-imputing from denser reference panels, until whole- genome sequencing becomes feasible in large samples.
Chronic kidney disease (CKD) is a major public health concern affecting ~10% of the global adult population
1. CKD is defined based on the glomerular filtration rate estimated from serum creatinine (eGFRcrea), a quantita- tive phenotype for which 53 loci have been identified so far by meta-analyses of genome-wide association studies (GWAS)
2–7. These GWAS meta-analyses were based on ~2.5 million variants imputed from the HapMap Project reference panel
8. Similar to the genetic variants identified for other phenotypes, all variants associated with eGFR- crea had a minor allele frequency (MAF) of > 5%. However, though heritability of eGFR has been estimated in family studies to range between 36–75%
9,10, the identified variants explain less than 4% of the variance of eGFR- crea
7and are located in regions of extended linkage disequilibrium (LD). So far, causal genes or variants have only been identified for a few of the association signals
11,12.
It has been shown that variants poorly tagged by GWAS arrays and HapMap imputation, particularly low-frequency variants (1% ≤ MAF ≤ 5%), can explain additional variability
13. Recent technological advances resulted in large collections of whole-genome sequence data, such as those from The 1000 Genomes project
14,15. These data provide better coverage and increased imputation quality compared to previous HapMap imputa- tion
16, particularly for low-frequency variants.
We undertook a meta-analysis of GWAS from 33 studies that imputed genotypes from The 1000 Genomes reference panel, hypothesizing that this would uncover novel common variants associated with eGFRcrea, extend to low-frequency variants, reveal novel pathways of eGFRcrea associated genes, and improve fine-mapping of known eGFRcrea loci previously identified by our HapMap-based GWAS
3–7.
Results
Study characteristics. In total, 110,517 adult individuals of European ancestry from 33 studies participated in GWAS meta-analysis of eGFRcrea using genotypes imputed with The 1000 Genomes Phase I reference panel
14(1000 Genomes meta-analysis). In addition, we performed a GWAS meta-analysis of eGFR derived from cystatin C (eGFRcys), an alternative marker of kidney function available in 11 of the 33 studies (n = 24,063). Participating studies, phenotypic characteristics, genotype information, and methods of analysis are reported in Supplementary Tables 1, 2, 3 and 4, respectively. The 1000 Genome meta-analysis results on eGFRcrea are compared with our previously published HapMap imputed data
7, which was a HapMap-based meta-analysis of 133,814 European ancestry individuals from 50 studies.
Imputation quality of variants imputed with The 1000 Genomes reference panel. The 1000 Genomes meta-analysis consisted of 10,971,307 genetic variants (10,159,097 SNPs and 812,210 insertion-deletions) with imputation quality IQ > 0.4
17in each of the studies and present in at least 50% of the subjects. Depending on the imputation methodology used, the IQ was reported as RSQ
18or info-score
19(Supplementary Table 3). Compared to the HapMap meta-analysis, the 1000 Genomes meta-analysis included a higher number of well imputed variants (8,103,124 versus 2,249,027 variants with IQ > 0.8), particularly among the low-frequency variants (1,585,176 versus 191,580, Supplementary Table 5). While rare variants (MAF ≤ 1%) were not available in the previous HapMap meta-analysis, there were even 632,526 well-imputed rare variants in the 1000 Genomes meta-analysis. When limiting the comparison to variants available in both panels, the propor- tion of well-imputed variants was higher in the 1000 Genomes compared to the HapMap meta-analysis (96.9%
versus 93.3% for all; 88.3% versus 78.4% for the less frequent variants, Supplementary Table 5).
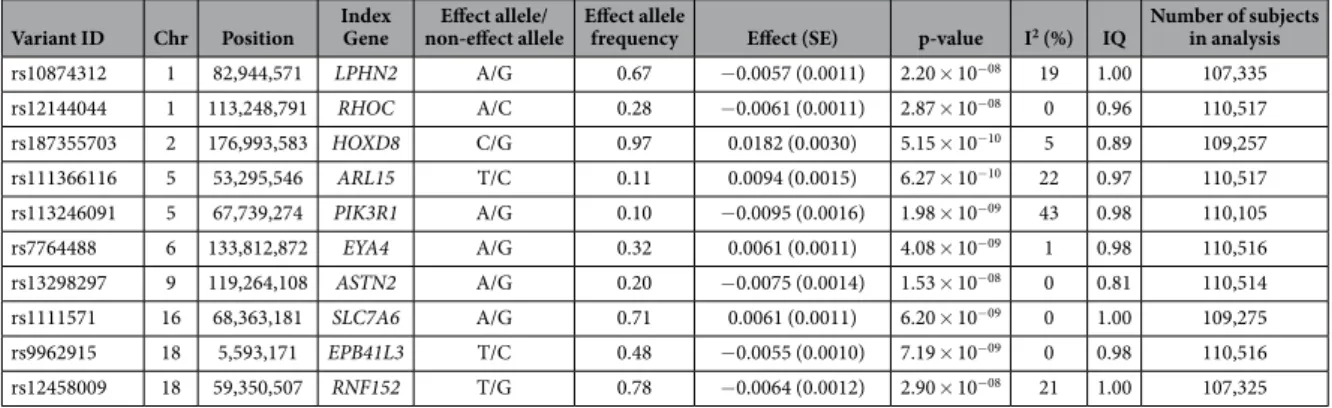
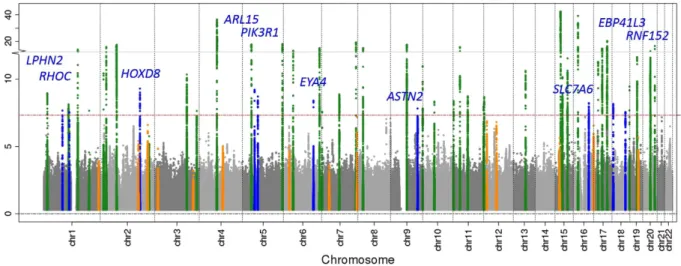
1000 Genomes meta-analysis results. The 1000 Genomes meta-analysis identified 49 genome-wide
significant loci for eGFRcrea including 10 novel loci (lead variant p-value < 5 × 10
−8, Table 1, Fig. 1, and
Supplementary Figure 1). All identified lead variants were SNPs, and all were common, except rs187355703
near HOXD8 (MAF = 0.03). None of the novel loci contained genes known to cause monogenic forms of kid-
ney disease and for most genes no connection to kidney function or kidney disease has yet been described
(Supplementary Table 6). However, it should be acknowledged that genetic variants identified in GWAS are not
necessarily associated with the function of the physically closest gene. Of the 53 known eGFRcrea loci iden-
tified previously based on HapMap
2–7, 39 were also genome-wide significant in the current 1000 Genomes
meta-analysis (Supplementary Table 7) and the remaining 14 showed directions of association consistent with
published reports, but did not reach significance (p-values 2.2 × 10
−2to 5.2 × 10
−7; Supplementary Table 8). These
results are consistent with our expectations from power computations (Fig. 2). Among the 39 lead variants in previously published loci that were genome-wide significant in the 1000 Genomes meta-analysis, 6 lead variants were found to be the same as the previously published variants, 25 were highly correlated (r
2> 0.6), and 8 showed moderate or no correlation (r
2≤ 0.6).
The 1000 Genomes meta-analysis of eGFRcys confirmed previously identified loci in or near CST3/CST9 (p-value = 4.1 × 10
−153), UMOD (p-value = 2.9 × 10
−10), and ATXN2 (p-value = 1.6 × 10
−8), but did not reveal any novel signal.
The ten novel eGFRcrea loci in the context of the different reference panels. For six of the ten novel loci (HOXD8, ARL15, PIK3R1, EYA4, ASTN2, and EPB41L3), the lead variant identified in the 1000 Genomes meta-analysis was not observed in any previous HapMap meta-analysis and in fact was not geno- typed as part of the HapMap reference panel. Moreover, no variant in LD with any of these six lead variants (r
2or D’ ≥ 0.4) was available in the HapMap panel. These loci have been missed due to the limited coverage of the HapMap panel.
For one further locus, RHOC, the 1000 Genome meta-analysis lead variant was present also in our previous HapMap meta-analysis, but with a lower imputation quality (1000 Genomes median IQ across all studies of 0.96 versus HapMap median IQ of 0.86). The effect size was slightly higher in the 1000 Genomes compared to the HapMap meta-analysis (0.0061 versus 0.0051 ln ml/min/1.73 m
2, Supplementary Table 9). This locus might have been missed in the HapMap meta-analysis due to the higher uncertainty in the imputed genotypes, which is known to diminish power and to attenuate effect size in linear regression
20.
For the remaining three loci (LPHN2, SLC7A6 and RNF152), the lead variants of the 1000 Genomes meta-analysis were observed in the HapMap meta-analysis and similarly well imputed (IQ near 1.0 for both panels).
The effect sizes were similar for all three SNPs in both 1000 Genomes and HapMap meta-analyses (0.0057 versus 0.0041, 0.0061 versus 0.0049, 0.0064 versus 0.0050 ln ml/min/1.73 m
2respectively) and the HapMap estimates lie well within the 98.5% confidence interval of the 1000 Genomes estimates. No substantial between-study het- erogeneity was observed (I
2= 19%, 0%, or 21%, respectively, Supplementary Table 9). Since the p-values in the HapMap analysis were just short of genome-wide significance (p-values 8.38 × 10
−6to 2.33 × 10
−7; type II error of 14–29%), it is conceivable that these variants have been missed previously by chance.
Pathway analyses. Data-driven Expression Prioritized Integration for complex Traits (DEPICT)
21anal- ysis of eGFRcrea identified 39 significant (FDR < 0.05) genes and 127 significantly (FDR < 0.05) enriched gene sets that were not identified previously
7. Among those, 23 gene sets contained at least one of the 10 novel index genes as a top 10 hit, underpinning the influence of ureteric bud morphogenesis on kidney development and the influence of abnormal glucose homeostasis and glucan metabolic process on carbohydrate metabo- lism (Supplementary Table 10). All 127 significant gene sets were further grouped into meta gene sets, corre- sponding to their correlation of gene expression. The two most significant meta gene sets were Cardiac Septum Development (p-value = 4.48 * 10
−5) and Glucose Metabolism (p-value = 6.11 * 10
−5), containing one of the 10 novel index genes (Supplementary Figure 2). We repeated the analysis with varying parameters (50, 200, and 500 repetitions and 500, 2000, and 5000 permutations, respectively), confirming our primary top gene sets at an FDR of < 0.05. P-values ranged from 1.32 × 10
−3to 4.48 × 10
−5and from 8.27 × 10
−4to 4.98 × 10
−5for Cardiac Septum Development and Glucose Metabolism, respectively. We replicated also the strong influence of embryonic development, kidney transmembrane transporter activity, and kidney and urogenital system morphology in the genesis of CKD from our previous findings
7: enrichment of all 148 previously identified gene sets was nominally significant (p-value < 0.05).
Variant ID Chr Position Index
Gene Effect allele/
non-effect allele Effect allele
frequency Effect (SE) p-value I
2(%) IQ Number of subjects in analysis
rs10874312 1 82,944,571 LPHN2 A/G 0.67 − 0.0057 (0.0011) 2.20 × 10
−0819 1.00 107,335
rs12144044 1 113,248,791 RHOC A/C 0.28 − 0.0061 (0.0011) 2.87 × 10
−080 0.96 110,517
rs187355703 2 176,993,583 HOXD8 C/G 0.97 0.0182 (0.0030) 5.15 × 10
−105 0.89 109,257
rs111366116 5 53,295,546 ARL15 T/C 0.11 0.0094 (0.0015) 6.27 × 10
−1022 0.97 110,517
rs113246091 5 67,739,274 PIK3R1 A/G 0.10 − 0.0095 (0.0016) 1.98 × 10
−0943 0.98 110,105
rs7764488 6 133,812,872 EYA4 A/G 0.32 0.0061 (0.0011) 4.08 × 10
−091 0.98 110,516
rs13298297 9 119,264,108 ASTN2 A/G 0.20 − 0.0075 (0.0014) 1.53 × 10
−080 0.81 110,514
rs1111571 16 68,363,181 SLC7A6 A/G 0.71 0.0061 (0.0011) 6.20 × 10
−090 1.00 109,275
rs9962915 18 5,593,171 EPB41L3 T/C 0.48 − 0.0055 (0.0010) 7.19 × 10
−090 0.98 110,516
rs12458009 18 59,350,507 RNF152 T/G 0.78 − 0.0064 (0.0012) 2.90 × 10
−0821 1.00 107,325
Table 1. The 10 novel genome-wide significant loci (p < 5 × 10
−8) associated with eGFRcrea in up to
110,517 subjects from up to 33 studies. Positions are given on GRCh build 37. The gene closest to the variant
is listed (index gene). Effect sizes are given on the log scale. IQ = Imputation quality metric computed as
median of info score (ImputeV2) or RSQ (minimac) across studies. SE = standard error. I
2= between-study
heterogeneity statistic.
Figure 1. Manhattan Plot of the results of the 1000 Genome meta-analysis of eGFRcrea. Shown are the (− log10) p-values by genomic position (GRCh build 37). Highlighted are the 10 novel loci identified with genome-wide significance (blue, annotated by nearest gene), the 39 previously published
2–7and confirmed (genome-wide significant) loci (green) and the 14 previously published loci that were not genome-wide significant in this analysis (orange).
Figure 2. Effects of the 1000 Genomes lead variants for all novel and known loci. Shown are the effect sizes and minor allele frequencies (MAF) of the 1000 Genomes lead variants (variants with smallest p-value) in each of the 10 novel (blue), the 39 known genome-wide significant loci (green), and the 14 known loci that were not genome-wide significant in this analysis (orange). Additionally, the 80% power to detect such effects in a sample size of 110,000 subjects (as in this 1000 Genomes meta-analysis) is shown as a red line. A known locus is defined by the published lead variant ± 1 Mb; a novel locus is defined by the 1000 Genome lead variant ± 1 Mb.
Independent association signals at novel and known loci. To identify independent association
signals within a known or novel locus, we performed joint conditional analysis of eGFRcrea based on aggre-
gated study-specific statistics using the GCTA software
22. Among the combined 49 loci (39 known and 10 novel)
attaining genome-wide significance, we uncovered eight independent signals, all among the previously reported
loci, with p-values ranging from 2.39 × 10
−8to 2.78 × 10
−17after conditioning on the lead variants at each locus
(Supplementary Table 11 and Supplementary Figure 3). We found that in all but one locus (DDX1), the previously
reported lead variant was also genome-wide significant in our 1000 Genomes meta-analysis. A more detailed
reasoning for the independent association signals is proposed in Supplementary Table 12. Information about biological knowledge of the highlighted genes is presented in Supplementary Table 13.
Proportion of phenotypic variance explained and polygenic risk score (PRS) analysis. The overall proportion of phenotypic variance of eGFRcrea explained by the lead variants of the 1000 Genomes meta-analysis in all novel and known loci was 3.99%: 0.46% by the 10 lead variants in the novel loci, 3.12% by the 39 lead variants in the known loci, and 0.41% by the 1000 Genomes lead variants in the 14 known loci that were not genome-wide significant in this analysis.
Next, we tested the proportion of eGFRcrea variance that could be explained by common genetic variants in 1,071 independent adolescents participating in the TRAILS study. Given prior evidence that eGFRcrea-associated genes are preferentially expressed in the kidney and enriched for genes important in kidney development
23, exter- nal influences on eGFRcrea such as those for the two main drivers of CKD, diabetes and hypertension, may be less important in this setting. In TRAILS, the maximum proportion of variance explained by SNPs asso- ciated at pre-defined p-value thresholds was 2.2% for a PRS composed of SNPs associated with eGFRcrea at p-value < 1 × 10
−5(Supplementary Table 14).
SNP-based heritability analysis. The heritability estimate using variants of MAF > 0.01 for eGFRcrea in the ARIC study was 0.21 (95% CI 0.14–0.28) and 0.31 (95% CI 0.20–0.41) for all variants. This is in line with estimates in the literature from population-based family studies such as the Framingham Heart Study (adjusted h
20.33, 95% CI 0.19–0.47)
24.
Expression quantitative trait loci (eQTL) lookup. To explore potential functional implications of the novel loci, we interrogated published databases of cis eQTL in whole blood
25for the significant SNPs or their proxy variants (r
2> 0.8 within a 1 MB window). At 2 novel loci, significant association (p-value < 0.004) with gene expression were found: rs1111571 with SLC7A6, ZFP90, LYPLA3 and NFATC3, and for rs12144044 with RHOC and ST7L (Supplementary Table 15).
We expanded our downstream analysis by annotating the significant variants with known and predicted reg- ulatory elements using Regulome DB
26: We confirmed rs1111571 and rs12144044 as significant associations with gene expression and found supporting evidence that these two variants show also evidence for transcription factor binding sites and DNase peaks. For the locus identified by rs187355703 no proxy was found for lookup.
Genetic correlation. To investigate the genetic correlation of serum creatinine with related phenotypes, we queried LD Hub
27and identified modest genetic correlation with metabolic syndrome traits such as HDL, LDL, Type 2 diabetes, fasting glucose, BMI, and waist (LD score regression genetic correlation between − 0.07 and 0.05). Little evidence for kidney damage is reported for a risk score of SNPs which are significant predictors of blood pressure
28.
Discussion
The main finding of our study is that imputing from denser and larger reference panels is a valid strategy to advance gene mapping even when the sample size cannot be increased. Using genotype imputation based on The 1000 Genomes panel led to the identification of 10 novel genome-wide significant loci for kidney function that were missed by earlier HapMap-imputed GWAS of larger sample size, partly due to the enhanced coverage of genomic variation. This phenomenon was observed in similar analyses of other phenotypes
29. Still, it needs to be acknowledged that the additional proportion of trait variance explained by these new loci is moderate, which is also in line with findings from GWAS of other phenotypes
30.
There are several methodological insights that can be gained from our analyses. First, this 1000 Genomes-based meta-analysis of 110,517 individuals has identified 10 novel loci and 8 independent association signals in known loci that were missed by our latest HapMap based analysis
7. Our detailed dissection shows that 1000 Genomes imputation (i) provides variants missed or poorly tagged by HapMap based analysis and (ii) achieves a higher effective sample size through increased imputation quality.
Second, although the 1000 Genomes imputation enables the analysis of low-frequency variants, insertions and deletions, all identified top variants were SNPs, and all but one (near HOXD8) were common. Moreover, we did not identify any low-frequency variant of large effect. Our results are highly concordant with those of other recent complex diseases studies
31showing that low-frequency variants are also contributing to complex disease risk, but that most observed effect sizes are small or modest, and hundreds of thousands of subjects are required for detection. To identify the contribution of rare variants (MAF < 1%) to eGFRcrea, large-scale sequencing data in addition to genomic chip data have been shown to be a promising approach
31.
Third, these novel loci, missed by our previous analysis
7, extend our knowledge of pathways underlying kidney function, which depicts the influence of kidney development, kidney structure, and metabolic activity on the development of CKD.
The comparison of our 1000 Genomes meta-analysis with our previous HapMap meta-analysis is limited by several factors: the current analysis consists of a reduced number of samples and a slightly different study com- position. Furthermore, different 1000 Genomes reference panels were used to impute genotypes and advances in imputation software and methodology must be acknowledged
32,33. Nevertheless, six of the ten lead variants in the novel loci are only covered by The 1000 Genomes reference panels, which demonstrates the advantage of meta-analyses on 1000 Genomes over HapMap imputed genotypes.
In conclusion, we identified 10 novel loci and 8 additional independent association variants within known loci
associated with kidney function and identified 127 novel pathways for kidney function. These results highlight
the utility of re-imputing studies from improved reference panels as an intermediate cost-efficient approach to scan the full allelic frequency range for kidney function associated variants, until whole genome sequencing is feasible in large samples.
Methods
Phenotype definition. Each study measured serum creatinine as described in Supplementary Table 1.
Between-laboratory variation has been accounted for by calibrating creatinine to the US nationally representative National Health and Nutrition Examination Study (NHANES) data in all studies
4,34,35. GFR based on serum cre- atinine (eGFRcrea) was estimated using the four-variable Modification of Diet in Renal Disease (MDRD) Study Equation
36,37. In a subset of studies, serum cystatin C was also obtained and eGFRcys estimated as 76.7*(serum cystatin C)
−119(see also ref. 38). The eGFRcrea and eGFRcys values < 15 ml/min/1.73 m
2were set to 15, and val- ues > 200 were set to 200 ml/min/1.73 m
2. If not stated otherwise, our presented data and results are for eGFRcrea, which was our main analysis.
Genotyping. Genotyping was conducted in each study as specified in Supplementary Table 3. After applying appropriate quality filters, participating studies performed genotype imputation with standard imputing pro- cedures
32,33,39using any version of the 1000 Genome Phase 1 reference panels. The obtained imputed genetic variants were coded as allelic dosages. Details of study specific imputation procedure and specific reference panel are given in Supplementary Table 3.
Genome-wide association analysis. Each study performed GWAS according to a uniform analysis plan by regressing sex- and age-adjusted residuals of the natural logarithm of eGFRcrea and eGFRcys on the allelic dosage levels. When appropriate, adjustment for study-specific features such as study site or genetic principal components was included in the model. Family-based studies accounted for relatedness using mixed effect mod- els. Details on the study-specific methods are reported in Supplementary Table 4.
GWAS meta-analysis. All GWAS files underwent quality control using the GWAtoolbox package
40. GWAS meta-analyses for eGFRcrea and eGFRcys were performed using the software METAL
41assuming fixed effects across studies and using inverse-variance weighting, excluding variants with imputation quality IQ ≤ 0.4 or vari- ants present in less than 50% of the 110,517 subjects (yielding 10,971,307 variants). The genomic inflation factor λ was estimated for each study as the ratio between the median of all observed test statistics (b/SE)
2and the expected median of a chi-squared with 1 degree of freedom, with b and SE representing the effect of each SNP on ln eGFRcrea or ln eGFRcys and its standard error, respectively. Genomic-control (GC) correction
42was applied to p-values and SEs in case of λ > 1 (1st GC correction). To limit the possibility of false positives, a second GC cor- rection on the aggregated results was applied after the meta-analysis. Between-study heterogeneity was assessed with the I
2statistic
43.
Definition of known and novel loci. Known loci were defined by a previously published lead vari- ant that had shown genome-wide significant association with eGFRcrea (p-value < 5 × 10
−8) and the genetic segment around it (lead SNP ± 1 Mb)
2–7. Variants outside such segments and associated with eGFRcrea at a p-value < 5 × 10
−8in the 1000 Genomes meta-analysis defined the novel loci. Each novel locus was pinpointed by the lead variant with the smallest p-value ± 1 Mb.
Comparison of 1000 Genomes and HapMap results. For the variants available in both the 1000 Genomes and HapMap meta-analyses, we compared lead variants, effect sizes, imputation quality as well as the power that we had in the data to detect the respective effects. For this comparison, we also utilized the association results of our previous HapMap meta-analysis
7in 50 studies including a maximum of 133,814 subjects. Power was calculated in R (www.r-project.org) for the approximate maximum number of subjects in the 1000 Genomes meta-analyses (n = 110,000) to identify the lead variants with an alpha of 5 × 10
−8. Further, effective power, which takes into account the imputation quality of the variant, was calculated based on the effective number of subjects, which is the number of subjects per variant multiplied by the median of the imputation quality across studies.
Pathway Analyses. Pathway analyses, comprised of pathway/gene set enrichment and tissue/cell type analyses, were performed by applying a software package called Data-Driven Expression Prioritized Integration for Complex Traits (DEPICT)
21. DEPICT performs gene set enrichment analyses by testing whether genes in GWAS-associated loci are enriched for reconstituted versions of known molecular pathways (jointly referred to as reconstituted gene sets). The reconstitution is accomplished by identifying genes that are co-regulated with other genes in a given gene set based on a panel of 77,840 gene expression microarrays
44. Genes that are found to be transcriptionally co-regulated with genes from the original gene set are added to the gene set, which results in the reconstitution. Several types of gene sets were reconstituted in DEPICT: 5,984 protein molecular pathways derived from 169,810 high-confidence experimentally derived protein-protein interactions
45, 2,473 phenotypic gene sets derived from 211,882 gene-phenotype pairs from the Mouse Genetics Initiative
46, 737 Reactome data- base pathways
47, 184 Kyoto Encyclopedia of Genes and Genomes (KEGG) database pathways
48and 5,083 Gene Ontology database terms
49. In total, 14,461 gene sets were assessed for enrichment in genes in associated regions.
DEPICT also facilitates tissue and cell type enrichment analyses by testing whether the genes in associated regions are highly expressed in any of the 209 MeSH annotations for 37,427 microarrays on the Affymetrix U133 Plus 2.0 Array platform.
In our analysis, we used DEPICT version 1 rel194 and to be comparable to our previous analysis, included
all variants reaching eGFRcrea association p-values < 1 × 10
−5from HapMap and 1000 Genomes imputed data
with genomic coordinates defined by genome build GRCh38 (https://genome.ucsc.edu/cgi-bin/hgLiftOver).
Since 1000 Genomes imputed loci in the DEPICT analysis differed slightly from the HapMap imputed loci, our HapMap and 1000 Genomes input was created by adding all significant 1000 Genomes variants to all significant HapMap variants. This process resulted in a total of 3,659 variants for HapMap, 7,894 variants for 1000 Genomes, and 9,270 variants for HapMap and 1000 Genomes analyses. Next, independent lead variants were identified with Plink
50using ± 500 kb flanking regions and r
2> 0.01 with the 1000 Genomes data
14as reference. Genomic intervals are generated consisting of all variants within r
2> 0.5 to each lead variant. If any of the 19,987 genes in the analysis overlaps or resides within a genomic interval, it is mapped to that interval. After merging of overlap- ping regions and excluding regions within the major histocompatibility complex on chromosome 6, base pairs 25,000,000–35,000,000, DEPICT analyses were conducted using the following parameters: 200 repetitions to compute FDR and 2,000 permutations to compute p-values adjusted for gene length by using 500 null GWAS. For the enrichment analysis we used 10,968 reconstituted gene sets. For visualization, all novel significant gene sets were further merged into meta gene sets by running an affinity propagation
51from Pythons scikit-learn package (http://scikit-learn.org/). The network was visualized with Cytoscape (http://cytoscape.org/).
Identification of independent association signals with GCTA. We searched for independent associ- ation signals in the known and novel loci with a joint conditional analysis on the aggregated meta-analysis results using the GCTA-COJO method (conditional and joint genome-wide association analysis)
22,52. The KORA-F4 GWAS data
53were used to estimate the LD (r
2) in the joint conditional analysis, and to quantify the extent of coinheritance (D’)
50. A potential independent association signal within a given locus was reported if the variant with the smallest conditional p-value was genome-wide significant (p-value < 5 × 10
−8) after conditioning on the previously reported variant in a locus.
SNP-based heritability analysis. The heritability of eGFRcrea was estimated using GCTA GREML-LDMS methods
54(version 1.25) with imputed genotype accounting for linkage disequilibrium. The imputed genotype was based on dosage (probability > 0.9) imputed using the 1000 Genomes Phase I reference panel and filtered by the following criteria: HWE < 1 × 10
−6, individual missingness > 5%, SNP missingness > 5%, and MAF < 0.0005 (~3 copies).
Proportion of phenotypic variance explained. To quantify the impact of the identified genetic loci on renal function, the percent of phenotypic variance explained by all lead variants in the novel and known loci was estimated as Beta ∗ var variant
var eGFRcrea
( )
(resid(ln( )))
2