Technische Universität Berlin
Examination
Digital Image Processing
Summer term 2012
Computer Vision &
Remote Sensing Prof. Olaf Hellwich
Name: ... Student ID: ...
Duration: 1 hour Auxiliary material: None
________________________________________________________________________________
Berlin, July 10, 2012
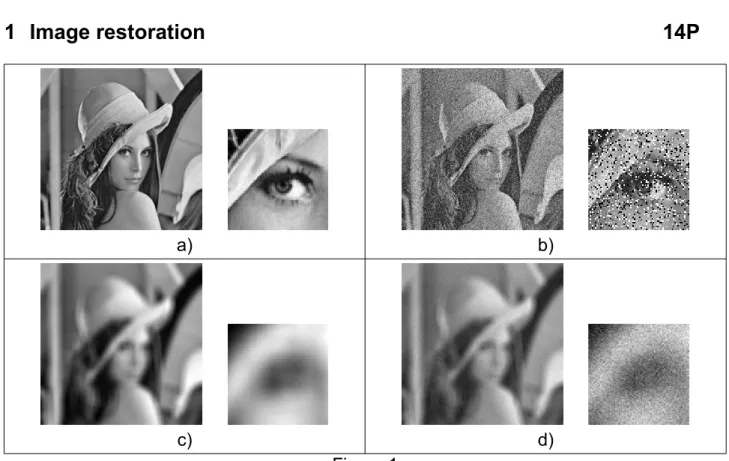
1 Image restoration 14P
a)
b)
c)
d) Figure 1
Figure 1b) - d) depict three different degradations of the original image shown in Figure 1a). Additionally to the whole image data on the left, a small section of the same image is shown in more detail on the right side of each sub-figure.
a) To each of those degradations give a reasonable signal model. (3P) b) Each of the three images shall be restored by one of the following three approaches:
Median Filter, Inverse Filter, Wiener Filter.
i) State which image should be restored by which approach, but use
each method only once. (3P)
ii) Explain your choice and provide a brief description of the algorithms. (6P)
Figure 2
c) The image in Figure 1b) is processed with another filter and the outcome is shown in Figure 2.
What kind of filter was probably used and why
did it produce those severe image artifacts? (2P)
2 Convolution 13P
0 1 0
1 -4 1
0 1 0
a)
1 1 2 0
1 2 0 0
2 0 0 1
b)
a) Convolve the image in Figure 3b) with the filter given by Figure 3a). Pixel values beyond the
borders of the image shall be assumed as zero. (2P)
Figure 3
b) What is the effect of the filter in Figure 3a)? To which of the three following
filter categories does it belong: high-, low-, or band-pass filter? (2P)
a) b) c)
Figure 4
c) A moving average filter was applied to the image in Figure 4a).
The convolution was carried out in spatial domain (result in Figure 4b) ) and additionally as multiplication in frequency domain (result in Figure 4c) ).
i) Explain which assumptions lead to the unexpected border values
in each image and why they are different for both methods. (3P) ii) What steps are necessary for the convolution in spatial domain
to produce the result in Fig. 4c)? (1P)
iii) What steps are necessary for the convolution by multiplication in
frequency domain to produce the result in Fig. 4b)? (1P)
d) Table 1 shows a one-dimensional signal in time domain in the left column
and the amplitude of the corresponding frequency spectrum in the right column.
Fill the missing cells in Table 1 with the corresponding sketches (4P)
Spatial Domain Frequency Domain
Table 1
3 Interest Points 6P
a) What is the structure tensor and how is it calculated? (4P) b) What is measured by weight and isotropy of the Förstner operator? (2P)
4 Morphology 6P
a) What is meant by applying a closing operation to a binary image?
Outline briefly the algorithm and define necessary operators in your answer. (3P) b) What are possible applications of such a closing operation? (1P) c) Describe how morphological operators can be used
to detect edges in a binary image. (2P)
A total of 39 points can be attained.
A short and accurate style as well as a clear handwriting should be intended.
Pay attention to a clear and comprehensible preparation of sketches.
Lot's of luck and do your best!
