Policy Research Working Paper 6228
What Explains Big Gender Disparities in India?
Local Industrial Structures and Female Entrepreneurship
Ejaz Ghani William R. Kerr Stephen D. O’Connell
The World Bank
Poverty Reduction and Economic Management Network Economic Policy and Debt Department
October 2012
WPS6228
Public Disclosure AuthorizedPublic Disclosure AuthorizedPublic Disclosure AuthorizedPublic Disclosure Authorized
Produced by the Research Support Team
Abstract
The Policy Research Working Paper Series disseminates the findings of work in progress to encourage the exchange of ideas about development issues. An objective of the series is to get the findings out quickly, even if the presentations are less than fully polished. The papers carry the names of the authors and should be cited accordingly. The findings, interpretations, and conclusions expressed in this paper are entirely those of the authors. They do not necessarily represent the views of the International Bank for Reconstruction and Development/World Bank and its affiliated organizations, or those of the Executive Directors of the World Bank or the governments they represent.
Policy Research Working Paper 6228
Despite rapid economic growth, gender disparities in women’s economic participation have remained deep and persistent in India. What explains these huge gender disparities? Is it poor infrastructure, limited education, and gender composition of the labor force and industries?
Or is it deficiencies in social and business networks and a low share of incumbent female entrepreneurs?This paper analyzes the spatial determinants of female entrepreneurship in India in the manufacturing and services sectors. Good infrastructure and education predict higher female entry shares. There are strong agglomeration economies in both manufacturing and services, where higher female ownership among
This paper is a product of the Economic Policy and Debt Department, Poverty Reduction and Economic Management Network. It is part of a larger effort by the World Bank to provide open access to its research and make a contribution to development policy discussions around the world. Policy Research Working Papers are also posted on the Web at http://
econ.worldbank.org. The author may be contacted at Eghani@worldbank.org.
incumbent businesses within a district-industry predicts a greater share of subsequent entrepreneurs will be female.
Moreover, higher female ownership of local businesses in related industries (similar labor needs, input-output markets) predicts greater relative female entry rates.
Gender networks thus clearly matter for women’s economic participation. However, there is a need to develop a better understanding of how gender networks influence aggregate efficiency. There is no doubt that gender empowerment can be the escalator to realizing human potential and for creating a robust platform for growth and job creation.
What Explains Big Gender Disparities in India? Local Industrial Structures and Female Entrepreneurship
Ejaz Ghani, William R. Kerr and Stephen D. O’Connell
Keywords: Female, gender, entrepreneurship, agglomeration, cluster, business networks, development, India, South Asia.
JEL Classification: J16, L10, L26, L60, L80, M13, O10, R00, R10, R12
Author institutions and contact details: Ghani: World Bank,Eghani@worldbank.org;
Kerr: Harvard University, Bank of Finland, and NBER,wkerr@hbs.edu; O’Connell: World Bank and CUNY Graduate Center, soconnell@gc.cuny.edu.
Acknowledgments: We thank Muhamad Amin, Mehtabul Azam, Maria Correia, Meera Chatterjee, Rajeev Dehejia, Arti Grover, Debasree Das Gupta, Lakshmi Iyer, Henry Jewell, PratapBhanu Mehta, Reema Nanavaty, and Jennifer Solotaroff for helpful comments on this work. We thank the World Bank's South Asia Labor Flagship team for providing the primary datasets used in this paper. We are particularly indebted to Shanthi Nataraj for sharing her wisdom regarding the industrial survey data. Funding for this project was provided by World Bank and Multi-Donor Trade Trust Fund. The views expressed here are those of the authors and not of any institution they may be associated with.
2 Introduction
A central driver of economic growth over the past century has been the increased role of women. This growth in the role of women comes in many forms: increased female labor force participation generally,reduced discrimination and wage differentials that encourage greater effort, improved advancement practicesthatpromote talented women into leadership and managerial roles, and similar. Simply put, empowering half of the potential workforce has significant economic benefits beyond promoting gender equality (Duflo 2005, World Bank 2012). This growth stimulus is particularly true for female entrepreneurship and the economic dynamics that entrepreneurship promotes. Yet, as Klapper and Parker (2011) review, we are still just beginning to identify the local business and social factors that unlock female
entrepreneurship.
This paper usesdetailed micro-data on the unorganized manufacturing and services sectors of India in 2000-2005 to explore the spatial factors that promote female entrepreneurship and business ownership. The micro-data are a representative sample of the Indian economy, and the establishment records identify the gender of the owner for proprietary establishments (which account for greater than 95% of establishments). For most surveys, we can also identify
establishments that are new entrants. From these micro-data, we develop relative rates of female entrepreneurship and business ownership at the district-industry-year level.
The central focus of our paper is on identifying and quantifying the importance of existing female business networks for promoting subsequent entrepreneurship among women.
We primarily evaluate these local conditions using conditional estimations that include industry- year and district-year effects. These estimations isolate variations inincumbent industrial
conditions by district-industry-year. We prepare measures of the overall incumbent female business ownership in the district-industry and indices of how favorable the district’s broader industrial structure is to new entrants in terms of typical agglomeration factors: the suitability of local labor markets and the strength of input-output markets for buying and selling goods. These indices link measures of how related two industries are on these two dimensions with the relative presence of industries in each district.
Our estimations emphasize that favorable incumbent industrial conditions increase the subsequent relative rate of female entrepreneurship and business ownership in a district-industry.
We further calculate the indices separately using male-owned incumbents and female-owned incumbents. This separation strongly emphasizes that higher relative rates of female
entrepreneurship closely follow upon industrial structures with existing female-owned businesses. While we do not observe direct economic exchanges among businesses with our data, these patterns are consistent with hypotheses of the importance of existing business
3
networks for promoting female entrepreneurs. We further confirm these results when instrumenting for current incumbent structures using lagged 1994 incumbent structures.
Our empirical methodology draws from the work on spatial determinants of
entrepreneurship in advanced economies, most often related to the manufacturing sector, that are reviewed later in this paper. In related work, Ghani et al. (2011c) and Mukim (2011) evaluate spatial factors that explain a high rate of entrepreneurship in a district-industry generally and irrespective of the owner’s gender. These earlier studies also contrast entry in the organized sector with that in the unorganized sector. Our current paper focuses instead on factors that explain higher female entrepreneurship shares independent of aggregate levels of entry. We also specifically focus here on the local industrial conditions of female-owned businesses. In
discussing these results, we identify central findings fromGhani et al. (2011c)and Mukim (2011) where appropriate.
In addition to the conditional estimations that provide the tightest econometric framework for our study, we also consider unconditional estimations that include industry-year effects only to identify general district-level attributes that correlate with high rates of female
entrepreneurship. These estimations emphasize several factors. First, relative rates of female entrepreneurship do not appear strongly linked to the district’s population or to the district- industry’s overall employment levels, although relative female entrepreneurship rates do decline with population density. More strikingly and relevant for policy makers, better local
infrastructure strongly connects with higher relative female entry in both manufacturing and services. Local education and the female literacy rate further matter for services entry. Stricter labor regulations are also associated with higher rates of female entry.
These findings are very important for Indian policy makers and business leaders. Despite many economic advancements since liberalization began, the role of women in the Indian economy still lags well behind that of advanced economies (e.g., Dunlop and Velkoff 1999, Mammen and Paxson 2000, Ghani 2010a, World Bank 2011). Cross-country data from the World Bank Entrepreneurship Snapshots find that India’s rate of entrepreneurship is lower than its stage of development would suggest; similarcomparisons also highlight that India’s gender ratio is lower than its peers. This dual under-performance has cultural and economic antecedents, but it is starting to change. Women are making economic gains in the Indian economy, and further progress represents a tremendous growth opportunity for the country.
This study contributes most directly to two literature strands. First, our work builds upon prior studies of gender differences in entrepreneurship. Parker (2009) and Klapper and Parker (2011) offer a comprehensive review of this literature and appropriate references. Our paper is among the first to study how spatial differences in gender ratios in entrepreneurship relate to local incumbent business structures. Existing research mostly employs cross-country studies of
4
gender ratios in entrepreneurship (e.g., Minniti 2010, Minniti and Naudé 2010), and we analyze very local determinants. Second, our paper contributes to a growing set of spatial studies on entrepreneurship in India (e.g., Khanna 2008, Ghani et al. 2011a,c, Mukim 2011) and a broader set of work on India’s industrial organization and economic performance.1 These contributions constitute an important input to the growing body of work on entrepreneurship and economic advancement in developing countries (e.g., Ardagna and Lusardi 2008, Schoar 2009, Klapper et al. 2009).
Beyond the few papers on the spatial determinants of entrepreneurship in India, the closest paper to our work is Rosenthal and Strange (2011). Rosenthal and Strange (2011) document within-metropolitan area sorting for female entrepreneurs in the United States. They show that a spatial mismatch exists for female entrepreneurs similar to that found earlier on racial lines. Our work has several key differences. First, Rosenthal and Strange (2011) focus on spatial differences within metropolitan areas (e.g., using one-mile rings around a business). Our Indian data only identify districts for firms, which are often larger than U.S.metropolitan areas.
Thus, we do not study sorting at the same spatial level. Second, and more generally, the contextual differences of the two countries are very stark. Rosenthal and Strange (2011), for example, consider automobile commuting patterns for U.S. entrepreneurs, whereas our focus will be on whether basic infrastructure like paved roads and electricity exist. Nonetheless, the two studies are connected in that they describe a link of past female business ownership in a spatial area with subsequent female entry. We hope that further research continues to refine our
understanding of this interface between incumbent conditions and gender ratios of new entrants.
The plan of this paper is as follows. Section 2 discusses our entrepreneurship data and spatial differences in femalebusiness ownershipacross India. Section 3 reviews the spatial determinants of entrepreneurshipand our metrics.Section 4 quantifies the spatial determinants of female entrepreneurship in manufacturing and services. Section 5 presents our instrumental variable specifications that use lagged incumbent conditions from 1994. The final section concludes.
Female Entrepreneurship Rates in India
We employ cross-sectional establishment-level surveys of manufacturing and services enterprises carried out by the Government of India. Our manufacturing data are taken from
1 For example, Lall et al. (2004), Lall and Mengistae (2005),Nataraj (2009), Kathuria et al. (2010), Hasan and Jandoc (2010), Dehejia and Panagariya (2010), Fernandes and Pakes (2010), Ghani (2010b), Fernandes and Sharma (2011), and Mukim and Nunnenkamp (2011).
5
surveys conducted in fiscal years 1994, 2000, and 2005. The services sector has only more recently been surveyed in fiscal years 2001 and 2006. In all cases, the survey was undertaken over two fiscal years (e.g., the 1994 survey was conducted during 1994-1995), but we will only refer to the initial year for simplicity. This section describes some key features of these data for our study, and we refer to readers to Ghani et al. (2011c) and its data appendix for greater details.For additional detail on the manufacturing survey data, we refer the reader to Nataraj (2009), Kathuria et al. (2010), and Hasan and Jandoc (2010). Dehejia and Panagariya (2010) provide a detailed overview of the services data and its important characteristics.
Our work considers portions of the Indian economy surveyed by the National Sample Survey Organisation (NSSO). This survey includes the essential questions on gender of the establishment owner that we describe shortly. Due to the nature of India’s data collection, the NSSO collects information on a representative sample of all services establishments and on a representative sample of the unorganized sector of manufacturing. Amanufacturing business is considered part of the unorganized sector if it has fewer than ten employees and uses electricity.
If the establishment does not use electricity, the threshold is 20 workers. The unorganized sector accounts for over 99% of Indian manufacturing establishments.2
For most of our estimations for the services sector, we mimic the unorganized nature of our manufacturing sample for comparability. We do this by classifying services establishments with fewer than five workers and/or those listed as an “own-account enterprise” (OAE) as the unorganized sector. OAE enterprises are firms that do not employ any hired worker on a regular basis. The choice of five employees as the size cutoff recognizes that average establishment size in services is significantly smaller than in manufacturing. Using this demarcation, the
unorganized sector makes up approximately 75% of total employment in both manufacturing and services. We also show below that our results for the services sector are very similarif we use the full sample of services firms.
Establishments are surveyed by the NSSO with state and four-digit National Industry Classification (NIC) stratification. We use the provided sample weights to construct population- level estimates. Much of our analysis employs district-industry variation. Districts are
administrative subdivisions of Indian states or territories that provide more meaningful local economic conditions. The male or female business ownership questions that we use are an outcome of the survey and not a factor in the stratification design.We have confirmed that our results hold at the state-industry level, for which the stratification was originally designed.
2Organized manufacturing establishments are not surveyed by the NSSO because they are instead surveyed by the Annual Survey of Industries (ASI). The ASI unfortunately does not collect the gender of the business owner.
Ghani et al. (2011b) describe the organized and unorganized sectors in greater detail.
6
The NSSO surveys the ownership type of each establishment. Establishments can be listed as male proprietary, female proprietary, other owned, cooperative, household partnership, multi-household partnership, private LLC, and unknown. We focus primarily on the
establishments listed as either male proprietary or female proprietary. These two groups constitute 98% of establishments in the informal manufacturing sector in 2000 and 2005 and 98% and 91% of establishments in services in 2001 and 2006, respectively.We use incumbent establishments defined as female proprietary to determine female business-ownership shares by district-industry. When developing local indices of broader local business conditions, described in the next section, we use all incumbent establishments.
Our analysis primarily considers female entrepreneurship. Our female entrepreneurs are a subset of the female business owners. We identify entrepreneurs using establishments that are classified as being less than three years old. Ghani et al. (2011a, c) describe this choice of how to measure entrepreneurship and our entry metrics in further detail. This young establishment distinction is unfortunately not collected for services establishments in 2006. As a consequence, we are limited to a cross-sectional analysis of female entrepreneurship rates for services in 2001, while we have much greater longitudinal flexibility in manufacturing. In addition, we define incumbent establishments to be those older than three years. We use this incumbent group, which is mutually exclusive from the entrants, in defining all of our incumbent industrial structures. In 2000, 14% of manufacturing establishments in our sample are young entrants, and the
comparable figure from 2001 for services is 20%.
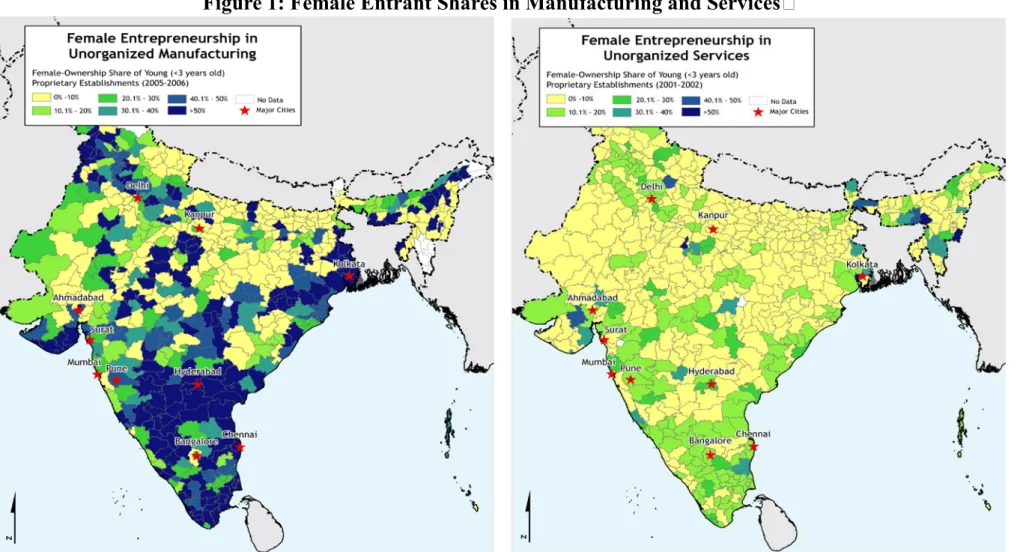
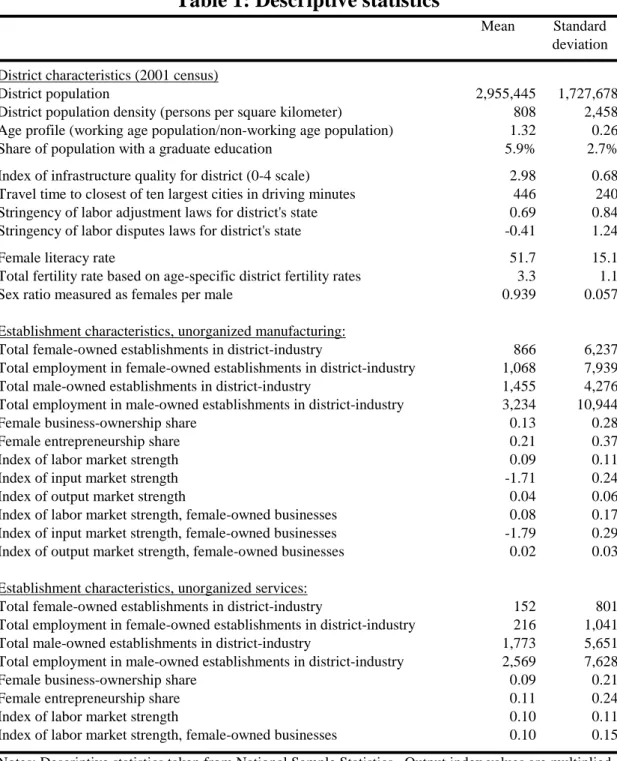
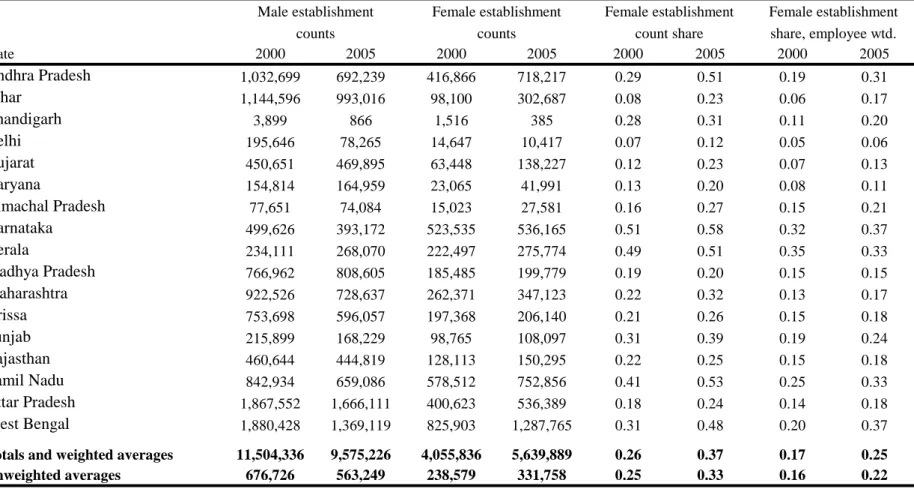
Table 1 provides broad descriptive statistics on our sample. Tables 2a and 2b list by state the gender traits of business owners3 in manufacturing and services establishments, respectively, in the 20 states of our sample. Figure 1 provides a visual presentation. These 20 states are a subset of the initial 35 states/union territories available. The 15 exclusions were due to three potential factors: 1) the state was not sampled across all of our surveys, 2) the small sample size for the state raised data quality concerns, or 3) persistent conflict and political turmoil existed in the region. Our explicit criteria with respect to size are that the district has a population of at least one million in the 2001 census and has 50 or more establishments sampled. The exclusions are minor in terms of economic activity, and the resulting panel accounts for over 90% of employment in both sectors throughout the period of study.
In Table 2a, relative female business-ownership rates in unorganized manufacturing are particularly high in Karnataka, Kerala, and Tamil Nandu. These states have an average female establishment ownership rate exceeding 45%. In contrast, low female ownership shares are evident in Delhi, Bihar, Haryana, and Gujarat. The average female business-ownership share
3Comparable entrepreneurship tables are available upon request. We document female business owner ratios in Tables 2a-3b so that the longitudinal pattern in services can be discussed.
7
increased from 26% in 2000 to 37% in 2005. On an employment-weighted basis, the rate increased from 17% to 25%. The female ownership rates across major cities have a distribution that is mostly similar to the distribution across states.
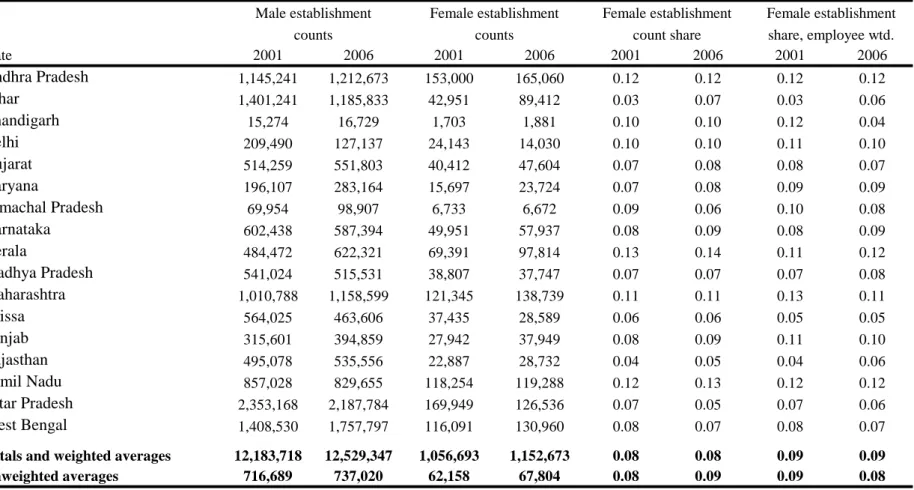
In Table 2b’s services analysis, states with the highest female ownership rates are Kerala, Tamil Nadu, and Andhra Pradesh, with average female ownership shares exceeding 12%. The lowest female ownership rates are in Rajasthan, Bihar, Orissa, and Uttar Pradesh, each with 6%
or less. The average female business-ownership share, with and without employment weights, was between 8% and 9% for 2001 and 2006. Female ownership rates in major cities tend to be higher than overall state averages in services. The correlation of state gender ratios between manufacturing and services is about 0.5 on a count basis and above 0.9 on an employment- weighted basis.
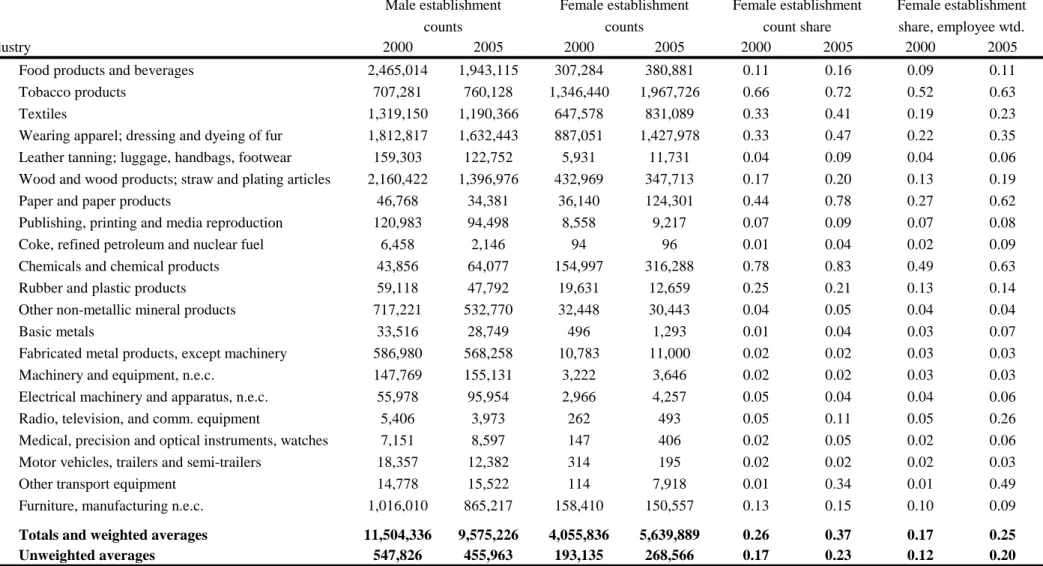
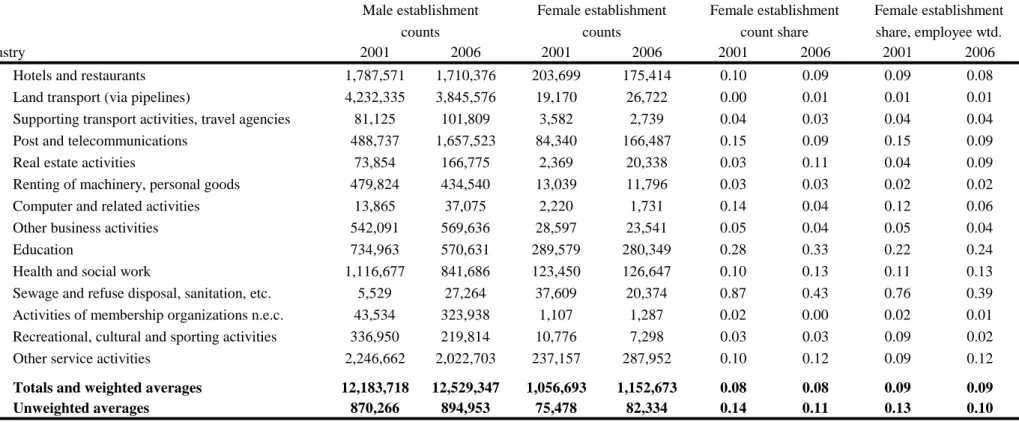
Tables 3a and 3b provide similar female business-ownership shares by two-digit NIC industry in manufacturing and services, respectively. Within manufacturing, female shares are highest and typically exceed 50% in industries related to chemicals and chemical products, tobacco products, and paper and paper products. At the opposite end, female shares of 2% or less are evident in industries related to computers, motor vehicles, fabricated metal products, and machinery and equipment. Among services industries, female ownership shares exceed 30% in industries related to sanitation and education. Industries related to research and development, water transport, and land transport have the lowest rates at 1% or less. Female-owned businesses are smaller in terms of employment than male-owned business in manufacturing, while they are larger in services.
Spatial Determinants of Female Entrepreneurship
We now describe the spatial factors that we relate to female entrepreneurship patterns.
We first identify general district traits that can influence the gender ratio of business owners. We then construct indices of local industrial conditions for a specific district-industry.
District-Level Conditions
Our initial explanatory measures naturally focus on basic traits of the district: population levels (and its square), population density, age profile, and average education levels. Given our interest on gender balance, we also include the district’s female literacy rate, total fertility rate, and sex ratio. These traits are important as entrepreneurs tend to start their businesses in their current local area and are even disproportionately found in their region of birth (e.g., Figueiredo et al. 2002, Michelacci and Silva 2007,Dahl and Sorenson 2007). These controls will pick up this
8
supply-side effect.The measures are developed using the 2001 population census, and Table 1 provides descriptive statistics.
Our population control captures the size of the local consumer market, which can be especially important for services businesses, and the overall level of surrounding economic activity (e.g., general availability of workers).Ghani et al. (2011c) find higher entry levels partially correlate with greater population, but we do not have a theoretical reason to suspect population influences the gender balance after controlling for other district attributes. Population density again reflects some measure of local market size, but it also goes beyond to consider the competition for local resources (e.g., higher land rents). Ghani et al. (2011c) find population density reduces organized manufacturing entry, as has been shown in other contexts, but that it is not systematically related to entrepreneurship in the unorganized sectors that we study here. With respect to gender ratios for entrepreneurs, the work of Rosenthal and Strange (2011) on sorting in the United States suggests that the female entrepreneurial share may be declining in density.
We model the district’s age structure asthe ratio of working age population to non- working age population. This ratio is sometimes called the demographic dividend in the Indian context.While some work finds age structure matters for entry rates (e.g., Evans and Leighton 1989, Bönte et al. 2009, Glaeser and Kerr 2009), this fact has not been established for India. The general education of the workforce has been linked to higher entry in India (e.g., Ghani et al.
2011c) and the United States (e.g., Doms et al. 2010, Glaeser et al. 2010), and Amin and Mattoo (2008) further study human capital in the Indian context. It is not clear, however, if general education should influence the gender balance of entrepreneurs. We measure the general
education level of a district by the percentage of adults with a graduate (post-secondary) degree.
Our results below are robust to alternatively defining a district’s education as the percentage of adults with higher secondary education.
We next consider three traits specific to female advancement that areemphasized by prior studies.4The first is the female literacy rate. Given the general link established between
education and entrepreneurship, we anticipate a higher literacy rate will correlate with higher relative female entrepreneurship. The second is the total fertility rate measured as a composite of age-specific fertility rates in the district. This does not have clear prediction. The third factor is the sex ratio measured as the number of females per male in the district. We anticipate this to have a positive effect for raising female entry rates relative to male entry rates.
4 Dhaliwal (2000), Mitra (2002), Ghosh and Cheruvalath (2007), Amin (2010), Field et al. (2010), and Pillania et al. (2010) study India in particular. Verheul et al. (2006), Bruhn (2009), Estrin and Mickiewicz (2009), Kobeissi (2010), and Klapper and Parker (2011) provide international evidence.
9
One notable omission from this list is the district’s profile in terms of scheduled tribe and caste populations. Iyer et al. (2011) show that castes and tribes vary in their overall rates of entrepreneurship, and castes and tribes also differ in their social norms on the appropriate role of women. Unreported tests analyze whether including these profiles influenced the gender results presented below. These inclusions are not important in our context when also controlling for intermediate variables like the female literacy rate, and so we adopt the more parsimonious specification that is also more easily comparable in the future to other contexts outside of India.
We believe, nonetheless, that the role of these social norms is important for future research with respect to female participation in the Indian economy.
Beyond these basic demographics, we consider threeadditional local traits that may affect female entrepreneurship: quality of local physical infrastructure, travel time to one of India’s ten biggest cities, and stringency of a state’s labor laws. While these traits do not constitute an exhaustive list of local conditions, they are motivated by the literatures on entrepreneurship and India’s development.
Basic infrastructure services like electricity are essential for all businesses, but new entrants and the informal sector can be particularly dependent upon local infrastructure (e.g., established firms are better able to provision their own electricity if need be). Aghion et al.
(2011) provide a theoretical model of this dependency, and Ghani et al. (2011c) and Mukim (2011) find that infrastructure strongly links to overall entrepreneurship levels in India. Lall (2007) links infrastructure investments to regional growth in India. The population census provides figures on the number of villages in a district which have telecommunications access, electricity access, paved roads, and access to safe drinking water. We calculate the percentage of villages that have infrastructure access within a district and sum across the four measures to create a continuous composite metric of infrastructure which ranges from zero (no infrastructure access) to four (full access to all four infrastructure components).5
India’s economy is undergoing dramatic structural changes (Desmet et al. 2011). From a starting point in the 1980s when the government used licensing to promote industrial location in regions that were not developing as quickly, the economic geography of India has been in flux as firms and new entrants shift spatially (e.g., Chari 2008, Fernandes and Sharma 2011). One feature for a district that is important in this transformation is its link to major cities. We thus include a measure from Lall et al. (2011) of the driving time from the central node of a district to
5In six districts (major cities) which were not further subdivided into separate geographic units, these indicators were not reported in the Census data. In these cases we assign the infrastructure access components as 100%. Our results are robust to excluding these major cities from the analysis sample.
10
the nearest of India’s ten largest cities6 as a measure of physical connectivity and across-district infrastructure. This is calculated based on data on India’s road networks using GIS software.
Finally, we model local labor regulations using state-level variation in policies. Several studies link labor regulations in Indian states to economic progress (Besley and Burgess 2004, Aghion et al. 2008), and Ghani et al. (2011c) finds labor regulations suppress Indian
entrepreneurship generally. Our measure is taken from Ahsan and Pages (2007), who break down the labor regulations index proposed by Besley and Burgess (2004) into separate components affecting labor adjustment and labor disputes legislation. Using these separate measures, we create a composite labor regulations index by state.
Agglomeration Theories
The above factors are district-level phenomena, and a useful first exercise is to relate the female entrepreneurship ratio to these factors. The focus of our study, however, is on the local industrial conditions of district-industries and how they shape female entrepreneurship. We develop metrics that unite the incumbent industrial structures of cities with the extent to which industries interact through the traditional agglomeration rationales first defined by Marshall (1920). Duranton and Puga (2004) and Rosenthal and Strange (2004) review the subsequent literature in detail. Prior work emphasizes the importance of these conditions for explaining overall entry rates,7 but this work does not explore the impact of favorable local conditions on the gender balance of entrepreneurs.
We also want to explore the importance of whether the gender profile of the incumbent industrial structure affects the gender profile of new entrants. The role of business networks among women in developing countries is frequently mentioned by development economists, but we are not aware of any prior work that systematically considers female businessownership across regions and industries in multiple economic sectors. For simplicity, we describe our metrics below in a generic language that discusses district-industry employment. Our empirical
6These are Ahmedabad, Bangalore, Bhubaneshwar, Chennai, Delhi, Guwahati, Hyderabad, Kolkata, Mumbai, and Patna.
7This conceptual approach is used to describe location choice decisions and city structures by Glaeser and Kerr (2009) for the United States, Jofre-Monseny et al. (2011) for Spain, Dauth (2011) for Germany, and Ghani et al. (2011c) and Mukim (2011) for India. Alcacer and Chung (2010) and Mukim and Nunnenkamp (2011) use this framework to consider foreign direct investment decisions.Deichmann et al. (2008) review a broader literature on location choice in developing countries. Industry linkages for agglomeration are more broadly considered by Henderson (2003), Ellison et al. (2010), Delgado et al. (2010), and Helsley and Strange (2010).Greve and Salaff (2003) review social networks and entrepreneurship. A broad and related literature considers network formation in developing economies. Examples of recent work include Khwaja et al. (2005), Bandiera and Raul (2006), Krishnan and Sciubba (2009), and Conley and Udry (2010).
11
work, however, focuses on metrics that use female-owned, incumbent businesses to determine labor market resources for new entrants.
In all of our estimations, we control in some format for the size of the incumbent district- industry employment. This is important given that entrepreneurs often leave incumbent firms to start their companies. Klepper (2010) shows in detail the importance of this spawning process in the history of Detroit and Silicon Valley, and many econometric studies find the existing
business landscape the most important factor for the spatial location of new entrants (e.g., Glaeser and Kerr 2009). We model both the totalemployment in incumbent firms for the district- industry and the count of female-owned incumbent businesses specifically.
The first agglomeration rationale is that proximity to customers and suppliers reduces transportation costs and thereby increases productivity (e.g., Fujita et al. 1999). To test the importance of this mechanism within the manufacturing sector, we measure the extent to which districts contain potential customers and suppliers for a new entrepreneur. We begin with an input-output table for India developed by India’s Central Statistical Organization. We define Inputi←k as the share of industry i's inputs that come from industry k, and Outputi→k as the share of industry i's outputs that go to industry k. These measures run from zero (no input or output purchasing relationship exists) to one (full dependency on the paired industry). These shares are calculated relative to all input-output flows and are not symmetrical by design
(Inputi←k≠Inputk→i, Inputi←k≠Outputk→i).
We summarize the quality of a district d in terms of its input flows for an industry i as Inputdi = - ∑k=1,...,Iabs(Inputi←k – Edk/Ed), where I indexes industries. This measure simply
aggregates absolute deviations between the proportions of industrial inputs required by industry i and district d's actual industrial composition, with E representing employment among incumbent firms. The measure is mostly orthogonal to district size, which we separately consider, and a negative value is taken so that the metric ranges between negative two (i.e., no inputs available in the local market) and zero (i.e., all inputs are available in the local market in precise
proportions). The construction of Inputdi assumes that firms have limited ability to substitute across material inputs in their production processes.8
8The input metric is not perfectly orthogonal to district size to the degree to which larger districts have more independent economic zones than smaller districts. Thus, even if the very localized input conditions within a small and large district are similar for a start-up, the measured quality of input conditions will be less in the larger district as the input metric will sum over more economic zones. We thank Juan Alcacer for pointing this out.
Chinitz (1961) emphasizes that average size of local suppliers is an important factor for entrepreneurship beyond general supplier market suitability. A number of empirical studies find support in local start-up conditions:
Drucker and Feser (2007), Glaeser and Kerr (2009, 2011), Rosenthal and Strange (2010), Glaeser et al. (2010), and Ghani et al. (2011c). We do not examine the Chinitz effect in the unorganized sector context because the definition of an unorganized establishment in India is based upon establishment size.
12
To capture the relative strength of output relationships, we also define a consolidated metric Outputdi = ∑k=1,...,IEdk/Ed∙Outputi→k. This metric multiplies the national share of industry i's output sales that go to industry k with the fraction of industry k's employment in district d. By summing across industries, we take a weighted average of the strength of local industrial sales opportunities for industry i in the focal market d. This Outputdi measure takes on higher values with greater sales opportunities. Unlike our input measure, this output metric pools across industries that normally purchase goods from industry i. By measuring the aggregate strength of industrial sales opportunities in district d, the metric assumes that selling to one large industrial market is the same as selling smaller amounts to multiple industries.
For most of our estimations, we employ a combined input-output market strength
measured as Input-Outputdi = mean(Inputdi, Outputdi). We take the mean value after transforming both Inputdi and Outputdi to have zero mean and unit standard deviation. Our use of a
consolidated metric is primarily motivated by the instrumental-variable specifications that use the 1994 incumbent conditions. The consolidated metric reduces the number of endogenous regressors that we need to simultaneously instrument for. We find similar results to those reported below when instead considering the max values over Inputdi and Outputdi.
Beyond material inputs, labor is perhaps the most important input into any new firm, and entrepreneurship is quite likely to be driven by the availability of a suitable labor force (e.g., Combes and Duranton 2006). While a district’s education and basic demographics are
informative about the suitability of the local labor force, these aggregate traits can miss the very specialized nature of many occupations. As an extreme example, Zucker et al. (1998) describe the exceptional embodiment of human capital in specialized workers in the emergence of the US biotech industry. These specialized workers are often tightly clustered together.9
We unfortunately lack Indian data to model direct occupational flows, so we instead take a very simple approach. Greenstone et al. (2010) calculate from the Current Population Survey the rate at which workers move between industries in the United States. Using their measure of labor similarity for two industries, we define Labordi=∑k=1,...,IEdk/Ed∙Mobilityi←k. This metric is a weighted average of the labor similarity of industries to the focal industry i, with the weights being each industry’s share of employment in the local district. The metric is again by
construction mostly orthogonal to city size. We calculate this connection for both manufacturing and services.
9 Theories to explain the agglomeration of specialized workers and firms include Marshall (1920), Diamond and Simon (1990), Helsley and Strange (1990), Krugman (1991), Rotemberg and Saloner (2000), and Overman and Puga (2010).
13
These metrics condense large and diverse industrial structures for cities into manageable statistics of local industrial conditions. The metrics do have limitations, though. First, we do not capture potential interactions that exist beyond the local district, but factor and product markets can be wider (e.g., Rosenthal and Strange 2001, Kerr and Kominers 2010). Second, the metrics do not consider final consumers. In unconditional estimates, we separately model city
populations and gender ratios. Third, the metrics do not measure quality differences across districts in inputs like worker or input quality beyond basic traits like education levels. Finally, these metrics can suffer from omitted variable biases should another district-industry factor jointly determine both incumbent structures and entry rates. We will use lagged industrial conditions as instruments to partially address this concern.10
Analysis of Relative Female Entrepreneurship Rates
We first characterize relative female entrepreneurship rates through a series of
unconditional linear regressions with the above determinants as explanatory variables. Table 4 considers the 2000 and 2005 manufacturing surveys using a specification of the form:
Female Entry%dit= ηit+ β∙Xd+ γ∙Zdit+ εdit.
The outcome variable Female Entry%dit is the ratio of female-run youngestablishments in the district-industry-year to the sum of female- and male-run young establishments. This outcome variable is the most intuitive, and we focus on a share outcome that is independent of the overall level of entrepreneurship in the district-industry. We find similar results when using variants like the log female share or examining the log levels of female entrepreneurshipdirectly. We exclude district-industries where we do not observe entry.11
While presenting results for female entrepreneurship ratios, we find very comparable patterns when examining female business-ownership ratios. We focus on the entrepreneurship rates since we can exclude entrepreneurs from the incumbent structures and directly circumvent
10 There are several factors that we do not consider in this study: natural cost advantages (e.g., Ellison and Glaeser 1999), local industrial diversity (Jacobs 1970), knowledge flows (Marshall 1920, Porter 1990), and entrepreneurial culture (Hofstede 2001, Florida 2005). These exclusions are in part due to data constraints for India and in part due to our desire to maintain a consistent empirical framework between manufacturing and services.
11We also exclude in the manufacturing estimates the district-industries that are not present in 1994. This is done to keep a consistent sample size between the least squares and instrumental variable specifications. We find very similar results when using the full sample of potential district-industries where entry occurs.
14
some endogeneity concerns that would exist with overall business-ownership rates. We return to the endogeneity issue after reviewing our base results.
We include in each estimation a vector of industry-year fixed effects ηitthat control for fixed differences in industry sizes, entrepreneurship rates, competition, and so on within each survey. These industry-year fixed effects also control for aggregate gender balances exhibited in Tables 3a and 3b. The vectorXdincludes district traits like population and education levels. These traits are measured in 2001 and do not vary over our sample period. Finally, Zditis a vector of incumbent employment levels and agglomeration metrics that vary by district-industry-year and are calculated using incumbent establishments only. We transform explanatory variables that do not have a logarithm scale to have unit standard deviation to aid interpretation, and we cluster standard errors by district to reflect the multiple mappings of some variables.
We weight estimations by an interaction of log industry size with log district population.
We place more faith in weighted estimations than unweighted estimations since many district- industry observations are very small and experience very limited entry. We recognize, however, that weighted estimations may accentuate endogeneity concerns. We thus employ our interaction of aggregate district and industry size rather than observed district-industry size. The interaction minimizes any endogeneity in highly agglomerated district-industries, especially in conditional estimations with district and industry fixed effects. We find very similar effects without sample weights, indicating that these choices are not very material.
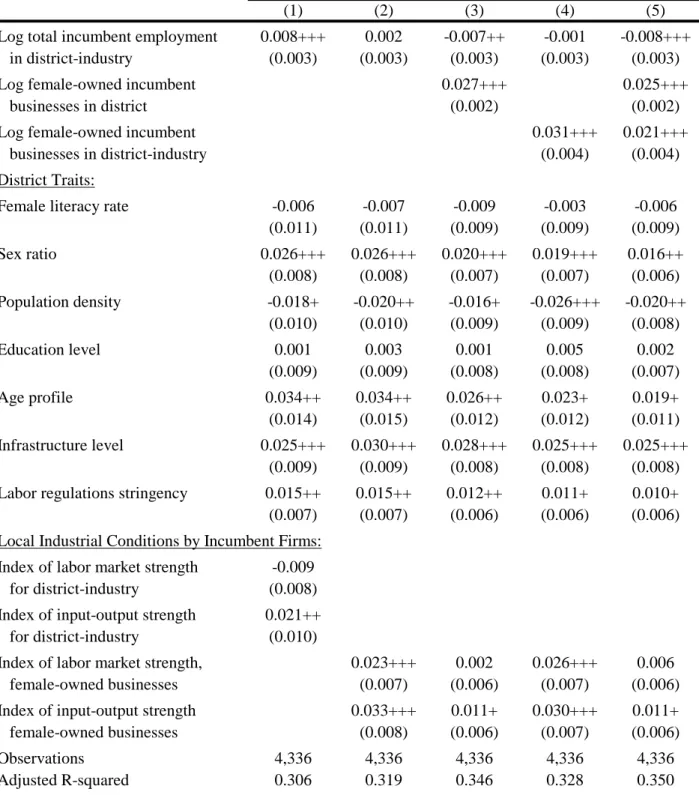
Table 4 provides our basic spatial results for manufacturing, before conditioning with district-year fixed effects. All regressions control for log total incumbent employment in the district-industry at the time of the survey and our basic district-level traits Xd. In terms of the agglomeration variables Zdit, Column 3 further controls for log female incumbent business- ownership counts in the district as a whole, Column 4 controls for log female incumbent
business-ownership counts in the focal district-industry, and Column 5 controls for both of these measures. At the bottom of the table, the first estimation considers general Marshallian
connections defined over all incumbent firms in the district, while Columns 2-5 use industrial conditions defined over female incumbent firms specifically.
Beginning with Column 1, without controlling for female-specific agglomeration levels, a district-industry with more incumbent employment has a greater female entry share. Among general district traits, four factors are associated with a higher female entrepreneurship share in unorganized manufacturing: a higher female-to-male sex ratio, an age profile emphasizing working ages, better quality infrastructure, and more stringent labor regulations. The relative entry rate, on the other hand, is lower in places with high population density. Education levels and female literacy rates are not associated with greater entry shares in manufacturing. The regressions also include unreported controls for log district population and its square, total
15
fertility rate, and travel time to one of the ten biggest cities in India. None of these variables are economically or statistically significant. Finally, strong input-output conditions in the district for the industry studied are linked to higher female entry ratios.
The predictive powers of these basic district traits do not vary much across the five columns as we adjust the agglomeration metrics. Among the basic district traits, the
infrastructure correlation is the most prominent and policy relevant. Ghani et al. (2011c) and Mukim (2011) link higher quality infrastructure to greater entry rates in India. The finding that better infrastructure is associated with greater shares of female entry in particular is new.Lack of access to certain types of infrastructure services (transport, access to water, and sanitation) seem to affect women more than men, perhaps because womenoften bear a larger share of the time and responsibility for household maintenance and care activities. It is notable that while the within- district infrastructure quality is prominent, the strength of linkages across cities is not found to influence the gender balance.
Unreported specifications that disaggregate the infrastructure index stress that transport infrastructure and paved roads within villages are especially important. There may be several factors behind thewithin-district association. In terms of transport infrastructure, travel in India can be limited, dangerous, and unpredictable, and women face greater constraints in geographic mobility imposed by safety concerns and/or social norms. Areas with better transport
infrastructure may alleviate one of the major constraints to female entrepreneurs in accessing markets. In addition, better electricity and water access may reduce the burden of women in providing essential household inputs for their families and allow for more time to be directed toward entrepreneurial activities.
The positive association for stringent labor regulations is interesting as well. Several studies find that strict labor regulations suppress Indian entrepreneurship generally, especially in the formal sector. One channel through which these regulations could affect the gender balance of entrepreneurs is by shifting activity into industries that female entrepreneurs tend to be more involved in (Klapper and Parker 2011). While our industry fixed effects capture broad
movements of this type, there may be subtler shifts at further levels of industry disaggregation that we do not observe. More intriguing, labor constraints in the organized sector may also shift the occupational decisions of men and women within the family. We do not investigate this further, given that the focus of our paper is on the networks evident in local industrial structures, but the partial correlation is worthy of additional research.
Turning to the agglomeration metrics, the association of higher female entry shares to greater total incumbent employment in the first row disappears in Column 2 once we control for local conditions provided by incumbent female-owned businesses. These incumbent conditions suggest that female connections in labor markets or input-output markets both contribute to a
16
higher entry share. These agglomeration indices are normalized to have unit standard deviation.
Thus, a one-standard deviation increase in either of these incumbent conditions correlates with a 2%-3% increase in the share of new entrants that are female. This compares to a base female entry ratio of 21%. There exists an important connection of past female business-ownership to future female entry rates.
In Column 3-5, we add measures of the log count of incumbent female-owned businesses in the district and in the focal district-industry. These agglomeration levels again connect to higher relative entry rates for female entrepreneurs. A 10% increase in either measure, holding everything else constant, correlates with a 0.2%-0.3% increase in the female entry share.
Controlling for the overall size of incumbent female-owned businesses in the focal district- industry does not affect the Marshallian linkages at the bottom of the table. On the other hand, controlling for the log count of the district’s total incumbent female-owned businesses naturally reduces the Marshallian metrics, especially the labor market conditions. Across the columns of Table 4, the adjusted R-Squared value increases from 0.31 to 0.35.
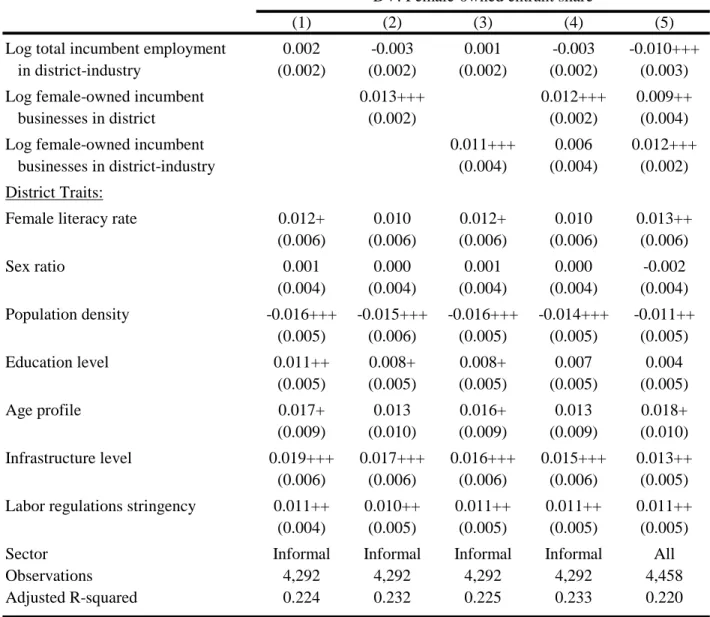
Table 5 considers a similar set of estimations with the services sector, although we do not model Marshallian linkages for the services sector.In Table 7, we present conditional estimations for the services sector that includes labor market indices. These results show a positive labor spillover effect from incumbent female business ownership, but this benefit operates mostly through incumbent female businesses in the focal industry. We thus present here the more parsimonious specification. We do not consider input-output conditions for the services sector given the difficulty developing accurate input-output connections among services businesses.
There are some key similarities in Table 5 to Table 4: infrastructure quality, labor
regulation stringency, and age profiles again predict higher female entry shares, while population density is associated with a lower rate. Somewhat surprisingly, the association of a higher female entry ratio to a greater female sex ratio in the district that was present for manufacturing is not present for services. On the other hand, the female literacy rate and general education levels are more predictive.This link may be due to the services sector bring more skill intensive than the manufacturing sector in India (Ghani, 2010).The first four columns are for the unorganized sector, while the last column repeats the full specification with the complete services sample, finding similar results.
Examining the agglomeration metrics, the total size of the district-industry is not a factor for gender ratios in services. On the other hand, higher log counts of female-owned incumbent businesses in the district and district-industry again predict a greater female share. The
coefficients are about half of their size in manufacturing, which we further confirm below in conditional estimations. As the overall female entrepreneurship share in services is lower than in manufacturing, at 11% versus 21% across the district-industry sample, this suggests that the
17
effects are roughly similar in terms of proportions. The explanatory power of the estimations is slightly lower with an adjusted R-squared value of about 0.22.
Tables 6 and 7 next consider conditional estimations of the form:
Female Entry%dit = πdt+ηit+ γ∙Zdit+ εdit.
We now include a vector of district-year fixed effects πdtthat controls for differences across districts that are common for all industries. Specifications thus employ within variation: how much of the unexplained district-industry variation in female entrepreneurship can we explain through local conditions that are especially suitable for particular industries? We no longer include the vector Xd of district-level traits as they are controlled for by the district fixed effects.
To reflect the change in focus, we cluster standard errors by district-industry. Table 6 considers the manufacturing sample, and Table 7 considers services.
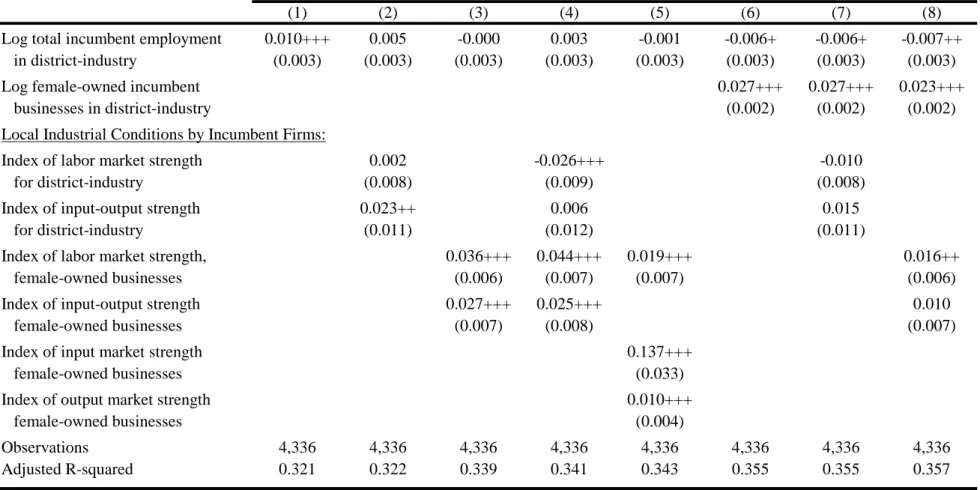
The conditional results in Table 6 confirm the earlier unconditional results in a more precise manner. We continue to find an important link between the log count of incumbent female businesses in a district-industry and the subsequent gender ratio for entrants, even after controlling for industry-year fixed effects, district-year fixed effects, and the total size of the district-industry by year. Marshallian linkages across industries from incumbent female-owned businesses are also present, and they persist when controlling for total Marshallian linkages.
These inter-industry links become less powerful once controlling for the female incumbent count in the focal district-industry.
In most of our estimations, we use a combined input-output metric to model local conditions. We combine these metrics in anticipation of our upcoming instrumental variable estimations, where the combined average metric has less measurement error and is easier to identify in 1994 industrial conditions. In Column5 of Table 6, we separate the input and output metrics. The input metric is the stronger of the two, both in terms of economic significance and statistical significance. This importance of the input metric also holds when controlling for the log female incumbent business count in the focal district-industry.
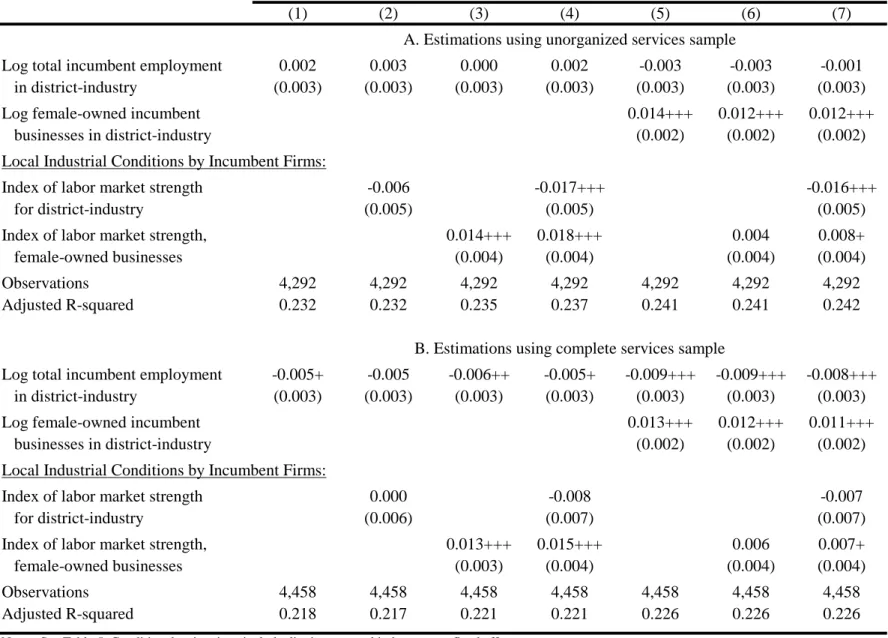
Table 7 analyzes the conditional estimates for the services sector. We again find a strong link from past district-industry female incumbent businesses to the gender ratio of subsequent entrants. The elasticity in Column 5 of Table 7 is again about half of that evident in Column 5 of Table 6. Given that the female entrant share is about twice as big in manufacturing as in services, this suggests that the two agglomeration effects are roughly comparable in relative terms. A similar pattern is evident in the total services sample. Finally, similar to manufacturing, we find evidence for Marshallian labor market connections being important. This connection operates more through the incumbent presence within the industry in question for services.
18
The patterns in Tables 4-7 are robust to many specification variants in addition to the variations described above when outlining our data and empirical strategy. One important test is that we find similar results when restricting to district-industries that have more than 50,000 employees, suggesting these outcomes are not sensitive to small sample sizes of female and male establishments.As another robustness check on our metric design, we find similar results when winsorizing our metrics at their 5% and 95% levels to weaken the influence of extreme values.
Instrumental Variable Analysis Using 1994 Incumbent Structures
Our final analysis turns to the question of identification. Our analysis thus far takes the incumbent industrial structures as exogenous to predict the gender ratio of new entrants. There are several potential issues with this approach. First, reverse causality may be present, where the anticipation of many female entrants encourages females in the prior period to own businesses to link to the new firms. Second, omitted variable biases may be present. Our use of conditional estimations with district-year and industry-year fixed effects would require that such omitted factors exist at the district-industry level. An example would be a very inspirational female business leader in the district-industry that encourages both past and future women in the district to engage in firm ownership. Finally, measurement error likely exists that biases downward our estimates of the importance of incumbent industrial structures. This measurement error could be due to the sampled micro-data (vs. a census of local businesses) or incomplete metrics for how industries interact.
To analyze these challenges, we instrument in Tables 8 and 9 for incumbent industrial conditions in 2000 and 2005 using the industrial conditions that existed in 1994 in the
manufacturing sector. The earliest year for which the female ownership question was asked is 1994. These data are only collected for the manufacturing sector.
Returning to the challenges facing the least squares estimates, the 1994 incumbent industrial conditions and the role of women are more exogenous to the entry conditions in 2000 and 2005 than the contemporaneous incumbent conditions. To the extent that reverse causality persisted, the anticipation of future entry would need to span about a decade in duration.
Fernandes and Sharma (2011) discuss how the spatial locations of manufacturing firms in India’s formal sector have adjusted substantially since the large-scale deregulations of the 1980s and 1990s. Prior to these deregulations, spatial location decisions for firms were set to a large degree by the government with the goal to promote general equality across regions. By reaching as far back into this regulated period as possible, we hopefully capture incumbent conditions that are not being determined by anticipation of female entry conditions after 2000.
19
For the omitted variable bias concern, the instrument partially helps.The instrument overcomes concerns of a special condition that emerged in a particular district-industry that favored female ownership (e.g., the inspirational female business leader, a favorable local government treatment) if such omitted factor is short-term in duration. That is, the instrument addresses omitted factors that are localized to the 2000-2005 period and do not extend back to the early 1990s. To the extent that an omitted factor was very long in duration and specific to a district-industry (e.g., a local women’s training institute that is specific to an industry), then the instrumental variable approach will not help if the factor was present in 1994 too.
Finally, the instrumental variables will help overcome measurement error in the
agglomeration regressors. This measurement error is due to the sampled nature of our data and the imperfect design of our metrics. The instrumental variables can help relieve the standard downward bias in coefficient values that measurement error produces. On a related note, the instrumental variables approach can further help with potential concerns about measuring our entry rates and incumbent conditions from the same surveys, given that we do not observe the universe of Indian firms. The data split that we use of young firms and incumbents has been used by multiple researchers on India, and we have not identified any sampling biases in this
approach. Nonetheless, the instrument variables approach will identify off of conditions from the 1994 survey to predict entry in 2000 and 2005.
Table 8 provides the first-stage results. The first two columns provide the first-stage results where we instrument for just the total incumbent employment in the district-industry and the count of female-owned incumbent firms in the district-industry. Columns 3-6 are the first- stages from an extended specification where we also include the two Marshallian indices. The construction of the Marshallian indices in 1994 mirrors that in the later surveys. The lagged conditions strongly predict the incumbent conditions in 2000 and 2005, with the strongest elasticity for each agglomeration metric being its direct counterpart in 1994.
Table 9 reports the second-stage outcomes. Column 1 presents results from just instrumenting for the total incumbent employment in the district-industry and the count of female-owned incumbent firms in the district-industry. The results confirm an important role for female-owned incumbent businesses in encouraging female entrepreneurs. The elasticity of 0.063 is about twice the least squares magnitude of 0.027 estimated in Column 6 of Table 6.
Column 2 presents the results from just instrumenting for the total incumbent
employment in the district-industry and the two Marshallian indices. The first-stage results for this estimation are similar to those reported in Table 8. We again find evidence for important interactions through both channels. The instrumented elasticities are again about twice the magnitude of those estimated in Column 3 of Table 6.The labor market channel is statistically