November 21, 2008
Document of the World Bank
Report No. 44612-IN India Orissa in Transition
Report No. 44612-IN
India
Orissa in Transition
Challenges for 2006–2010
Poverty Reduction and Economic Management India Country Management Unit
South Asia Region
Public Disclosure AuthorizedPublic Disclosure AuthorizedPublic Disclosure AuthorizedPublic Disclosure Authorized
Team and Acknawledgements
This Economic Report was prepared by a team l e d by V.J Ravishankar. Individual chapters were contributed by Deepak K. Mishra (economic growth), Marina Wes (fiscal turnaround), Clive G. Harris (infrastructure), Lant Pritchett (human development), and V i k r a m M e n o n (accountability for service delivery). Other staff who contributed are: Manivannan Pathy (agriculture), Varsha Marathe (investment climate), Srikumar Tadimalla (power and PPPs), Nupur Gupta (transport), Deepak Ahluwalia and Prabir Joardar (irrigation), &chard Clifford and Smita Misra (urban), Sangeeta Goyal (education), Peter Berman (health), Philip O’Keefe and Md. Ihsan A j w a d (social protection), Maitreyi Das (social impact and benefit sharing), Elena Glinskaya (poverty and employment trends), Pooja Churamani (economic and fiscal data ana1ysis)kta Soni and Shiny Jaison (document production). The w o r k was camed out under the overall direction and management o f Sadiq Ahmed (former Director, SASPR), Fayez Omar (SACIA), and K a p i l Kapoor (former manager SASPR). The team i s particularly grateful f o r valuable formal peer review comments from Professor Suresh Tendulkar (external), M o n a Haddad (EASPR) and Sanjay Kathuria (ECSPE).
The Report could not have been prepared without the close cooperation o f the Government o f Orissa (GOO), including and especially Ajit Kumar Tripathy, chief secretary; R. N. Bohidar, development commissioner; Subas Pani, former chief secretary; U. Sarat Chandran, former principal secretary, finance;
B. K. Patnaik, principal secretary to c h e f minister and department o f public enterprises; R. N. Senapati, principal secretary, finance; Chinmoy Basu, former principal secretary, health; R. V. Singh, special secretary, planning and coordination; K. C. Badu, former special secretary, finance; N. C. Vasudevan, former principal secretary, housing and urban development, and presently principal secretary, science and technology; S. N. Tripathi, secretary, rural development and information technology; Madhur Sarangi, principal secretary, cooperation; I. Srinivas, former secretary, industries; S. P. Nanda, former principal secretary, forest and environment, and presently a p c u l t u r e production commissioner; H. S.
Chahar, former principal secretary, agriculture, and presently principal secretary, forest and environment;
A. K. Tripathy, former secretary, energy, and presently secretary, tourism; M o n a Sharma, secretary, women and child development; R. K. Sharma, secretary, food supply and consumer welfare; Raja Lakshmi, former principal secretary, science and technology; G. C. Nanda, former director, vigilance; D.
K. Dey, former secretary, works; A. K. Meena, managing director, IDCO, Nitin Chandra, former special secretary, general administration department; V.Tyagarajan, ex-inspector general, vigilance, L.N. Gupta, ex-secretary, steel and mines, G.V.V Sharma, secretary, revenue and disaster management, S.C. Patnaik, secretary, school and mass education, K.C. Mohanty, director, panchayati raj and B.C. Mohapatra, additional secretary, finance. The Team i s grateful to Dr. S a k i Padhi, Director, Naba Krushna Choudhury Centre for Development Studies and representatives o f c i v i l society, nongovernmental organizations, academics and private sector firms in Onssa with w h o m wide range o f consultations were undertaken.
The report has been discussed with the Government o f India but does not necessarily bear their approval for all i t s contents, especially where the Bank has stated i t s judgments/opinions/policy recommendations.
Table: of Contents
QVERYIEW
...
iCHAPTER 1: FRQMANAAEWICPAST TO A DYNAMICFUTURE..
...
14A . Onssa’s Long-Term Growth Prospects ... 15
B . The Implications for Poverty and Human Development 19 C . Sustaining the Growth Momentum ... 23
D . Conclusions ... 27
... CHAPTER 2: THE FISCAL TURNAROUND
...
28A . Fiscal Consolidation ... 29
B . Reforms in Tax Policy and Administration ... 31
C . Expenditure Restructuring ... 34
D . E . Public Expenditure and Financial Management ... 38
Debt Restructuring ... 37
CXHPTm 3: ADDRESSING THE INFRASTRUCTURE GAP
... ...
e...
+.... ...
41B . Power ... 43
C . h g a t i o n ... 46
D . Urban Infrastructure ... 47
E . Public-Private Partnerships 50 A . Transport ... 42
... CHAPTER 4: ADDRESSING HUMAN DEVELOPMENT NEEDS
... .... ...
53A . Basic Education ... 53
B . S l u l l Development ... 58
C . Health ... 59
D . Social Protection ... 63
E . Conclusions ... 66
CHAPTER 5: ACCOUNTABIUTY FOR SERVICE DEUVERY
...
67A . Policy Makers and Service Providers ... 67
B . Service Providers and the Public ... 70
C . Conclusions ... 72
CHAPTER 6: CONCLUSIONS FOR PRIORZTY SETTING AND SEQUENCING
...
73Figure A: Industry has led the accelerated growth in Orissa since 2003 ... 3
Figure B: Rural poverty has declined faster in Onssa than in a l l o f India since 2000 ... 4
Figure C: Among Onssa’s rural population. middle- and higher-income groups prospered ... 5
Figure D: Orissa achieved the strongest fiscal correction among India’s states in 2000-06 ... 6
Figure 1 . 1 : Economic growth i s broad based and faster than the national average ... 14
Figure 1 . 2: Orissa’s share in national output has moved to a higher growth ... 16
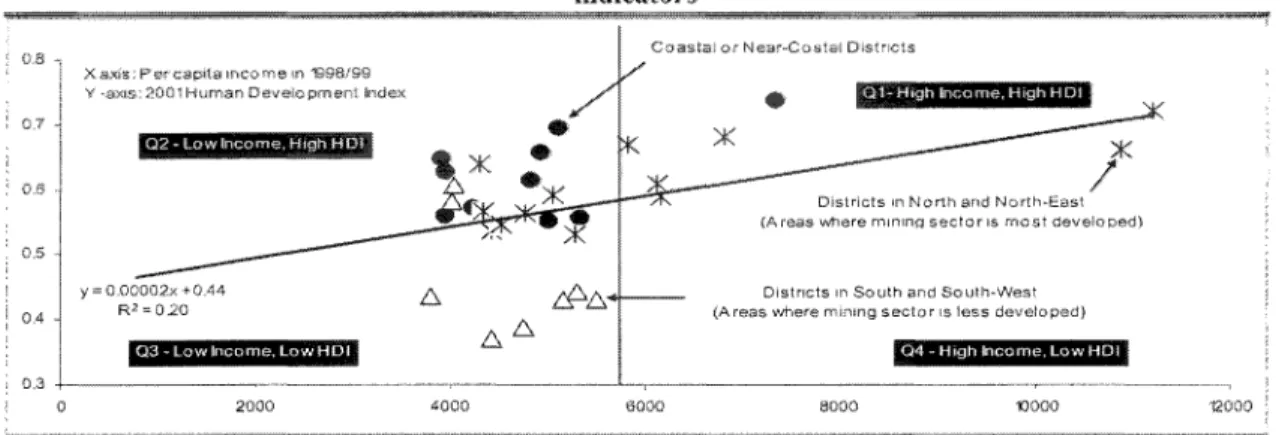
Figure 1 . 3: Orissa had poorly exploited i t s geographical advantages in the past ... 17
Figure 1 . 4: Past policies l e d t o expansion o f the mining sector but little industrialization ... 17
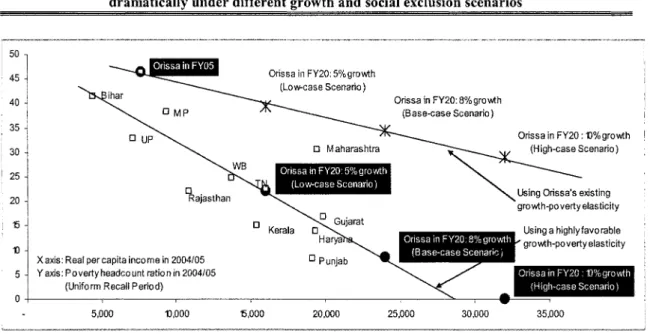
Figure 1 . 5: Onssa’s regions vary markedly in their percapita income ... 2 1 Figure 1 . 6 : Orissa’s poverty headcount ratio, compared with other Indian states ... 23
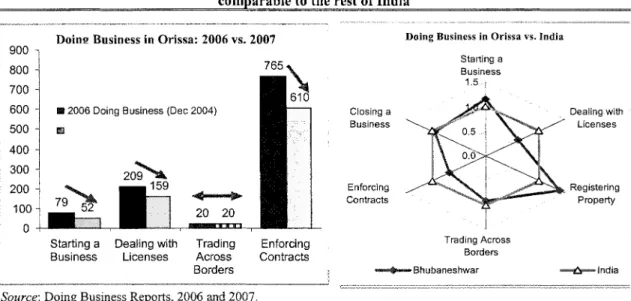
Figure 1 . 7: The cost o f doing business in Onssa has declined over time ... 24
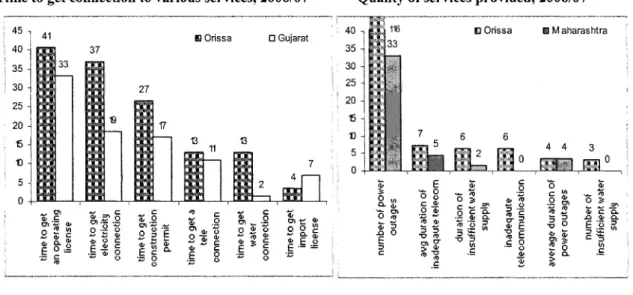
Figure 1 . 8: Orissa continues to lag behind states with better investment climates ... 25
Figure 1 . 9: A typical agricultural supply chain in Onssa i s highly fragmented ... 26
Figure 2 . 1: Fiscal corrections were higher in Orissa than in any other Indian state in 1999-2006 ... 29
Figure 2 . 2: Onssa has made large and consistent fiscal corrections ... 30
Figure 2 . 3: Onssa i s the only state with significant contribution from a l l three sources ... 31
Figure 2 . 4: Onssa’s own tax revenues have r i s e n from a wide variety o f sources ... 32
Figure 2 . 5: Significant fiscal savings have come from containing the public sector salary bill ... 35
Figure 2 . 6: Orissa’s debt i s becoming sustainable as i t declines in relation t o revenue ... 38
Figure 3 . 1: Urban households in Onssa have poorer access t o tap water ... 48
Figure 4 . 1 : Students in Onssa test far behind those in other countries ... 54
Figure 4 . 2: The vast majority o f youth in Onssa do not reach the standard ... 55
Figure 4 . 3: Thousands o f students in Orissa are able to meet ... 56
Figure 4 . 4: Students from many kmds o f schools in Onssa show only modest gains ... 56
Figure 4 . 5: Reducing the gaps ... 57
Figure 4 . 6: Private training institutions in Orissa ... 59
Figure 4 . 7: Onssa’s households are vulnerable t o a wide variety ofrisks ... 65
List
of
TablesTable 1. 1: Selected Human Development Outcomes in Onssa, 1992/93-2005/06 ... 20
Table 2. 1: Contributions to Fiscal Correction in Orissa, 1999/2000- 2007/08 ... 30
Table 2. 2: Debt Swapped by the Government o f Orissa, 2002/03-2006/07 ... 37
Table 3. 1: K e y Infrastructure Indicators for Orissa and All India ... 41
Table 3. 2: Rural Road Connectivity in Onssa, by Village Population ... 42
Table 3. 3: Percentage o f Households with Access to Electricity ... 44
Table 3. 4: Aggregate Technical and Commercial Losses and Annual Growth o f Sales ... 44
Table 3. 5: Public-Private Partnership Projects in Onssa, by Stage o f Development ... 50
Table 4. 1: School Drop-out Rates, 2004-05 ... 55
Table 4. 2: Inputs and Outputs in Public Health System, 2005-06 ... 60
Table 4. 3: Poverty Headcount Index in Regions o f Orissa, by Social Group, 1999-2000 ... 64
Table 4. 4: Household reported PDS off-take as share o f officially reported,2003/2004 ... 65
Table 4. 5 : Average Spending o n Poor Households by Antipoverty Programs ... .66
Table 6. 1: Possible Sequencing o f Reforms and Investments, 2007-17 ... 74
Table A. 1 : Gross State Domestic Product o f Orissa at Current Pnces, by Sector, 2000-07 ... i
Table A. 2: Gross State Domestic Product o f Onssa at Constant Pnces, by Sector, 1999- ... ii
Table A. 3 : Incidence o f Poverty in Orissa and All-India, 1993/94-2004/05 ... 111 ...
Table B. 1: Fiscal Summary for Onssa, 1999/00-2007/08 ... i v Table B. 2: Fiscal Summary for Onssa, 1999/00-2007/08 (as % o f GSDP) ... v
Table B. 3: Debt and Guarantees as a Share o f Revenue in Indian States, ... vi
Table B. 4: Own Tax Revenues in Onssa, by Source, 2000/01-2005/06 ... vi
Table C. 1 : Village Electrification in India, by State, as o f M a r c h 2006 ... vii
Table C. 2: Index o f Social and Economic Infrastructure in India, by State ... viii
Table C. 3: Road Density in India, by State, 1971-72 to 1996-97 ... i x Table D. 1: K e y Indicators o f Human Development in Orissa, 2005-06 ... x
Table D. 2: Human Development Index for India, by State ... x i Table D. 3: Coping Strategies Adopted by Households, by Type o f Risk and Income Group ... xii
Table D. 4: Awareness o f Antipoverty Programs, by Selected Groups and States ... xiii
Table D. 5: Proportion o f Households Benefiting from Antipoverty Programs in Orissa and All-India ... xiv
List
ofBoxes
Box 1. 1 : The Changing Onya Society: Views o f Two Generations ... 18
Box 2. 1 : Administrative Reforms in Orissa’s Commercial Tax Department ... 33
Box 2. 2: Treasury Computerization ... 39
Box 4. 1 : The Framework for Understanding Child Mortality: Actors and Actions ... ..62
Box 4. 2: Seven Strategic Thrusts of the Onssa Health Sector Plan ... 62
Box 5. 1 : Transforming the Way in which Citizens Perceive the State ... .69
Box 5. 2 : Information Technology Solutions for Better Accountability ... 70
ANNEX A: ECOIYOIWC GROWTHAW PO VERTX....
...
iGMv%xB: FISCAL, PQSJTIiXX
...
iiiANNEX C: INFRASTRUCTURE
...
viANNEX D: HUMAN DE lrELQPMEM
...
ixReferences.,
...
xi1..
OVERVIEW
1. Since 2000 Orissa, a seriously lagging state in the nineties, has become a state in transition. Rapid economic growth, spurred by investment in metal industries, has had a multiplier effect throughout the economy. Opportunities for nonagricultural self-employment, as w e l l as wage employment, have expanded. A remarkable fiscal turnaround, achieved through the state’s own efforts and complemented by performance-linked support f r o m the central government and external donors, has created space for developmental initiatives and high-priority public investments by the Government o f Orissa (GOO). Although agnculture has performed below its potential, growing at the same rate as in rest o f India, there are some welcome signs o f diversification and dynamism in various parts o f the state, pointing to large potential for further growth.
2. Change has given rise to hopes as well as anxiety. The acceleration o f Orissa’s economic growth to a rate faster than the rest o f India during 2002-07 brings hope that the state m a y at last be able to catch up with the rest o f the country. Expectations o f the younger generation have begun to change. A recent survey o f high school children in the capital city o f Bhubaneswar revealed that only one in seven looked forward to a career in public service, compared with one in every t w o in their parents’ generation. Nonetheless, a nagging concern remains about whether the poor and hitherto excluded, such as the scheduled tribes (STs) (22 percent o f the population and 40 percent o f the poor) who l i v e in remote villages located in hilly terrain, will gain or lose from the market-driven growth process. Will those w h o l i v e in the mineral-rich districts benefit adequately f r o m mineral-based industrial growth? Orissa’s growing c i v i l society movement has already voiced i t s concern o n such issues. The necessity and urgency o f addressing the inclusion agenda has been highlighted by recent controversies over land acquisition for industries. I t has prompted the Onssa government t o adopt a consultative process steered by a Group o f Ministers, before undertaking a progressive resettlement and rehabilitation policy.
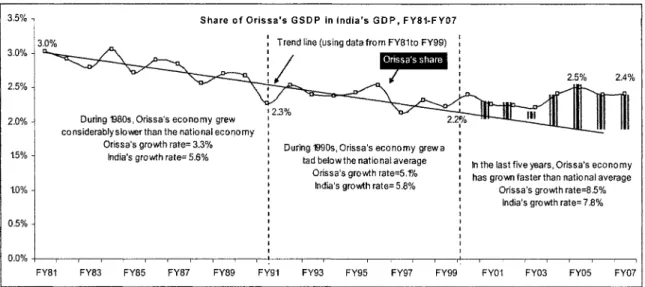
3. Several inequalities have begun to narrow, while some remain key outstanding challenges. The gap between Onssa and the rest o f India in per-capita income narrowed during 2000-06, after having widened during the past five decades. Regional inequalities within Onssa have also narrowed between 1999/2000 and 2004/05, according to latest available National Sample Survey (NSS) data o n household consumption expenditures. A wide cross-section o f the population, including scheduled castes (SCs), has gained f r o m the expansion in income-earning opportunities since 2000. However, the poorest 40 percent o f the population has gained m u c h less than the better-off 60 percent, most o f the scheduled tribes are part o f this poorest 40 percent and continue to lag behind.
4. Compared with the fiscal stress and liquidity crisis that prevailed in 1999/2000, the fiscal outcomes achieved as o f 2006/07 present a remarkable success to build on. That Orissa was headed for a fiscal crisis was k n o w n in the late 1990s, which ended with the heavy impact o f the pay hike awarded to government employees-raising the ratio o f salaries, pensions, and interest payments to above 100 percent o f total revenue. The policy stance o f the government o f Ollssa changed after the election in 2000 o f the present incumbent government headed by Shri Naveen Patnaik. The government issued a white paper in 2001 o n the pathetic condition o f the state’s finances and signed a memorandum o f understanding (MoU) with the Government o f India (GoI) to undertake fiscal r e f o m measures. The state government built up public acceptance and government ownership o f the fiscal reform program through a consultative and transparent process. Over the past seven years, the primary fiscal balance has been converted from a deficit o f 5.9 percent o f gross state domestic prices t o a surplus o f 2.8 percent-a correction by 8.7 percentage points, stronger than in any other Indian state.
‘
5 . Fiscal turnaround and economic acceleration have assisted and contributed to one another. The reforms began with the necessity for fiscal correction. However, such a strong fiscal correction would not have been possible without the acceleration o f market-oriented growth. Without employment and livelihood opportunities expanding in the private sector, the Orissa government would n o t have been able to win public support and move ahead with rightsizing the c i v i l service and retrenching employees o f public enterprises. N o r would revenue growth have been as buoyant as it has been since 2004105. In turn, fiscal reforms have contributed to economic growth by speeding up the completion o f capital investment projects, such as long- pending construction o f roads, bridges, and irrigation canals. The improved financial situation and the end o f liquidity constraints also enhanced the willingness o f private f i r m s and external donors to place their faith in Orissa’s future. For instance, the W o r l d Bank postponed approval o f a State Roads Project in 2002, due t o the acute fiscal stress, and i s n o w moving ahead toward approving a bigger version o f that project in 2008, as a result o f the fiscal turnaround.
6. National economic reforms have been important for Orissa, and in turn the success o f economic transition in Orissa has been important for inclusive growth in India as a whole. Orissa’s accelerated growth in private industrial investments has been triggered by the India-level reform that eliminated the freight equalization subsidy, a policy that had annulled the state’s comparative advantage as the location for metal industries. The private investment b o o m today i s l e d by metal industries, including Indian and international majors in steel, aluminium, and chrome products. Entry o f major Indian information technology companies into Orissa i s a spillover effect o f the rapid growth o f that sector at the all-India level, with the saturation o f Bangalore, Chennai, Hyderabad, and other preferred locations. In turn, the success o f accelerated economic growth and poverty reduction in Onssa has had an important demonstrative impact on the rest o f Eastern India and o n other poor repons and states in the country. Against the backdrop o f widening interstate disparities during the 1990s, catching up by one o f the poorest heralds a welcome change toward convergence among Indian states.
7. This Report assesses the ongoing transition in Orissa. I t examines h o w and why the successes were achieved. It attempts t o outline the dimensions o f the challenge ahead, as Onssa marches forward into the second phase o f policy and institutional reforms, building o n its improved fiscal position to deliver rapid and inclusive growth. I t highlights key issues and binding or soon-to-be binding constraints. The concluding section identifies priorities for public expenditure and public policy outcomes in the immediate, medium-term, and long-term future.
8. T h e Report i s intended as a contribution to the public debate and consultation initiated b y Government o f Orissa on the state’s long-term vision and development strategy until 2020. The first two chapters focus respectively o n economic growth performance and fiscal performance during the past 5-6 years. The subsequent three chapters focus respectively o n key aspects o f the outstanding challenge facing the state, namely: infrastructure, human development, and public accountability for service delivery. The final chapter summarizes the main findings and recommendations and poses considerations about priorities and sequencing.
A. Growth a n d Poverty Reduction since 2000
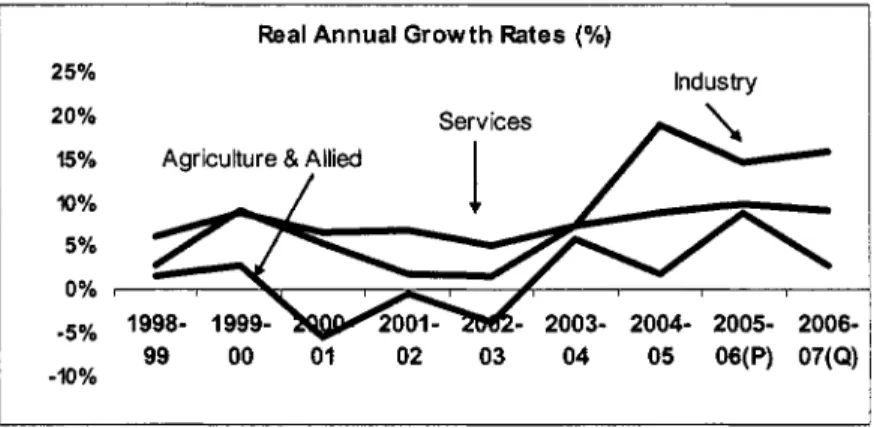
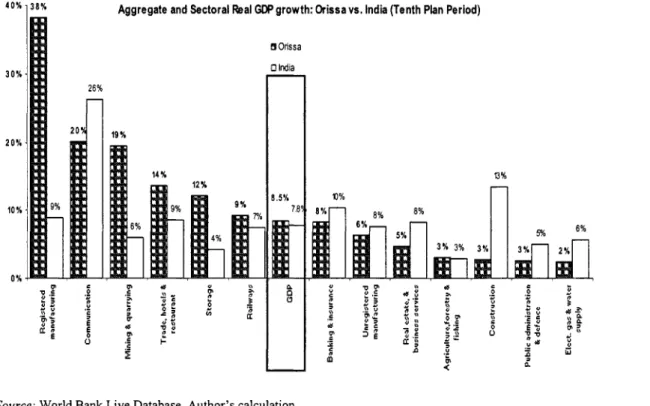
9. Accelerated growth since 2000 has been broadly based and more robust than seems to be generally perceived. The general perception in the Indian media seems to be that the economic b o o m in Orissa i s narrowly focused o n the mining sector. Facts show otherwise.
According to the updated official data o n gross state domestic prices, growth during 2002103- 2006/07, the period o f the Tenth Five-Year Plan, has averaged 8.5 percent annually as compared to 7.8 percent for India as a whole. Industry has grown at around 15 percent in Orissa compared to 9 percent in India as a whole. N o t only mining but manufacturing has grown faster than the rest o f the country, and so have trade and transport services. Agriculture recovered from a drought year in 2002103 and has grown at around 2 percent o n average, similar t o the rest o f
India. Private investments under implementation in Orissa are massive, at about US$125 billion, almost three times the annual gross state domestic prices. Double-digit growth o f the Orissa economy over the next decade or two i s clearly within the realm o f possibility, with annual growth during 2008-1 3 projected to be faster than 20 percent.
Figure A: Industry has led the accelerated growth in Orissa since 2003
Real Annual Growth Rates (%)
25% Industry
20%
-5% 1998- 1999-
-
2003- 2004- 2005- 2006- 99 00 01 02 03 04 05 06(P) 07(Q) -lo%Sources: Government o f India, Central Statistical Organization; Government of Onssa, Department of Planning and Coordination.
10. Income from agriculture, fisheries, and forestry, on which most poor depend, remains volatile and excessively dependent on rainfall. Sustaining a double-digt growth rate o f the state economy depends critically on the performance o f industry and services, while the inclusiveness or “pro-poor’’ quality o f economic growth depends a lot on the performance o f agnculture and other primary sectors. Reforms in land tenure and land administration are critical for raising agncultural productivity, while joint forest management i s a promising route to improve incomes from nontimber forest products. Effective investment and management practices in irrigation are also a high priority. Success o f participatory irrigation management, through the formation o f paani panchayats (PPs) (water user groups), backed by a state-level legal framework, holds significant promise for improving agricultural performance and diversification to higher-value added crops. Amendment o f the Agricultural Products Marketing Act has paved the way for expanding market access and economic returns to farmers from more competitive trading arrangements.
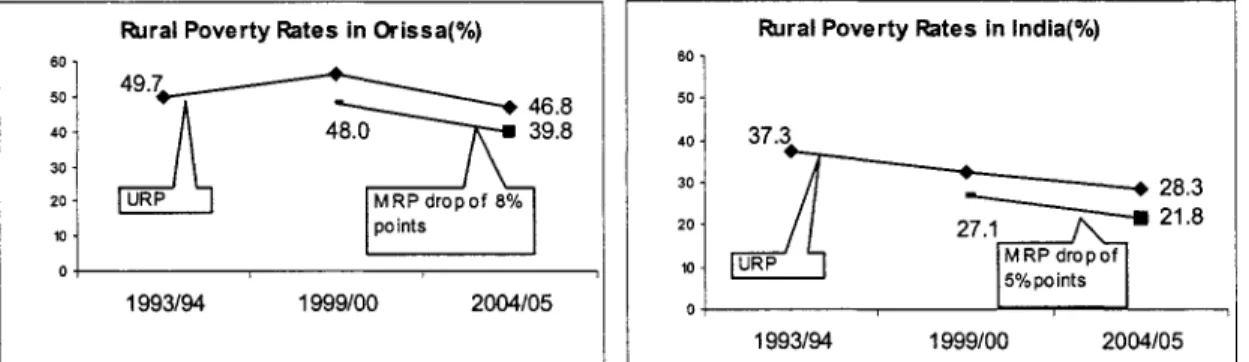
11. Poverty reduction has accelerated in Orissa since 2000 and has perhaps been more rapid during 2000-05 than in India as a whole. The data available from the National Sample Survey for 1993/94, 1999/2000, and 2004/05 suffer from lack o f comparability because o f the mixed reference periods (MRPs) used in 1999/2000. Estimates based on the “uniform reference period” (URP) indicate that declines in poverty over the past 10-12 years have been much less in Onssa than in India as a whole-with the rural poverty rate declining by less than three percentage points during 1993-2005 in Onssa, compared with nine percentage points overall in India. However, estimates based on the “mixed reference period” (MRP) suggest that the poverty headcount ratio declined by more than 8 percentage points in rural and 2.5 percentage points in urban Onssa during 2000-05, compared with 5 and 2 percentage points respectively in India as a whole. The two comparisons, put together (Figure B), suggest that Ori‘ssa’s performance has turned around from being much worse during 1993-99 to better than national average since 2000.
Subject to caveats about comparability o f the MRP between 1999/00 and 2004/05, the best available estimate i s that the number o f poor declined by about 1.5 million between these two years.
3
Figure B: Rural poverty has declined faster in Orissa than in all of India since 2000
60 -
50 .
40 - 30 - 20 -
10 .
Rural Poverty Rates in Orissa(%)
I I
points
- .
1993194 I999100 2004105
Rural Poverty Rates in India(%)
80 1 50 i
::
20
J - = = : : : :
10 0
M R P dropof B%points
1993194 1999100 2004105
Note: URP stands for uniform reference period which i s comparable for the years 1993194 and 2004/05; MRP stands for mixed reference period which i s comparable over the period 1999/00 and 2004/05.
Source: GoI, h e s s Information Bureau, New Delhi, March 21,2007 for 2004/2005 data and various National Planning Commission publications for the earlier data.
12. Regional income disparities within Orissa have narrowed during 2000-05.
Comparison o f household expenditure levels in 1999/2000 and in 2004/05 shows that per-capita expenditure increased faster in rural areas (by 12 percent over five years o r 2.3 percent annually), as compared with urban areas (by 4 percent over the period or 0.8 annually). In rural areas, the most rapid growth was recorded in the poorest Southern region where per-capita expenditure increased by 25 percent (4.6 percent annually), followed by the Coastal region (12 percent, or 2.3 percent annually), and then the Northern region (6 percent, or 1.2 percent annually). In urban areas, per-capita expenditure grew overall by only 4 percent over the five-year period. Regonal distribution o f urban expenditure moved in favor o f the Northern region, where per-capita expenditure grew by 14 percent (2.7 percent annually), spurred by mineral-based industrial growth and i t s multiplier effects.
13. While various disparities have narrowed, the scheduled tribes continue to lag behind. Those belonging to scheduled castes (SCs) experienced growth in real per-capita spending o f 7 percent during 2000-05, similar to the general population. However, growth in per- capita spending by the scheduled tribes (STs) lagged at only 2 percent over five years. The relatively impressive performance o f scheduled castes i s due to their gaining significantly from nonagncultural self-employment opportunities and experiencing rising agricultural wages as well.
Lagging o f scheduled tribes reflects the fact that geographical seclusion has limited their access to n e w self-employment opportunities, and as labor supply has remained abundant in the remote villages with negligible out-migration, agricultural wages for this group did not grow t o the same extent that they did for the scheduled castes.
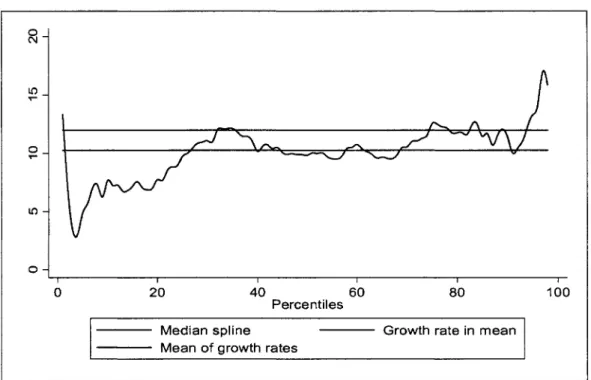
14. The lagging behind of scheduled tribes, who constitute 40 percent of the poor in Orissa, has led to some widening income disparities. Figure C presents the growth incidence curve for rural Orissa. It shows that a l l income categories o f the rural population gained in real terms from the accelerated economic growth, but those in the middle- and higher-income groups prospered more than those in the lowest-income group. Still, growth in this period was more inclusive than before, while it i s not as inclusive as i s desirable and necessary for rapid poverty reduction. In other words, even though the nonpoor have gained more than the poor, economic performance since 2000 has been far better than before 2000 in enabling people t o emerge from poverty.
Figure C: Among Orissa’s rural population, middle- and higher-income groups prospered more than the lowest-income group from the accelerated economic growth in 2000-05
0 C V -
In- r
z -
In-
0 -
h A .
. A
.
wA u -cv\”/
I I I I I I
ource: National Sample Survey data.
15. Achieving rapid and inclusive growth requires focusing on intrastate connectivity and on productivity and terms of trade gains in agriculture and forestry. Over 40 percent of a l l villages in the state are small and isolated, with less than 500 residents and n o all-weather connectivity with the rest o f the world. Around 85 percent o f the population o f Onssa lives in rural areas and hilly regions, dependent o n agnculture, fisheries and forestry. Productivity and terms o f trade are constrained by outdated land tenure legslation and land administration. A ban o n land leasing has g v e n rise t o widespread use o f illegal sharecropping arrangements, wherein farmers have n o recorded rights and hence n o access to institutional credit. Unsettled land ownership i s a problem in some areas. Another major challenge that the state government i s grappling with i s to reform forest management t o enhance the role o f the forest dwellers. The overriding challenge that Onssa faces i s t o ensure that rapid industrialization i s accompanied by improved intrastate transport and electric connectivity, alongside productivity and terms o f trade gains in agnculture and forestry through appropriate policy and institutional reforms. These are among the most essential conditions t o ensure that economic growth i s n o t only rapid but also inclusive.
16. Ease of entry for small and medium enterprises, with strengthened environmental due diligence, i s another important condition for broad-based, inclusive economic growth.
The current private investment b o o m i s dominated by large mega investments in steel and power.
Such mega investments will have a multiplier effect o n demand for a wide range o f goods and services, which small- and medium-scale enterprises (SMEs) can provide. For this multiplier effect to play out, the regulatory climate for SMEs must be improved. The easier i t i s for a small investor to enter the scene, the more such investments will take place in the state, and the larger will be the overall impact o n employment and poverty reduction. Hence the ongoing efforts o f the government to operationalize the “single window” clearance system at the district level, which i s
5
where S M E investment proposals are screened, assume special importance. Given the significant environmental externalities associated with mineral-based industries, there i s need to strengthen environmental institutions. Ongoing plans and current efforts o f the government toward strengthening the public consultation mechanisms as part o f environmental assessment will play a crucial role in determining the sustainability o f mineral sector investments in Orissa.
B. The Fiscal Turnaround
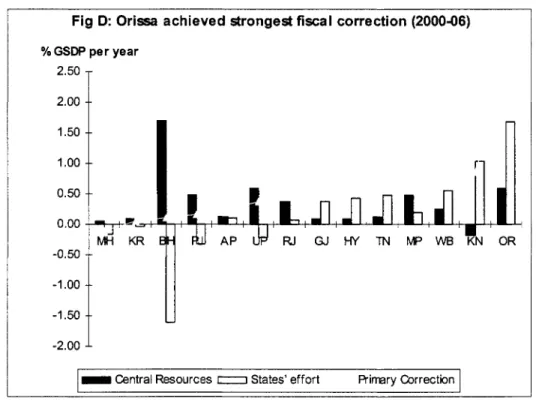
17. Orissa stands out among Indian states as a very poor state that achieved a very strong fiscal correction during 2000-06. Onssa’s fiscal stress was among the highest in India at the turn o f the century, as a result o f over-expansion o f government and public enterprise, with l o w returns financed in part by high-cost debt from the Government o f India. Salaries, pensions, and interest payments exhausted the state’s own revenues, as w e l l as central transfers. The fiscal crisis acted to galvanize reform momentum in Onssa, with policy-based external assistance playing a catalytic role, and political commitment ensuring continuity and persistence. Today, Orissa enjoys a primary fiscal surplus o f over 2 percent o f GSDP, and i t s interest-to-revenue ratio i s declining steadily toward 20 percent by 2010 from 40 percent some years ago. The ambitious targets o f the Orissa Fiscal Responsibility and Budget Management A c t have been met ahead o f time.
Figure D: Orissa achieved the strongest fiscal correction among India’s states in 2000-06
Fig D: Orissa achieved strongest fiscal correction (200046)
% GSDP per year
2.00 1.50
1 .oo I
I
0.00 -0.50 -1 .oo
-1.50
AP RJ GJ HY TN W W B K N OR
-2.00 1
I -
Central Resources o States’ effort R i m r y Correction1
18. Orissa i s the only Indian state where all sources o f fiscal correction have contributed significantly. The state’s own effort accounts for approximately 55 percent o f the fiscal correction between 1998-2000 and 2006/07, while increasing progressiveness o f central resource sharing accounts for 45 percent. If the period until 2005/06 i s considered, for which compiled data are available for all states, Onssa’s own effort accounts for 70 percent, much higher than other low-income states, where central transfers have contributed most to the fiscal correction
(Figure D). While the majority o f states have achieved an increase in their own revenues since 2000, hardly any state other than Orissa has gained significantly both from revenue enhancement and expenditure containment.
19. At least three important lessons emerge from Orissa’s fiscal success story. These are lessons not only for other states to gain from, but also for Orissa’s o w n foray into other areas o f politically difficult policy reforms.
20. First, the consultative approach adopted by the Government o f Orissa helped build public support for change. The government publicized the assessment o f a 1999 W o r l d B a n k Report that the state’s finances were o n an unsustainable path, and a major course correction was needed. The state leadershp built public opinion slowly but surely in favor o f shedding excess staff positions in the government establishment, and in favor o f separating employees o f loss- making state-owned enterprises through a voluntary retirement scheme (VRS). Extensive consultations were held o n the public enterprise reform program, with support f r o m the UK Department for International Development (DfID).
21. Second, political stability and the medium- to longer-term outlook o f the political leadership made it possible to sequence the reforms sensibly. In the first period, 2000-03, fiscal correction in Onssa was mainly based o n enhancing the state’s own revenues, which was politically less difficult than tackling the expenditure side. The correction grew stronger after the 2004 re-election, with significant expenditure containment and restructuring measures accompanying tax reforms. Acceleration o f economic growth and expansion o f employment opportunities in the private sector made it politically feasible for the Government o f Onssa to implement significant downsizing o f the public sector during 2004-06.
22. Third, Orissa’s experience shows how a crisis can be used to strengthen outcome orientation in government departments. The government used the tight resource position and constrained aggregate capital budget to emphasize the need for accelerating the rate o f project completion, so as t o deliver more with the same amount o f rupees. Within the given constrained resource envelope, the government launched an exercise called the Zero-Based Investment Review to maximize the number o f projects completed each year, through reallocation within the departmental budget. This was a highly successful effort to turn the focus o f departmental attention from outlays to outcomes. Completion o f long-pending roads and bridges became a visible quick win that strengthened public support for the reforms.
C . Addressing the Infrastructure Gap
23. Orissa must improve and expand infrastructure services to achieve rapid and inclusive economic growth. Ollssa has significant natural resource endowments and a strategic location with a coastline facing South East Asia. Without adequate road, rail, and port infrastructure, the economy cannot exploit its potential and sustain the rapid economic growth o f recent years. The strain o n transport infrastructure i s already evident. Capacity constraints in r a i l have diverted goods traffic to roads, which i s highly inefficient. Constraints in port capacity have diverted cargo to ports in other states. Continuation o f rapid industrial growth could further accentuate transport constraints in the coming years. Massive upgrading o f urban infrastructure i s needed to be able to attract and retain the slulled labor force demanded by modem industry and services.
24. The boom in industrial growth, while providing its own challenges, also provides opportunities for new partnerships with the private sector to provide infrastructure. Given the scarcity o f resources, public-private partnerships (PPP) could be developed as part o f a comprehensive master plan for upgrading infrastructure. The Government o f Orissa has prepared a public-private partnership policy and established a public-private partnership cell reporting to the Planning and Coordination Department. There i s a shelf o f 36 public-private partnership
7
projects at various stages o f preparation, including 9 road projects, 3 r a i l projects, 4 ports projects, 9 industrial projects , 6 urban projects and a f e w each in tourism, information technology, industry, and fisheries.
25. T h e Government o f Orissa needs to emphasize that public-private partnerships must b e pursued only where they represent value-for-money for the government. Translating this principle into practice would require strengthening the capacity o f the Finance Department to measure and report the state government’s financial support, including tax breaks, land grants, and contingent liabilities. Such costs need to b e factored into decision-maktng by line agencies.
26. Orissa faces some particular challenges o f exclusion linked to i t s geography and social structure. Tiny villages and remote habitations in the hills pose a very big challenge for achieving full transport connectivity. Electric connectivity i s also a major challenge, as rural electrification in Orissa i s among the lowest in the country. Electric connectivity can open up possibilities for e-services, including medical consultations for patients in remote areas. Rural transport connectivity and rural electrification need t o be identified as high-priority claims o n the additional fiscal space being created in the state. Given that (a) about 52 percent o f villages in the state are too small to qualify f o r the central grant-financed rural roads program, and (b) Onssa i s yet to receive the promised grant funds from the center for rural electrification, the state may consider allocating a rising share o f it s o w n capital budget resources to address these critical gaps.
27. Access t o electricity in Orissa i s well below national levels. W h i l e the richest quintile has nearly universal access, access falls o f f rapidly, with only 18 percent o f the poorest two deciles having electricity, compared with 38 percent in a l l o f India. The Government o f Orissa could look at the potential for innovative approaches for rural electrification, including franchises and cooperatives for service delivery. Some countries have also established umbrella organizations-such as the Rural Electrification Board in Bangladesh and the National Rural Electric Cooperative Association in the United States-to effectively dispense subsidies as w e l l as quality advice o n technical, human resources, and financial management matters t o numerous small, scattered entities engaged in service delivery
28. Lessons f r o m the lackluster experience with privatization o f power distribution.
Onssa led the way in power sector reforms in India, but these reforms have not delivered the desired results. Power distribution continues to b e plagued by high aggregate technical and commercial losses. Why has the actual outcome been much poorer than what was targeted through the reform program? The main reason lies in the lack o f competitive pressure and adequate incentives to aggressively go after efficiency improvements and reduction o f losses due to power theft. The Onssa Electricity Regulatory Commission (OERC) attempted to create a multiyear tariff framework in 2005, which was aimed at creating incentives for the distribution companies to reduce losses and keep some o f the gains. W h i l e conceptually a sound approach, this attempt was undermined in practice by what the companies perceived as an ungenerous starting revenue allowance and the appointment by the commission o f administrators for day-to- day management o f the distribution companies.
29. The Orissa Electricity Regulatory Commission could consider developing new multiyear tariffs on the basis o f realistic business plans. There appears to b e merit in re- launching this strategy by approving fresh long-term, say, five-year business plans, at least for the three distribution companies where the private ownership (and management) i s back in control.
This re-launching has to include a starting point and targets that are realistic and incentives large enough t o induce the distribution companies to improve their performance in the most pressing areas o f concern, namely overall technical and commercial losses, distribution losses, and arrears o f receivables. To make such an incentive system robust and credible, Onssa Electricity Regulatory Commission w o u l d need to simultaneously enhance its o w n capabilities to
independently monitor and verify progress, as w e l l as the claims o f the distribution companies in each o f the critical areas targeted for improvement.
30. Urban areas are also critical to Orissa's future development. Although Orissa has one o f India's lowest levels o f urbanization (15 percent o f the state population o f 37 million), urban centers are growing at a rapid rate from this low base. The urban population in Onssa i s currently growing at about twice the rate o f overall population in the state. The demand for urban water supply and sewerage services i s likely t o increase manyfold as a result o f recent increase in private sector investment in steel and other metals, as w e l l as tourism and information technology services. Sound state and local finances, land use planning, housing, service delivery models, and regulatory frameworks are needed to meet the needs o f the growing manufacturing and service industries and the urban population.
3 1. Filling the infrastructure gaps requires a combination o f additional state funding, partnering with private investors, and lobbying effectively with the center. Some components o f the infrastructure investment agenda require significant additional state resources, such as transport connectivity. Some others require Onssa t o play an enabling role for private providers t o operate, with little or n o commitment from the state budget. Y e t others, like r a i l connectivity, require only effective lobbying by the state government with the central authorities.
While there i s likely t o be a fair amount o f private interest in developing port facilities, the Onssa government will need to address the overall strategic direction and a conducive regulatory framework for the port sector.
32. Not funds but implementation capacity could become a binding constraint for infrastructure investment. Expanding fiscal space and potential private participation could together meet the rising infrastructure financing needs, but construction capacity i s currently laclung to b e able t o spend efficiently o n infrastructure investment. Out o f Rs.31.6 b i l l i o n o f central grant funds allocated during 2000-07 for rural roads in Onssa, the state was able to utilize roughly Rs.14 billion, or less than half. Rejection rates o f the executed works by the national quality-monitoring cell have been as high as 25 percent, indicating that rural engineering capacity has been overstretched. Onssa could consider relying more o n national and international players in the state highways and major roads segments, thereby freeing up more o f the state's own capacity to address the lower-level connecting roads and rural roads.
D. Addressing Human Development Needs
33. Sustaining rapid and inclusive growth in Orissa depends on the quality of the labor force it can produce. Raising the quality o f Orissa's labor force requires imparting strong educational fundamentals in the schooling system from the earliest years, supplemented by some public and mostly private efforts in training and s l u l l development. The health system i s also crucial, both t o provide a healthy foundation for productivity and to avoid health shocks that leave households in poverty. While social protection and antipoverty schemes may seem peripheral to the growth process (and have been treated that way at times), they can play an important complementary role in fostering a vibrant rural economy. And given the nature o f exclusion in Onssa, an inclusive strategy will require m u c h greater attention to geographical targeting o f social programs.
34. The demand for skilled labor in industry and modern services will rise rapidly in Orissa over the next decade o r two. If the Government o f Orissa does not invest n o w to generate a supply o f skilled workers f r o m within the state, the best paying jobs are l i k e l y to benefit persons migrating f r o m outside the state, which could be perceived negatively and potentially lead to political resistance to modernization itself. To increase the productivity o f human capital acquired in school and to make i t more valuable in the labor market, the state also has to find efficient ways o f providing training t o the labor force. At the least, the state will have
9