Policy Research Working Paper 7481
The Exposure, Vulnerability, and Ability to Respond of Poor Households
to Recurrent Floods in Mumbai
Archana Patankar
Development Economics
Climate Change Cross-Cutting Solutions Area
Shock Waves: Managing the Impacts of Climate Change on Poverty Background Paper
WPS7481
Public Disclosure Authorized Public Disclosure Authorized Public Disclosure Authorized Public Disclosure Authorized
Abstract
The Policy Research Working Paper Series disseminates the findings of work in progress to encourage the exchange of ideas about development issues. An objective of the series is to get the findings out quickly, even if the presentations are less than fully polished. The papers carry the names of the authors and should be cited accordingly. The findings, interpretations, and conclusions expressed in this paper are entirely those of the authors. They do not necessarily represent the views of the International Bank for Reconstruction and Development/World Bank and its affiliated organizations, or those of the Executive Directors of the World Bank or the governments they represent.
Policy Research Working Paper 7481
This paper was commissioned by the World Bank Group’s Climate Change Cross-Cutting Solutions Area and is a background paper for the World Bank Group’s flagship report: “Shock Waves: Managing the Impacts of Climate Change on Poverty.” It is part of a larger effort by the World Bank to provide open access to its research and make a contribution to development policy discussions around the world. Policy Research Working Papers are also posted on the Web at http://econ.worldbank.
org. The author may be contacted at archana.patankar09@gmail.com.
This paper examines poor households in the city of Mumbai and their exposure, vulnerability, and ability to respond to recurrent floods. The paper discusses policy implica- tions for future adaptive capacity, resilience, and poverty alleviation. The study focuses particularly on the poor households, which tend to have greater exposure and vul- nerability to floods and limited ability to respond given the constraints on physical and financial resources. The study seeks to understand the implications of the fact that poor households are more likely than non-poor households to be located in flood-prone areas. The study used the land use maps for the selected flood-prone areas to determine the extent and spread of poor and non-poor households and other types of assets and activities in areas with chronic
and localized flooding. Primary data were obtained through detailed household surveys to understand the vulnerability and impacts of the extreme floods of July 2005, recurrent floods and the ability of households to respond and cope.
The study examined the option of relocation to flood-free
areas and identified factors that influence families’ decisions
regarding relocation. The study finds that a significantly
large proportion of poor households are located near areas
with chronic and localized flooding. These households
are either below the poverty line or have low incomes
and reside in informal settlements or old and dilapidated
structures. Future climate risks are likely to put greater
burden on the poor and push them further into poverty
unless well directed efforts are made to protect them.
The Exposure, Vulnerability, and Ability to Respond of Poor Households to Recurrent Floods in Mumbai
Archana Patankar
1Keywords: floods, household survey, urban poverty, disaster risk management JEL: Q54, I32, I38, Q56
Acknowledgements
I am indebted to Stephane Hallegatte and Mook Bangalore for their ideas, valuable inputs and support in completing the case study. I am also grateful to Prof. Anand Patwardhan, University of Maryland, for his inputs and feedback at each stage of the work. Special thanks to Ms. Sravanthi Rallabandi of MP Ensystems Advisory Pvt. Ltd. for preparing the GIS maps to understand flood exposure. I would also like to thank Saurabh Dani, World Bank, for an in‐depth review of this paper, Bernice Van Bronkhorst, World Bank, for providing valuable inputs during the workshop held in Feburary 2015, and Laura Bonzanigo, World Bank for useful comments on a previous version of this paper. Dr. Potdar, Ms. Madhura Palnitkar and their entire team from the Centre for the Study of Social Change (CSSC) need a special mention here for successfully carrying out the field work in Mumbai. I am also grateful to Mr. Mahesh Narvekar, Chief Officer, Disaster Management Cell, MCGM and his entire team for their immense support for the research work on Mumbai, timely inputs in understanding flood exposure and vulnerability and carrying out the required field work.
1
Independent Consultant. Contact: archana.patankar09@gmail.com
2
Contents
Acknowledgements ... 1
1. Introduction ... 3
2. Mumbai city: Profile, rainfall pattern and recurrent floods ... 3
3. Methodology and data sources ... 7
4. Results and discussion ... 10
4.1 Exposure to floods ... 10
4.2 Vulnerability and impacts of floods ... 12
4.2.1 Socioeconomic profile ... 12
4.2.2 Impacts of the July 2005 extreme event ... 15
4.2.3 Impacts of recurrent floods ... 18
4.3 Ability to respond ... 19
4.3.1 Short‐term responses ... 21
4.3.2 Structural responses ... 22
4.3.3 Relocation as an option ... 24
5. Policy implications ... 25
6. Summary and Conclusion ... 28
References ... 30
Annexure ... 32
A.1 Flood exposure and demographics in the 9 selected wards ... 32
A.2 Ward land use maps ... 35
1. Introduction
Urbanization is inevitable and essential for future economic growth. What happens in cities and towns, particularly in the developing world, will determine the global economic growth, poverty alleviation, environmental sustainability and quality of life. Today, urban areas regularly experience increasing population, inadequate infrastructure, poverty, growth of informal settlements and environmental degradation, which do not pose a good picture for future sustainable development.
In addition to these challenges, many cities across the globe are hotspots of vulnerability due to climate change and variability and are at risk from extreme and recurrent weather events. Recent decades have seen extreme weather events, such as the floods in Mumbai in July 2005, which have led to massive damages and loss of life and property, and adversely affected economic and social life.
Such events have adverse consequences for economic development and poverty alleviation and can potentially alter the development trajectory of the city and surrounding areas. Accompanied by physical, economic and social vulnerabilities in such cities is the low adaptive capacity with constraints on physical, financial and human resources. It is, therefore, critical to assess the vulnerability of cities to extreme and recurrent weather events and their ability to respond in order to determine the future adaptation interventions.
The empirical study carried out in Mumbai aims to examine the exposure, vulnerability and ability to respond of households to recurrent floods and brings out policy implications for adaptive capacity.
The study focuses particularly on the poor households in the city, who tend to have greater exposure and more vulnerability to hazards like floods and have limited ability to respond and adapt. Greater Mumbai, with a population of 12 million as per Census 2011 figures (GoI, 2011), is a megacity and an important financial center. However, the city is vulnerable to climate risks due to its flood‐prone location and the landmass composed largely of reclaimed land. The most vulnerable sections of the city are the residents in informal settlements known as slums, who comprise about 41% of the city’s households (GoI, 2011). Therefore, Mumbai is an important case study to understand the vulnerability of poor households to recurrent weather events and examine their ability to respond.
The findings of this study have wider and significant policy implications.
The case study is structured as follows. The next section describes the city profile, rainfall pattern and the nature of recurrent floods. Methodology and data sources are outlined in Section 3 followed by the discussion on the findings on exposure, vulnerability and ability to respond in Section 4.
Section 5 brings out the policy implications of the study followed by the summary and conclusions in Section 6.
2. Mumbai city: Profile, rainfall pattern and recurrent floods
Mumbai (formerly known as Bombay) is currently the sixth largest urban agglomeration in the world
with the population of 20 million (United Nations, 2014). The city is the financial capital of India with
a large commercial and trading base. It plays host to a number of industries, multinational companies
4
and important financial institutions. The city is also an important international sea port and strategic from the defense perspective. Mumbai is located on the western seacoast of India on the Arabian Sea and was originally a cluster of seven islands as seen in Figure 1 below. Since the 17
thcentury, these islands have been joined through drainage and reclamation projects as well as construction of causeways and breakwaters to form the modern day one landmass (MCGM, 2014).
Figure 1: Original seven islands and subsequent growth of Mumbai
Source: MCGM, 2006; MCGM, 2015
The Greater Mumbai Region (referred to as Mumbai in this paper) occupies an area of 458.16 square kilometers (sq. km.), of which 415.05 sq. km.
area (Groupe SCE, 2012) is under the jurisdiction of the local government, Municipal Corporation of Greater Mumbai (MCGM) and the remaining are the Special Planning Areas (SPA).
2The primary agency responsible for governance is the MCGM. The city is divided into different administrative zones known as ‘wards’ to ease the day‐to‐day functioning of the civic authority. The civic body is responsible for the provision of civic amenities including urban planning, water supply, sanitation, drainage, solid waste and roads, along with services like education, public health, art and culture and heritage conservation. Other key parastatal agencies also have an important role to play in the provision of infrastructure and planning of the city. They include the Mumbai Metropolitan Region Development Authority (MMRDA),
3Maharashtra Housing and Area Development Authority (MHADA)
4and Slum Rehabilitation Authority (SRA).
5Multiple agencies with multiple mandates at times create challenges of coordination and jurisdiction and are
2
Special Planning Areas (SPAs) include Backbay Reclamation, Bandra Kurla Complex, Dharavi, SEEPZ, MIDC, Aiport, etc. which are not under the jurisdiction of MCGM and are governed by other agencies or parastatals.
3
MMRDA was set up in 1975 as the planning and coordinating agency for the Mumbai Metropolitan Region. It brings together central and state government to jointly fund urban development and works with municipal corporations and municipal councils in the region.
4
MHADA is a state government body working for providing cheaper housing and building repairs and maintenance in coordination with municipal corporations.
5
SRA was set up in 1995 to survey the slum areas and formulate and implement schemes for slum rehabilitation.
known to affect the pace of many infrastructure and developmental projects implemented in the city.
The total population of Mumbai has grown steadily from 3 million in 1951 to 8 million in 1981 to 12.43 million in 2011 with population density of 28,404 persons per sq. km. (MCGM, 2014). About 55‐60% of the population resides in informal settlements or hutments known as slums, which occupy 33% of the total residential area (MCGM, 2014a) and almost all the population increase in the city over time has been absorbed in these settlements (Annez et al., 2010). The majority of the people living in slums belong to low‐income segments of the population. Yet, Mumbai is the economic powerhouse of the country, contributing 33% of income tax collections nationwide, 60% of customs duties collection and 40% of foreign trade (MCGM, 2014a). The per capita income at current prices has increased from USD1,089 (1USD=INR60)
6in 2006‐07 (GoM, 2007) to USD4,058 in 2013‐14 (GoM, 2014). However, the household income distribution shows acute inequalities with 20% earning less than USD167 per month, 50% below USD330 per month and top 10% earning USD2,000 per month (Annez et al., 2010). These acute inequalities in income distribution reveal acute poverty in the city and also explain more than 50% population living in informal slum settlements.
On the weather front, the city experiences a heavy southwest monsoon rainfall and is also prone to cyclones and gusty winds. Historically, Mumbai has been receiving an annual rainfall of about 2,200 millimeters (mm) during the monsoon season between June and September. Since 2004, the average annual rainfall has been more than 2,400mm, with variations in rainfall from the lowest of 1,274mm recorded at Colaba weather station in 2002 to a maximum of 3,378mm recorded at Santacruz weather station in 2010
7(MCGM, 2014). There are a number of days every year when rainfall exceeds 65mm or 135mm per day. Rainfall of 200mm or more per day is also not uncommon during the onset of monsoon. Heavy precipitation and resultant flash floods are, therefore, a regular event in Mumbai.
Flooding is a chronic and recurrent problem during monsoon. The key reasons for flooding are tidal variations, flat gradients and mud flats causing excessive siltation (MCGM, 2014a). Many low‐lying and reclaimed areas across the city get flooded, especially when heavy rains combine with high tide or storm surges, with the added difficulties due to unsanitary methods of solid waste and sewage disposal and problems with the drainage systems (Sherbinin et al., 2007). Other contributing factors to flooding are manmade inappropriate levels of outfalls, loss of holding ponds due to land development, increase in the run‐off coefficient, encroachments on drains and obstructions due to crossing utility lines (MCGM, 2014a). Mumbai’s vulnerability to extreme precipitation was demonstrated on 26 July 2005 when 944mm rainfall occurred in the suburban district in the 24‐hour period. About 200km of road length and the airport was submerged in flood water. Local train services, bus services and air traffic came to a complete standstill. Around 2 million people were
6
The conversion rate of 1US Dollar = Indian Rupees 60 used throughout this paper.
7
Floods occurred in 2010 after this maximum rainfall and have occurred every year since the 2005 event.
6
stranded in transit and another 2.5 million had their houses under water for hours together. Property and assets worth billions of rupees were lost or damaged.
This extreme precipitation event brought about changes in the way floods are reported and dealt with in the city. The Disaster Management Cell (DMC), set up at MCGM, has installed 54 rain gauges across the city to record rainfall at 15‐minute interval. Warnings are issued to ward offices when rainfall exceeds 40mm per hour. The database of flood instances between the year 2000 and 2008 shows an average of 76 instances of flooding annually in the island city, 57 instances in the Eastern suburbs and 129 flooding instances in the Western suburbs.
8Further, based on the experience of recurrent floods, MCGM has identified 40 chronic flooding spots (low‐lying areas) as seen in Figure 2. In addition to these, there are over 200 localized flooding spots, where waterlogging is due to inadequate drainage and/or changes in the topography with changing land use. While these recurrent floods are less intense in terms of magnitude (for instance, compared to the 2005 floods), they nevertheless increase the vulnerability of people living in these chronic flood spots. As discussed below, a large percentage of the population living in chronic flood zones are amongst the poorest with low levels of adaptive capacity.
Figure 2: Chronic flooding spots in Mumbai
Source: Disaster Management Cell, MCGM. http://www.mumbaimonsoon.com
8
Data obtained from Disaster Management Cell, MCGM.
3. Methodology and data sources
As discussed, Mumbai is acutely vulnerable to recurrent floods. Given the acute income inequalities and 50% population residing in informal settlements, it is critical for the city to examine how recurrent floods impact the households and how do they cope with them. The aim of this study is to examine the exposure of the households to recurrent floods, vulnerability in terms of direct and indirect impacts of floods and their ability to respond. The study lays special emphasis on the poor households to understand their location in the flood‐prone areas vis‐à‐vis the non‐poor households, estimate the losses suffered by them on account of floods and examine the extent to which they can adapt to floods and have the ability to respond.
Table 1 describes the research questions, methodology and sources of primary and secondary data used in this study. To determine the exposure to flooding, the study seeks to understand the extent and spread of poor and non‐poor households located along the chronic and localized flooding spots.
For this purpose, extensive database of the Planning Department of MCGM has been used. The Planning Department released Existing Land Use (ELU) maps (MCGM, 2015) as part of the exercise for creating the new development plan for the city. We have selected nine most flood‐prone wards and superimposed the chronic and localized flooding spots on the ELU maps using the GIS‐based platform. The chosen wards – F South, F North, K East, K West, H East, H West, L, M West and P North – represent three types of flood‐prone areas ‐ low‐lying areas, areas in the Mithi river flood plain and reclaimed areas. The demographics for these wards are given as Annexure A.1 and the maps showing land use in chronic and localized flood spots are given as Annexure A.2. The study has used 500 meter (m) buffer zone around the chronic spots and 200m zone around the localized spots to identify the vulnerable households in the flood‐prone areas.
In order to understand the vulnerability and impacts of floods as well as the ability to respond, the
study has used detailed household surveys in the flood‐affected wards. Most damage assessment
methods use insured exposure analysis to calculate the direct losses. This is particularly true for the
developed world, where the coverage of insurance is very high. However, such methods are not able
to capture losses suffered by the poor households, especially in developing countries, since they do
not have the means to insure themselves. Yet, they are the most vulnerable sections to hazards like
floods (Herweijer et al., 2009). Further, empirical studies for flood‐related economic damage
assessment focus at macro or meso level and spatial aggregation of the affected assets is done over
the whole administrative area using land use and hazard exposure maps (Merz et al., 2010). There
are very few studies that try to assess the damage to single risk elements, such as, houses by carrying
out detailed household surveys, e.g., Dutta et al., (2003), Khandlhela and May, (2006), Brouwer et
al., (2007), Sales (2009) and Rabbani et al., (2013). For Mumbai, household surveys have carried out
by Hallegatte et al. (2010) to examine the impact of the July 2005 extreme floods on marginalized
population and informal economy: the economic impacts on assets and business losses for
marginalized populations totaled USD $245 million. But this is likely an underestimate, as health
8
impacts and out‐of‐pocket health expenditure were not included in the estimate but were likely to be high.
For the present study, data from two detailed household surveys carried out in six wards have been used as seen in Table 2. The first survey of 1168 households focused on the losses due to the extreme weather event of July 2005 (Patankar et al., 2012). Detailed information was obtained on flood‐
specific impacts and costs of repairs/replacements of household assets and equipment. Similarly, the second survey of 200 households (carried out in 2014 as part of the present study) focused on the impacts of recurrent floods and ability to respond. Under this survey, questionnaires were used to understand more about vulnerability and impacts of recurrent floods and ability to respond, including the possibility of relocation to another area to escape recurrent floods. The questionnaire focused on (a) household income, expenditure and assets, (b) household characteristics, (c) exposure and impact of recurrent floods, (d) preparing for floods and (e) relocation as an option.
In addition to the above surveys, we have also used the data obtained from 30 housing societies
9in order to understand the adaptation options exercised by households collectively, source of finance for such measures and the decision‐making process involved therein (Patankar et al., 2015).
Table 1: Methodology and data sources for the study
Research questions Methodology Data Sources
Exposure
Who and what is exposed to recurrent floods
Examine demographics of flood‐prone wards
Census 2011 data on Mumbai
Ward‐wise data obtained from planning
department of MCGM on residential, commercial and other land uses
What is the extent and spread of poor and non‐poor households around flooding spots
Land use identified in 500m buffer zone around chronic flooding spots and 200m zone around localized spots
Existing Land Use (ELU) maps of planning department of MCGM
GIS based land use maps created for buffer zones around chronic and localized flood spots
Vulnerability
What have been the impacts of extreme weather event of July 2005
Sampling for households in flood‐affected wards
Administering
questionnaires to sample
Primary data collected from 1168 households under 2010 household survey
9
A housing society is a group of housing units, whose object is to provide its members with the open plots of land,
dwelling units or apartments and common amenities and services. Member households elect representatives who
take decisions on their behalf and look after the common services and their maintenance.
households to capture impacts
What is the asset and income loss associated with recurrent floods?
Sampling for households in flood‐affected wards
Administering
questionnaires to sample households to capture asset and income loss
Primary data collected from 200 households as part of 2014 household survey
Are the impacts heterogeneous
Examine the impacts on poor and non‐poor households separately
Examine welfare impacts such as health,
productivity and savings in asset that get exposed to floods easily
Census 2011 data on Mumbai households
Primary data collected from 200 households for the 2014 household survey
Ability to respond
What are the
adaptation options at the household level
Identify household adaptation options, their costs, source of finance and decision‐making process
Primary data collected from 1168 households under 2010 household survey
Primary data collected from 30 housing societies under 2014‐2015 housing society survey
What is the role of government in facilitating private adaptation
Role of local government in facilitating private adaptation
Community organizations working with local government
Secondary data and reports from MCGM
To what extent can households respond effectively to floods and what are the barriers to adaptation
Short to medium term effectiveness of household adaptation
Factors restricting the ability to cope
Primary data from 30 housing societies under 2014‐2015 housing society survey
Primary data from 2014 household survey
10
Table 2: Details of household surveys
10Wards Type of
area
Population Chronic flooding spots
Localized flooding
spots
Flooding Depth
(feet)
Sample households
2010
household survey (N=1168)
2014 household
survey (N=200) K East Reclaimed
area
823,885 2 7 1.0‐3.6 241 30
H East River flood plain
557,239 0 14 0.8‐6.0 176 36
F North Low lying area
529,034 2 9 1.0‐3.0 177 29
F South Low lying area
360,972 1 8 2.0‐4.0 103 35
L Ward River flood plain
902,225 3 13 1.0‐4.0 231 35
P North Reclaimed area
941,366 3 6 1.0‐2.6 240 35
4. Results and discussion
This section discusses the findings based on the primary and secondary data to understand the exposure of poor and non‐poor households to recurrent floods, direct and indirect impacts on them and their ability to respond to such events.
4.1 Exposure to floods
In order to understand the nature of exposure of poor and non‐poor households to recurrent floods in Mumbai, the study has examined the demographics and land use pattern in nine administrative wards that are prone to floods every monsoon. The details of the chosen wards are given as Annexure A.1. Also provided in are the tables showing the flood exposure and demographics in each of the 9 selected wards in Annexure A.1. These wards represent three types of flood‐prone areas – low‐lying areas, reclaimed areas and areas in the Mithi River flood plain, as seen in Table A.1.1. The information on the total ward population, slum population and the number and location of flooding spots has been obtained from the Disaster Management Cell (DMC) of the MCGM. All the selected wards experience recurrent floods and have a number of chronic and localized flooding spots located within. As seen in Table A.1.1, each ward has a large residential density and also a significantly high percentage of the residents living in slums. For instance, F North, L Ward, M West and P North have more than 50% people residing in slums followed by K East, where the slum population is 49% and H East, where it is 42%.
10
Information on ward population, chronic and localized flooding spots and average depth of flooding obtained
from Disaster Management Cell, MCGM.
In the aftermath of the extreme flooding event of July 2005, the DMC has mapped the locations of chronic and localized flooding spots. Using the Quantum GIS Software and the Existing Land Use (ELU) maps developed by the Planning Department of the MCGM, we have determined the extent of direct exposure of residents around the flooding spots. In addition to the flooding spots, the number of people located near the landslide prone areas has also been estimated in our analysis. This gives us an added dimension to understand the vulnerability of residents.
The types of land uses and number of slum and non‐slum residents located in the 500m buffer zone of the chronic flooding spots, 200m buffer zone of the localized flooding spots and 100m buffer zone of landslide prone areas, where applicable, have been estimated through the exposure maps developed by us (seen in Annexure A.2). The assumption for calculating the numbers in Table A.1.1 is that the residential density will be the same across the entire ward. Hence, for each flooding spot, the total residential area covered around the buffer zone of the flooding spot is multiplied by the residential density to arrive at the total number of vulnerable people. Across the flood‐prone wards, more than 20% residents are exposed to recurrent floods as they reside in either chronic or localized flooding spots. In M West, more than 47% population is exposed to floods followed by 30%
population in F North and L Ward.
In order to understand more about the residents living in flooding spots, the study has used the different types of residential land uses is provided in the ELU maps. Their respective percentages as provided in the ELU maps have been used to determine the number of people in each type of residential land use around the flooding spot using the given residential density. Table A.1.2 gives details of the different types of residences located in the flooding spots, such as, slums, chawls,
11apartments, government housing and individual housing. Slums and chawls are mostly occupied by poor or low‐income households. Apartments and government housing usually have a mix of low and middle‐income families. High rise apartments and individual houses are occupied by higher middle income and rich households. We see sizable slum population in the selected wards getting exposed to floods, as seen in Table A.1.2. For instance, in L Ward, M West and H East, more than 30% of the slum population is directly vulnerable to recurrent floods. In P North and F South, sizable population of chawl residents is vulnerable. Similarly, percentage of apartments belonging to low‐income and middle‐income households with direct exposure to recurrent floods is very high across all wards.
Besides the types of residences located near the flooding spots, we have analyzed the types of other land uses to get better understanding of the asset exposure to recurrent floods. As seen in Table A.1.3, all the selected wards have a number of retail shops, markets, office blocks and industrial units
11
Chawls are large buildings divided into many separate and often single‐room rental tenements offering cheap
and basic accommodation. Such buildings were constructed in Mumbai many years back to provide housing to
textile mill workers and other labourers who migrated into the city. Many of these buildings are in poor and
dilapidated conditions now.
12
in flood‐prone areas. For instance, L Ward and M West have a large number of retail shops and markets located near the chronic flooding spots. Similarly, L Ward, K East, K West and F North have a number of industrial units located near chronic and localized flooding spots. In addition, there are educational amenities, including schools, which are located near flooding spots in almost all the selected wards. Among the medical facilities, the key public hospitals are located at the chronic flooding spot in F South. Similarly, a number of medical facilities are located near chronic spots in M West, L Ward and P North. Social amenities like places of religious worship or community centers are also in large numbers all along the flooding spots in the selected wards. Besides the other services and amenities, there are a large number of public utilities located in flood‐prone areas. These include electric transmission and receiving stations, power lines, water pumping stations, sewage pumping stations, public sanitary facilities, solid waste disposal sites, fire brigade, storm water pumping stations, etc.
The key findings from the flood exposure analysis are:
A large number of households reside nearby and are directly exposed to chronic and localized floods across the flood prone wards in the city.
The percentage of slum dwellers located near the flooding spots is quite high. These are the most vulnerable sections of the population and are directly exposed to flood waters due to their location on the roadsides or in low‐lying areas.
Besides slum households, other poor, low and middle income households residing in chawls and apartments are exposed to recurrent floods in large numbers.
Apart from the households residing in and near the flooding spots, people transiting through the areas for work or to use services and amenities are also directly and indirectly exposed to floods.
The direct exposure of population in transit happens when they use the services and amenities located near the flooding spots. There are a number of shops, markets, educational and medical facilities, social amenities and public utilities which are located near these spots.
The nature of all the land uses around the chronic and localized flooding spots highlights the significant amount of asset and wealth exposure to recurrent floods.
4.2 Vulnerability and impacts of floods
This section explores the vulnerability and impacts of recurrent floods on the households in Mumbai through the surveys carried out in six flood‐prone wards as described in the methodology section.
The analysis focused on the socio‐economic profile of surveyed households, multiple stressors faced by them, vulnerability to recurrent floods, impacts of the extreme weather event of July 2005 and subsequent impacts of recurrent floods.
4.2.1 Socioeconomic profile
For the 200 households surveyed across six wards for this study, Figure 3 shows their socio‐economic
status. Among the sample households, 11% have monthly income less than Indian Rupees (Rs.) 5,000.
Based on the Poverty Line estimates using Tendulkar Method, the All India Urban Poverty Line is Rs.
1,000 per person per month (GoI, 2013). Since the average family size in slums is 5 as per Census 2011 and Below Poverty Line (BPL) households reside mainly in Mumbai slums, the households with income less than Rs. 5,000 per month are classified here as BPL households. Incomes between Rs.
5,000 and 10,000 are also poor households, but just above the poverty line. Ministry of Housing and Urban Poverty Alleviation (MHUPA) recognizes Rs. 15,000 or less as Low Income Group (LIG) households and above Rs. 15,000 as Middle Income Group (MIG) households. We have further classified Rs. 20,001 and above as Higher MIG households. Based on this classification of households into BPL, poor, LIG, MIG and Higher MIG, most of the households (77%) in our sample are BPL, poor and LIG households. This corresponds with the overall income distribution in Mumbai (Annez et al., 2010).
Figure 3: Income distribution of sample households
The average family size is 6 members, with 4 adults and 2 children and mostly only one earning member. Education and occupation of head of the household is a good indicator of the socioeconomic status of the family. In our sample, the average level of education is matriculation (10
thgrade, 33%) followed by higher secondary (10+2, 26%) and graduation (20%). Not many are educated beyond graduation or have professional degrees. The occupation, in accordance with education, is either private service or small retail business. 23% of respondents also work as skilled or unskilled labor. Average expenditure further corroborates the income levels reported by the families. They spend on an average Rs. 3,000 on groceries, Rs. 250 on water, Rs. 1,000 for electricity and Rs. 850 for transportation per month. The medical expenses are Rs. 850 and repairs or maintenance expenses are about Rs. 1,000. Only 15% families have reported saving some money in the bank every month and the average savings are about 10% of monthly incomes. The penetration of banking is actually quite high in Mumbai (86% of households) based on Census 2011. However, given the lower incomes, the households may not be able to keep a large part of their incomes as savings in a bank.
Less than 5000 ‐ BPL 11%
5001‐10000 ‐Poor 44%
10001‐15000 ‐LIG 22%
15001‐20000 ‐ MIG 14%
More than 20001 ‐ Higher MIG
9%
14
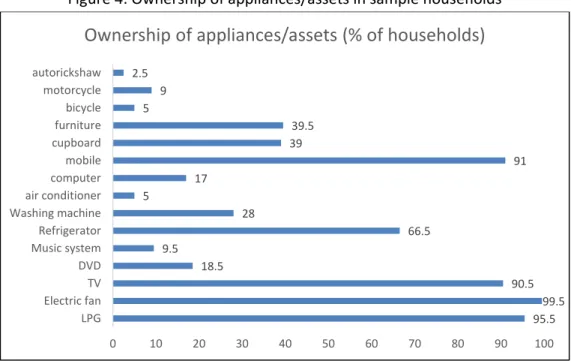
Figure 4 depicts the ownership of appliances or assets that the sample households own. More than 90% families own a television set, mobile phone and electric fan. Almost all houses use LPG cylinder for cooking. More than 66% families also own a refrigerator. Expensive durable appliances, such as, air conditioner or washing machine are owned by fewer households. Another important finding is that 90% families own the house they live in. Although housing in slums is considered illegal, the families purchase houses through the informal networks operating in these areas. The implication of this finding is that poor and low income households invest in the house and durables and appliances;
the very assets that are most affected during floods.
Figure 4: Ownership of appliances/assets in sample households
Most surveyed families live in older buildings with average 30 years since construction. 72% are living in slums or chawls and the average size of the dwelling is 200 sq. ft. Families usually carry out maintenance and repair work every 2‐3 years, for which each house contributes about Rs. 500 per month. More than 60% houses have rated the quality of drinking water and sanitation as fair and 27% have rated it as good. Same is true with the reliability of electricity with 61% rating it as fair.
Almost all households have some medical services nearby in the form of general practitioners, municipal health centers, hospitals or specialist health clinics. 90% of the families live and work in the same area. The same area would basically mean a workplace within the city limits, since the average time spent by them for traveling to work every day is about 1.5 hours. The mode of transportation is multiple, which is typical for Mumbai. About half of the families use the suburban railway network followed by buses and 35% also walk to work.
The majority of the families have been living in the same area for a long time (average 45 years) and 51% have migrated from rural areas 38‐40 years back. 66% reveal that they feel less stressed in the
95.5 99.5 90.5 18.5
9.5
66.5 28
5
17
91 39
39.5 5
9 2.5
0 10 20 30 40 50 60 70 80 90 100
LPG Electric fan TV DVD Music system Refrigerator Washing machine air conditioner computer mobile cupboard furniture bicycle motorcycle autorickshaw
Ownership of appliances/assets (% of households)
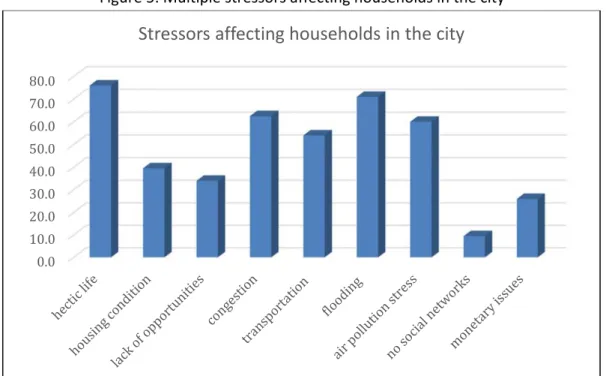
city compared to how they were in the rural area. However, there are a number of stressors that families associate with city life as seen in Figure 5. 71% households have reported flooding as a critical stressor, which is the second highest stressor after hectic life. Other important stressors are congestion, air pollution and transportation.
Figure 5: Multiple stressors affecting households in the city
4.2.2 Impacts of the July 2005 extreme event
Most households living in the suburbs of Mumbai were affected directly or indirectly during the extreme precipitation of 26 July 2005. The city administration was caught off guard and the deluge brought the city to a virtual standstill. It took almost a week for the public utilities and services to return to normalcy. The worst hit by the unprecedented floods were the poor and low income households, who do not have any form of insurance or social protection. As mentioned in the methodology section, the household survey in 2010 (funded by the Asia Pacific Network or APN) interviewed 1,168 households across six flood‐affected wards to understand the magnitude and nature of losses suffered by them. The monetary impact on the households, as analyzed by the 2010 household survey, is depicted in Table 3. The most important impact in terms of the amount spent on repair or rebuilding the house. This amount has exceeded the average monthly incomes of the respondent households across all surveyed wards. Other losses are due to damage to household appliances, assets or vehicles.
0.0 10.0 20.0 30.0 40.0 50.0 60.0 70.0 80.0
Stressors affecting households in the city
16
Table 3: Impacts on households during July 2005 extreme event
K East H East F North F South L Ward P North
(Figures in bracket as % of average household monthly income) Income loss due to floods 10474
(69.8)
8543 (57.0)
5164 (25.8)
8323 (41.6)
22578 (112.9)
14894 (74.5) Amount spent on
repair/rebuilding of house/premises
22270 (148.5)
26191 (174.6)
34335 (171.7)
42967 (214.8)
22457 (112.3)
27118 (135.6)
Losses due to damage to household appliances (TV, refrigerator, washing machine, etc.)
13190 (87.9)
15469 (103.1)
13442 (67.2)
10081 (50.4)
11325 (56.6)
23923 (119.6)
Losses on account of damage to household assets (Furniture and utensils)
9735 (64.9)
11061 (73.7)
11756 (58.8)
6602 (33.0)
7121 (35.6)
10417 (52.1)
Losses due to damages to vehicles
(Car, Motorcycle, Bicycle)
12974 (86.5)
9153 (61.0)
11833 (59.2)
1250 (6.3)
5478 (27.4)
7232 (36.2)
Source: Patankar et al., 2012
Table 4 further looks at these impacts across different income categories. Similar income classification of BPL, LIG, MIG and Higher MIG is used here depending on the income ranges originally used in the study. The table shows how the poor and low income houses suffered relatively far greater magnitude of losses compared to their earnings. For instance, BPL houses suffered losses of Rs. 37,000 on average, which is more than six times their monthly income. But for LIG families, losses are 4‐5 times their monthly income, thrice for the MIG households and twice for the higher MIG families. Hence, the poor and low income households with limited or no ability to bear the losses have suffered more during the extreme floods compared to their better‐off counterparts.
Table 4: Impacts distributed across income categories (2005 floods) Category Income
loss
Damage to appliances
Damage to assets
Amount spent on house repairs
Damage to vehicles
Average losses
Less than 5000 (BPL)
5000 11000 6700 15000 6500 37000
5000‐15000 (LIG)
5000 13000 7000 22000 9000 48000
15000‐30000 (MIG)
14000 14000 10000 30000 10000 57000
Above 30000 (Higher MIG)
12000 17000 13000 45000 ‐ 69000
Source: Calculations based on data obtained from 1168 households
When we consider the nature of assets in which poor families invest, such as house, durables and appliances, these are the very assets which suffer the most damage during floods. This is a very important finding that has critical policy implications in terms of specifically directing the adaptation interventions towards poor. The losses suffered by the poor households in the city are uninsured and therefore, there is a need to develop an effective insurance or social security mechanism that can protect the only assets owned by the poor from floods and other hazards in future.
The government provided some assistance to the affected families after extreme floods. Among the surveyed households, about 47% reported receiving the monetary help from the government of maximum Rs. 5,000. This amount, termed as the Gratuitous Relief Assistance (GRA) has been predetermined by the Standing Orders (1983) of Government of Maharashtra (GoM, 2006). This assistance is supposed to take care of the immediate requirements of food, clothing and utensils.
Therefore, it has no correlation with the actual amount of losses reported by the families. We find the correlation coefficient of ‐0.18 between the losses suffered by the surveyed households and compensation offered by the government. This suggests that the compensation mechanism is not sufficient and effective in targeting the poor. The amount of the compensation seems to have been decided arbitrarily by an order passed in 1983 and an update of the provision to better reach the poor and more adequately offer compensation should be a priority.
Figure 6: Losses and government compensation for different income groups
Source: Calculated based on the survey of 1168 households
As shown in Figure 6, the government assistance of Rs. 5,000 on average for each income category can cover only up to 13.5% of the losses suffered by the BPL families and 10.4% of losses of low income households. Further, the amount of compensation on average is Rs. 5,000 but some families
0 10000 20000 30000 40000 50000 60000 70000 BPL
LIG MIG Higher MIG
Losses and government compensation
Compensation Losses
7.25%
8.77%
10.4%
13.5%
18
have reported receiving less than this amount. If we divide the amount of compensation with the number of family members, the per capita compensation is about Rs. 1,000 for the BPL families (average 5 members) and Rs. 1,250 for others (average 4 members). Thus, the absolute amount of the compensation may seem pro‐poor in relative terms, but as poor households are typically larger, the compensation per capita seems to be in favor of families who are not below poverty line.
4.2.3 Impacts of recurrent floods
July 2005 precipitation is a 1‐in‐200 year event that had a devastating impact on the city households.
However, they suffer regularly, albeit in lesser degree, on account of recurrent floods that occur every monsoon season. With this in view, we have gathered information from the 200 households in the present study on the impacts of recurrent floods. The households have been asked specific questions pertaining to the number of days and average depth of flooding every year, problems faced by the families during floods, workdays lost and health impacts after floods.
The average depth of flooding in the surrounding compound, as reported by the households, is about 1.5 feet with the range of 0.5‐4.5 feet and water remains between 0.5 and 8 hours depending on the area. 42% of the households have reported that flood waters enter their house every year during monsoon. The average depth of flooding inside the house is 1.3 feet with the range of 0.5 to 3.5 feet and the houses remain flooded for average 2 hours. The maximum depth experienced by the surveyed families was in July 2005 when the compound and the houses were flooded up to 5 feet and 4 feet respectively. Almost all families have said that the intensity and depth of flooding has reduced since 2005, which is not surprising since July 2005 was an extreme and a rare event.
Most households reported damages to structure, electrical wiring, appliances, furniture, plumbing, utensils and vehicles in 2005. Such damages have not been reported since then. During recurrent floods, families face problems of non‐availability of transportation, disruption in power supply and non‐availability of food and other supplies. Once in 2‐3 years, they also face problems of non‐
availability of drinking water and shortage of fuel during floods. Thus, we can infer that extreme floods cause significant monetary damage to the households, whereas recurrent floods cause inconvenience and indirect impacts due to recurrent problems.
Another important consequence of recurrent floods is the loss of workdays every year, which causes loss of income as well as productivity. On an average, households have reported losing about 2.5 workdays per year. The range is from 1 to 6 days and this would vary every year depending on the intensity of precipitation during monsoon. The reasons for lost workdays are mainly flooding of the road outside offices or houses and non‐availability of transportation.
Perhaps the most critical impacts of recurrent floods are the health effects experienced by them in
the immediate aftermath of floods every year. Vector‐borne and water‐borne diseases have a strong
link with heavy precipitation and floods. Every year, during monsoon, areas which get flooded
experience an increased incidence of malaria, dengue, diarrhea and jaundice. Wading through the flood waters is also known to be the cause of Leptospirosis. Table 5 gives the significantly high incidence of health impacts experienced by the households every year. The most prominent are chronic cold and cough, viral fever, malaria, diarrhea, typhoid and dengue. This is supported by secondary data from public health department of the MCGM, which has recorded a 217% increase in the incidence of malaria during the last decade and identified unhygienic living conditions in slums and water accumulation during monsoon as the factors responsible for it.
12Table 5: Health impacts experienced by households every year after floods
Health impact % of households
Malaria 64.5
Dengue 29.0
Typhoid 34.5
Jaundice 25.0
Diarrhea 39.5
Viral fever 86.5
Leptospirosis 4.0
Asthma attack 7.5
Chronic cold and cough 92.0
Source: Calculations based on data obtained from 200 households
The responses obtained from the households, thus, show how recurrent floods continue to impact the households year after year. Although the intensity of the impacts is not the same as those during the deluge of 2005, poor households continue to suffer on account of floods. Health impacts and workdays lost also involve direct monetary burden that includes cost of treatment and loss of productivity. Therefore, it is not just the low probability high consequence events like July 2005 that have a significant impact on the households but even high probability low consequence events like recurrent floods that involve recurrent and significant impacts.
4.3 Ability to respond
From the preceding discussion on exposure, vulnerability and impacts, it is clear that the poor and low income households are acutely vulnerable to floods and bear significantly high burden of the impacts. The monetary losses suffered by them during an extreme event are far greater than their incomes. During the recurrent floods, there are impacts and losses on account of lost workdays and non‐availability of basic services. Further, there are indirect losses due to the unavailability of services like water supply, electricity and transportation, which cannot be quantified easily. The important issue is to assess the vulnerability and impacts in view of the ability of the poor households to respond
12