IHS Economics Series Working Paper 280
December 2011
The Causal Effect of Education on Health: What is the Role of Health Behaviors?
Giorgio Brunello
Margherita Fort
Nicole Schneeweis
Rudolf Winter-Ebmer
Impressum Author(s):
Giorgio Brunello, Margherita Fort, Nicole Schneeweis, Rudolf Winter-Ebmer Title:
The Causal Effect of Education on Health: What is the Role of Health Behaviors?
ISSN: Unspecified
2011 Institut für Höhere Studien - Institute for Advanced Studies (IHS) Josefstädter Straße 39, A-1080 Wien
E-Mail: o ce@ihs.ac.atffi Web: ww w .ihs.ac. a t
All IHS Working Papers are available online: http://irihs. ihs. ac.at/view/ihs_series/
This paper is available for download without charge at:
https://irihs.ihs.ac.at/id/eprint/2106/
The Causal Effect of Education on Health:
What is the Role of Health Behaviors?
Giorgio Brunello, Margherita Fort, Nicole Schneeweis,
Rudolf Winter-Ebmer
280
Reihe Ökonomie
Economics Series
280 Reihe Ökonomie Economics Series
The Causal Effect of Education on Health:
What is the Role of Health Behaviors?
Giorgio Brunello, Margherita Fort, Nicole Schneeweis, Rudolf Winter-Ebmer December 2011
Institut für Höhere Studien (IHS), Wien
Institute for Advanced Studies, Vienna
Contact:
Giorgio Brunello
Department of Economics University of Padua Via del Santo, 33 I-35121 Padov, Italy
email: giorgio.brunello@unipd.it Margherita Fort
Department of Economics University of Bologna Piazza Scaravilli 2 I-40126 Bologna, Italy email: margherita.fort@unibo.it Nicole Schneeweis
Department of Economics Johannes Kepler University Altenberger Str. 69 A-4040 Linz-Auhof, Austria email: nicole.schneeweis@jku.at Rudolf Winter-Ebmer
Department of Economics Johannes Kepler University Altenberger Str. 69 A-4040 Linz-Auhof, Austria email: rudolf.winterebmer@jku.at and
Institute for Advanced Studies, Vienna; CEPR; IZA
Founded in 1963 by two prominent Austrians living in exile – the sociologist Paul F. Lazarsfeld and the economist Oskar Morgenstern – with the financial support from the Ford Foundation, the Austrian Federal Ministry of Education and the City of Vienna, the Institute for Advanced Studies (IHS) is the first institution for postgraduate education and research in economics and the social sciences in Austria. The Economics Series presents research done at the Department of Economics and Finance and aims to share “work in progress” in a timely way before formal publication. As usual, authors bear full responsibility for the content of their contributions.
Das Institut für Höhere Studien (IHS) wurde im Jahr 1963 von zwei prominenten Exilösterreichern – dem Soziologen Paul F. Lazarsfeld und dem Ökonomen Oskar Morgenstern – mit Hilfe der Ford- Stiftung, des Österreichischen Bundesministeriums für Unterricht und der Stadt Wien gegründet und ist somit die erste nachuniversitäre Lehr- und Forschungsstätte für die Sozial- und Wirtschafts- wissenschaften in Österreich. Die Reihe Ökonomie bietet Einblick in die Forschungsarbeit der Abteilung für Ökonomie und Finanzwirtschaft und verfolgt das Ziel, abteilungsinterne Diskussionsbeiträge einer breiteren fachinternen Öffentlichkeit zugänglich zu machen. Die inhaltliche Verantwortung für die veröffentlichten Beiträge liegt bei den Autoren und Autorinnen.
Abstract
We study the contribution of health-related behaviors to the health-education gradient by distinguishing between short-run and long-run mediating effects:while in the former only current or lagged behaviors are taken into account, in the latter we consider the entire history of behaviors. We use an empirical approach that addresses the endogeneity of education and behaviors in the health production function. Focusing on self-reported poor health as our health out-come, we find that education has a protective effect for European males and females aged 50+. We also find that the mediating effects of health behaviors - measured by smoking, drinking, exercising and the body mass index – account in the short run for 17% to 31% and in the long run for 23% to 45% of the entire effect of education on health, depending on gender.
Keywords
Health, education, health behaviors, Europe
JEL Classification
I1, I12, I21
Comments
We would like to thank the participants to seminars in Bologna, Bressanone, Catanzaro, Firenze, Hangzhou, Linz, Munich, Nurnberg, Padova, Regensburg, and Wurzburg and especially our discussant, Lance Lochner, for his very detailed comments and suggestions on an earlier version of the paper. We acknowledge the nancial support of Fondazione Cariparo, MIUR- FIRB 2008 project RBFR089QQC-003-J31J10000060001 and the Austrian Science Fund (FWF: S103 The Austrian Center for Labor Economics and the Analysis of the Welfare State). The SHARE data collection has been primarily funded by the European Commission through the 5th, 6th and 7th framework programme, as well as by the U.S. National Institute on Aging and other national Funds. The usual disclaimer applies.
Contents
1 Introduction 1
2 Review of the Literature 3 3 The Contribution of Health Behaviors to the Education
Gradient 4
3.1 The History of Behaviors ... 5
3.2 Estimating the Short-Run and Long-Run Mediating Effects ... 7
4 The Empirical Strategy 8
4.1 The Card-Rothstein approach ... 104.2 The IV approach ... 12
5 Data 12 6 Results 15
6.1 Baseline Estimates of the Reduced Form and Dynamic Health Equations ... 156.2 IV Estimates of the Reduced Form Health Equation ... 18
6.3 IV and ADS Results Compared ... 19
6.4 Robustness Checks ... 20
7 Conclusions 21
8 Tables 23
References 30 Appendix A: An Illustrative Model A.1
Appendix B: Synthetic Indicators for Parental Background B.1
Appendix C: Educational Reforms in Europe C.1
1 Introduction
The relationship between education and health - the ”education gradient” - is widely studied. There is abundant evidence that a gradient exists (Cutler and Lleras-Muney, 2010). Yet less is known as to why education might be related to health. In this paper we explore the contribution of health-related behaviors (shortly, behaviors) - which we measure with smoking, drinking, exercising and the body mass index - to the education gradient. To do so, we decompose the gradient into two parts: a) the part mediated by health behaviors; b) a residual, which includes for instance stress reduction, better decision making, better information collection, healthier employment and better neighborhoods (Lochner, 2011).
1We are not the first to investigate the mediating role of health behaviors. Our contribution is two-fold: first, we distinguish between short-run and long-run mediating effects. Typically, the empirical literature considers only the former and focuses either on current behaviors or on behaviors in the immediate past, thereby ignoring the contribution of the previous history of behaviors. By ignoring this history, short-run mediating effects are likely to underestimate the overall mediating effect of behaviors whenever there is some persistence in the health status. Second, as recently pointed out by Lochner (2011), a problem with the existing empirical literature is that most contributions fail to address the endogeneity of education and behaviors in health regressions and therefore ignore that there are possibly many confounding factors which influence both education and behaviors, on the one hand, and health outcomes, on the other hand. While some studies have dealt with endogenous education, our approach is novel because we address the endogeneity of both education and behaviors in the health production function, and therefore can give a causal interpretation to our estimates.
Our identification strategy - based on the work by Card and Rothstein (2007) - allows us to estimate average education effects for an individual randomly picked from the population. Using a cross-country dataset, where we have a rich set of parental and early life information, this strategy combines selection on observables and fixed effects assumptions to estimate the parameters of both a dynamic health equation, which depends on education and lagged health behaviors, and a static health equation, where health depends only on education. The effect of education on health in the second equation is the education gradient (shortly, the gradient), i.e. the total effect of education on health that results from both mediated and residual effects of education.
We compare the estimates of the gradient obtained following the strategy outlined above with those obtained with a completely different methodology, instrumental vari-
1The residual also includes the contribution of unmeasured behaviors.
ables (IV) estimation, where the key exogenous variation is provided by the changes in compulsory schooling laws across countries and birth cohorts. While the IV strat- egy generates causal estimates that are internally valid for individuals affected by mandatory schooling laws (compliers), it cannot be used for the decomposition of the education gradient because of the lack of valid and relevant instruments for behaviors.
We apply this approach to a multi-country data set, which includes 12 European countries (Austria, Belgium, Denmark, England, France, Germany, Greece, Italy, the Netherlands, Spain, Sweden and Switzerland) and has information on education, health and health behaviors for a sample of males and females aged 50+. By focusing on older individuals, we consider the long-term effects of education on health. These data are drawn from the Survey of Health, Ageing and Retirement in Europe (SHARE) and from the English Longitudinal Study of Ageing (ELSA). Both surveys are modeled following the US Health and Retirement Study.
Focusing on self-reported poor health as our health outcome, we find that education has a protective effect both for males and females, although the effects for females are typically somewhat higher. When evaluated at the sample mean of the dependent variable, one additional year of education reduces self-reported poor health by about 7% for females and 3% for males. These effects are smaller than those found by others.
Our explanation is that we use a sample of older individuals (50+) than typically done in the literature, and that the protective role of education on health declines with age.
Our qualitative findings are robust to the choice of the identification strategy.
There is evidence that health behaviors - measured by smoking, drinking, exercising and the body mass index - contribute to explaining the gradient. The size of this contribution is larger when we consider the entire history of behaviors rather than only current behaviors or behaviors in the immediate past. In the former case, we find that the effects of education on smoking, drinking, exercising and eating a proper diet account for at most 23% to 45% of the entire effect of education on health, depending on gender. In the short-run, the mediating effects are about 17% for females and 31%
for males. Overall, the short-run effects are smaller and amount on average to 70% of the long-run effects. The largest part of the gradient, however, remains unaccounted for. Potential candidates include direct effects of education on health as well as indirect effects operating through unobserved health behaviors, wealth and cognitive abilities.
The paper is organized as follows: Section 2 is a brief review of the relevant lit-
erature. The theoretical model is presented in Section 3, and our empirical strategy
is discussed in Section 4. Section 5 describes the data. The empirical results are
discussed in Section 6. Conclusions follow.
2 Review of the Literature
As recently reviewed by Lochner (2011), empirical research on the causal effect of education on health has produced so far mixed results. This literature typically focuses on single countries and identifies the effect of education on health with the exogenous variation generated by mandatory schooling laws.
2Most of these studies consider self- reported health as well as other outcomes. Some find that education improves health, see for instance Adams (2002), Mazumder (2008) and Oreopoulos (2007) for the US, Arendt (2008) for Denmark, Kempter et al. (2011) for German males and Silles (2009) and Oreopoulos (2007) for the UK. Others find small or no effects. While Clark and Royer (2010) find very small effects for Britain, ambiguous or no effects are obtained by Albouy and Lequien (2009) for France, Arendt (2005) for Denmark, Braakmann (2011), Juerges et al. (2009) and Powdthavee (2010) for the UK and Kempter et al.
(2011) for German females. Overall, the existing literature is inconclusive.
There are many possible channels through which education may improve health.
Lochner (2011) lists the following: stress reduction, better decision making and/or better information gathering, higher likelihood of having health insurance, healthier employment, better neighborhoods and peers and healthier behaviors.
3The contribu- tion of behaviors, which include smoking, drinking and eating calorie-intensive food, has been examined in the economic and sociological literature, starting with the con- tribution by Ross and Wu (1995).
4These authors use US data, regress measures of health on income, social resources and behaviors and treat both behaviors and educa- tion as exogenous. They find that behaviors explain less than 10% of the education gradient.
Cutler et al. (2008) discuss possible mechanisms underlying the education gradient.
Using data from the National Health Interview Survey (NHIS) survey in the US, they find that behaviors account for over 40% of the effect of education on mortality in their sample of non-elderly Americans. A problem with these studies is that they fail to consider the endogeneity of both education and behaviors in a health equation which includes both. In the study closest to the current paper, Contoyannis and Jones (2004) partly address this concern by explicitly modeling the optimal choice of health behaviors. They jointly estimate a health equation - where health depends on education and behaviors - and separate behavior equations - where behaviors depend on education - by Full Information Maximum Likelihood (FIML), treating education
2Adams (2002); Albouy and Lequien (2009); Arendt (2005, 2008); Braakmann (2011); Clark and Royer (2010); Juerges et al. (2009); Kempter et al. (2011); Mazumder (2008); Meghir et al. (2011);
Oreopoulos (2007); Powdthavee (2010); Silles (2009).
3Conti et al. (2010) argue that non-cognitive skills may be an important factor as well.
4See the reviews by Feinstein et al. (2006) and Cawley and Ruhm (2011).
as exogenous. Using Canadian data, they show that the contribution of lagged (7 years earlier) behaviors to the education gradient varies between 23% to 73%, depending on whether behaviors are treated as exogenous or endogenous.
We summarize the existing evidence as follows: first, the available empirical evi- dence on the causal effect of education on health is mixed and covers a rather limited set of countries (Denmark, France, Germany, the UK and the US); second, the esti- mated contribution of behaviors to the education gradient varies substantially across the few available studies, depending on model specification and identification strategy.
5We contribute to this literature in several directions. First, we distinguish explicitly between the short-run and long-run mediating effects of health behaviors. While the former only include the effects of current or lagged behaviors, the latter takes into account the contribution of the entire history of behaviors. This qualification is em- pirically relevant, as we show in section 6. Furthermore, our study is the first to cover a substantial number of European countries (12), using a multi-country dataset which includes also Southern European countries, which have not been studied before. We are also the first to offer an identification strategy which addresses the endogeneity of both education and health behaviors in the health production function. The estimates of the education gradient based on this strategy are compared with those obtained with a more conventional IV strategy, which exploits the exogenous variation in edu- cation across countries and cohorts induced by changes in mandatory schooling. Our assessment of the health education gradient proves to be broadly robust to different identification strategies.
3 The Contribution of Health Behaviors to the Ed- ucation Gradient
In the empirical literature (Ross and Wu (1995) and Cutler et al. (2008)) the contribu- tion of health behaviors to the education gradient (HEG) is evaluated by adding the vector of either current behaviors (B ) - which include smoking, the use of alcohol or drugs, unprotected sex, excessive calorie intake and poor exercise - or of behaviors in the immediate past (first lag) to a regression of (poor) health status
Hon education
Eand other covariates. The lag is often justified with the view that the impact of health behaviors on health requires time. Consider the following empirical model
Hit
=
ct+
αt−1Bi,t−1+
βtEi+
νit(1)
5See also Stowasser et al. (2011) for a discussion of causality issues in the relationship between socio-economic status in general and health.
where
iis the individual,
tis time,
cis a constant and
vis the error term and we assume stationarity in the parameters (c
t=
c;αt−1=
α;βt=
β).Behaviors themselves depend on education. The education gradient
α∂B∂Et−1i
+
βcan be decomposed into: a) the effect operating via health behaviors lagged once
Bt−1, or
α∂B∂Et−1i
; b) the residual effect
β.As reviewed by Lochner (2011), channels through which education may improve health without affecting behaviors include stress reduction, better decision making, healthier and safer employment, healthier neighborhoods and peers. The ratio between the effect operating via health behaviors and the overall effect measures the relative contribution of health behaviors lagged once to the education gradient.
To illustrate with an example, assume that the instantaneous utility function is given by
U(C
it, Bit, ηit)
−h(E)Hit, where
ηis a vector of unobservables affecting preferences, and let
ρbe the discount factor and
ptthe price of the bundle of goods not affecting health.
6As shown in the Appendix, the maximization of the inter-temporal utility function subject to the health production function (1) and the budget constraint yields the vector of optimal behaviors
Bit=
B(Ei, pt, ρ, Xit, ηit), where
Xis a vector of exogenous covariates. Ignoring for the time being the price vector
p,the discount factor and the vector
X, a linear approximation of behaviors isBit
=
σ0+
σ1Ei+
ηit(2) Substituting (2) into (1) yields
Hit
= (c +
ασ0) + (ασ
1+
β)Ei+
αηit+
νit(3) In this example, the education gradient
HEGis given by (ασ
1+
β) and the relativecontribution of behaviors lagged once to the gradient is
(ασασ11+β)
.
3.1 The History of Behaviors
By focusing on current or lagged behaviors, specification (1) assumes that behaviors taken before the immediate past do not contribute to current health, conditional on the behaviors taken in the previous period. To illustrate the implications of this assumption, let the ”true” health production function be given by
Hit
=
k0+
k1Bit−1+
k2Bit−2+
...+
kTBit−T −θEi+
εit(4)
6The price of the bundle of goods affecting health, which include risky health behaviors B, is normalized to one.
where we assume again stationarity in the coefficients. This function is more general than (1) because current health depends both on behaviors lagged once and on all previous lags from (t
−2) to the initial period
T. Using the instantaneous utility function of the example above and ignoring again the price vector
p,the discount factor and the vector
X, a linear approximation of optimal behaviors is given byequation (2) which combined with (4) yields
Hit
= [k
0+
σ0(k
2+
...+
kT)] +
k1Bit−1+ [σ
1(k
2+
...+
kT) +
θ]Ei+
υit(5)
where
υit=
εit+
T
X
s=2
ksηit−s.
When the health production function depends on the entire sequence of risky health behaviors, from period 1 to
T, the contribution of behaviors lagged once to the educa- tion gradient is
[σ σ1k11(k1+k2+...+kT)+θ]
, where the denominator includes both the effect of education on health conditional on behaviors
θand the mediating effects of behaviors.
This contribution differs from the contribution of the entire sequence of health behav- iors from lag 1 to
T, which is given instead by
[σσ1(k1+k2+...+kT)1(k1+k2+...+kT)+θ].
If the parameters
kiare positive, ignoring the contribution of higher lags leads to an underestimation of the overall mediating effect of risky health behaviors.
When the available data do not include information on behaviors from lag
t−2 to lag
T, as it happens in our case, an alternative approach is to adopt the dynamic health equation (see for instance Park and Kang (2008))
Hit
=
d+
πBit−1+
νEi+
φHit−1+
eit(6) which requires data only for periods
tand
t −1. Under the additional assumptions that
Ht−T= 0, φ < 1 and
T → ∞, equation (7) is equivalent to equation (4) whenthe following restrictions on the parameters hold
k1
=
π; k2=
πφ; ; ks=
πφs−1∀s= 3, . . . , T ;
θ=
ν1
−φ;
k0=
d1
−φ;
εit=
eit1
−φSince equation (6) can be written as equation (4) and we retain the same instanta- neous utility function, the linear approximation of optimal health behaviors in equation (2) is unchanged.
7Plugging this approximation into (6), we obtain
Hit
=
d+
φπσ01
−φ+
πBit−1+
ν
+
φσ1π1
−φ
Ei
+
eit(7)
7We ignore again prices, the vectorX and the discount factor.
where
eit=
T−1
X
k=0
φkεit−k
+
πT−1
X
k=1
φkηit−k−1
. Furthermore, plugging
Bit=
σ0+
σ1Ei+
ηitinto (7) yields the ”reduced form” health equation
Hit
=
χo+
χ1Ei+
eeit(8) where
χo=
πσ1−φ0+d,eeit=
T−1
X
k=0
φk
(ε
it−k+η
it−k−1) and
χ1=
πσ1−φ1+νis the education gradient
HEG.The relative contribution of health behaviors in the immediate past
Bit−1to the education gradient (short-run mediating effect,
SRM E) is
SRM E
= (1
−φ)πσ1(πσ
1+
ν)(9)
The overall relative contribution of health behaviors (or long-run mediating effect,
LRM E) to the education gradient adds to the contribution of health behaviors in theimmediate past the contribution of previous behaviours, from
t−2 to
t−T,and is equal to
LRM E
=
πσ1(πσ
1+
ν)(10)
This implies that
SRM E= (1
− φ)LRM E. Under these assumptions, for any φ >0,
SRM Eunder-estimates
LRM E, and the degree of under-estimation is larger the higher is
φ(persistence of health status over time). Therefore, if we only estimate
SRM E, we may find a small contribution of health behaviors to the overall educationgradient not because health behaviors have a small mediating effect but because we have ignored the contributions of health behaviors from period
t−2 to
t−T.
83.2 Estimating the Short-Run and Long-Run Mediating Ef- fects
One of the aims of this paper is to provide estimates of
SRM Eand
LRM E. Our empirical strategy is based on the estimation of the parameters of both the dynamic
8If the overall education gradient is negative and the indirect effect has the same sign, sufficient conditions for the indicator LRM E (SRM E) to fall within the range [0,1] are πσ1 ≥0 and ν ≥0 (φπσ1+ν≥0). If the gradient is positive and the indirect effect has the same sign, these conditions also change sign. Conversely, if the education gradient and the indirect effect have opposite signs, the conditions areπ(2−φ)σ1+ν >0 if the education gradient is negative andπ(φ−2)σ1−ν >0 if the gradient is positive.
health equation (6) and the ”reduced form” health equation (8). Using these estimates, we can compute
dπσ1
=
χb1(1
−φ)b −bν(11) and
LRM E\
=
χb1(1
−φ)b −bνχb1
(1
−φ)b(12)
SRM E\
= (1
−φ)b LRM E\(13) This strategy has the advantage that it only requires the estimation of two equations and the drawback that we cannot separately identify the mediating effect of each single health behavior. For that, we would need to estimate also equations such as (2) for each available behavior. We leave this development to future research.
4 The Empirical Strategy
We start this section with the following assumptions on the error terms
ein the dynamic health equation (6) and
ηin the behavior equation (2).
Let
Xbe the set of observed exogenous or pre-determined covariates
eit
=
fi+
ξit;
ηit=
gi+
ζit(14) (ξ
it, ζit)
⊥(ξ
ik, ζik) for all
j 6=k | fi, gi, X, Ei, Bit(15)
E
[ξ
it|fi, gi, X, Ei, Bit] = 0
E[ζit|fi, gi, X, Ei, Bit] = 0 (16)
E
[f
i|Ei]
6= 0 E[fi|Bit]
6= 0(17)
E[fi|Hit−1]
6= 0E[gi|Ei
]
6= 0(18)
In words, each error term is composed of a time invariant individual effect (ei-
ther
for
gin equation (14)) and a strictly exogenous transitory serially uncorre-
lated effect (either
ξor
ζ), conditional on the individual time invariant effect. Ed-ucation, behaviors and lagged health are correlated to the unobservables
eand
ηonly via their correlations with the individual effects
fand
g, i.e. we do not as-sume that these effects are independent of
Ei, Bit, Hit−1. In our set-up, individ- ual effects could be regarded as random without loss of generality given that we are interested in partial regression coefficients holding these individual effects con- stant. We regard (H
it, Ei, Bit, Hit−1, X, fi, gi) as a random sample from an artifi- cial multivariate population with joint distribution
p(Hit, Ei, Bit, Hit−1, X, fi, gi) =
p(Hit|Ei, Bit, Hit−1, X, fi, gi)p(E
i, Bit, Hit−1, X, fi, gi) and focus on the conditional dis- tribution of
Hit.
Since optimal education depends on the unobservables that affect preferences (η) and the health production function (e) - see the illustrative example in the Appendix - ordinary least squares estimates of the health production function fail to uncover causal relationships. A similar problem affects the OLS estimates of the ”reduced form” health function, because health in that equation depends both on education and on the sequence of shocks affecting preferences and the health production function (see equation (8)). An important drawback of the empirical studies investigating the mediating effect of health behaviors on the education gradient is that they fail to consider the endogeneity of education and behaviors (Lochner, 2011). In this paper, we address these problems in an attempt to give a causal interpretation both to the gradient and to the mediating role of behaviors.
In the past few years, several papers have estimated the causal effect of educa- tion on health using the exogenous variation in educational attainment generated by compulsory schooling laws. This instrumental variables (IV) approach can be used to estimate the ”reduced form” health equation (8). In principle, the same approach can also be applied to the dynamic health production function (6), provided that we can find additional credible sources of exogenous variation which affect risky health behaviors without influencing individual health (conditional on behaviors). This is a very difficult task with the data at hand.
9Therefore, we turn to the identification strategy suggested by Card and Rothstein (2007), which combines aggregation, selec- tion on observables and fixed effects assumptions, to estimate both the dynamic health production function and the ”reduced form” health equation. For the latter equation, we compare the results obtained following the Card and Rothstein (2007) approach to those obtained with the IV approach, using changes in compulsory education as the relevant instrument. In the rest of this section, we illustrate the two approaches in turn.
9Using instruments such as the price of alcohol or cigarettes does not work in our setup because these variables influence all cohorts in one country alike.
4.1 The Card-Rothstein approach
Consider the following empirical version of the dynamic health production function
Hicgbt=
αg0+
αg1Bicgb(t−1)+
αg2Eicgb+
αg3Xicgb+
αg4Hicgb(t−1)+
feicgb+
ξicgbt(19) where
Xis a vector of controls,
idenotes the individual,
cthe country,
tcalendar time,
ggender (M : males;
F: females),
bthe birth cohort and we allow each explanatory variable to have a gender-specific effect on health.
Following Card and Rothstein (2007), we can decompose the error term in equation (19) as follows
feicgb
+
ξicgbt=
fcgb+
ξcgbt+
icgbt(20)
where
fcgb+
ξcgbtrepresents a common error component for individuals of the same gender
gand birth cohort
bin country
cat time
t, and icgbtis an individual-specific idiosyncratic error component for which we assume
E[icgbt|b, g, c, t] = 0
(21)
The individual-specific error term has mean zero across individuals of the same gender, year of birth, country and time period.
We aggregate individual data into cells identified by country, time, birth cohort and gender and define
αs=
αF s−αM s, with
s= 0, .., 3. Taking gender differences for each cell (∆ =females - males), we obtain
∆H
cbt=
α0+
αM1∆B
cb(t−1)+
α1Bcb(t−1)F+
αM2∆E
cb+
α2EcbF+
αM3∆X
cb+
α3XcbF+
+α
M4∆H
cbt−1+
α4Hcbt−1F+ ∆f
cb+ ∆ξ
cbt(22)
where the superscript
Frefers to females. In this specification,
αM1and
α1+
αM1are the effects of health behaviors lagged once for males and females respectively.
Similarly, the gender gap in the ”returns” to education is given by coefficient
α2. Assumptions (14) to (18) guarantee that the vector [∆B, B
F,∆E, E
F,∆H
−1, H−1F] is orthogonal to ∆ξ
cbt.
10Differencing by gender eliminates all unobserved factors that
10To avoid confusion, we stress that ∆ξcbt is the difference betweenξcbF t andξcbM t, not the differ- ence betweenξcbF t (ξcbM t) andξcbF t−1(ξcbM t−1), i.e. we are taking differences between genders in a given calendar time not differences within gender over time.
are common to males and females for a given country
cand birth cohort
b, includ-ing genetic and environmental effects, income components, medical inputs and the organization of health care.
11Even after eliminating common unobservables, how- ever, the residual error component ∆f
cbcould still be correlated with education and lagged health behaviors. This could happen, for instance, if health conditions and parental background during childhood differ systematically by gender or if labor mar- ket discrimination affects individual income and access to health care, conditional on educational attainment. To remove this correlation, we model this residual as
∆f
cb=
ψb+
ψc+
ψM1∆Z
cb+
ψ1ZcbF+
ψM2∆Y
cb+
ψ2YcbF+
κcb(23) where
ψs=
ψF s−ψM s, with
s= 1, 2,
ψbincludes cohort dummies and country- specific linear or quadratic trends in birth cohorts,
ψcis a vector of country dummies,
Za vector of observables, which includes a rich set of parental background character- istics and health conditions during childhood
12and
Yis real income. Our identifying assumption is that, conditional on these variables which capture gender-specific ge- netic and environmental effects, the error term
κcbis orthogonal to levels and changes in health behaviors and educational attainment.
13For the sake of brevity, we call this method
ADS(aggregation cum differentiation cum selection on observables). To illustrate, suppose that the key unobservable in (19) is the latent time invariant (cell) average ability. The
ADSmethod assumes that part of this latent factor is common across genders and can be differenced out.
14The residual gender-specific component is captured by cohort and country dummies as well as by gender differences in parental background during childhood and initial health conditions. Conditional on our identifying assumptions, equation (22) is estimated by weighted least squares, using as weight
1 NM
+
N1F
−1
, where
NMand
NFare the number of males and females in each cell, as suggested by Card and Rothstein (2007).
11See Zweifel and Breyer (1997).
12There is a growing literature on the impact of childhood health on adult economic outcomes (Banks et al. (2011) or Smith (2009)). The vectorZincludes: childhood poor health, hospitalization during childhood, presence of serious diseases, had at most 10 books at home at age 10, mother and father in the house at age 10, mother or father died during childhood, number of rooms in the house at age 10, had hot water in the house at age 10, parents drunk or had mental problems at 10, had serious diseases at age 15, born in the country.
13The inclusion of cohort and country dummies in (23) implies that cohort and country effects differ by gender. In case of no gender differences in any of the above factors ∆fcb≡κcb.
14With respect to the standard fixed effect model set-up we are assuming that the conditional distribution of the individual fixed effect given (Ei, Bit, Hit−1, X) is common between genders. Other than this the conditional distribution is left unrestricted and the inference is conditional on this effect.
4.2 The IV approach
As an alternative approach, we also estimate the ”reduced form” health equation (8) by instrumental variables, using as instrument for endogenous education the number of years of compulsory education
Y C. This is widely considered to be a credibleidentification strategy, and one that has been extensively used in the literature (see Lochner (2011) for a review). As in Brunello, Fort and Weber (2009), Brunello, Fabbri and Fort (2009) and Fort et al. (2011), we apply this strategy to a multi-country setup and exploit the fact that school reforms have occurred at different points in time in several countries.
For each country and reform included in our sample, we construct pre-treatment and post-treatment samples by identifying for each reform the pivotal birth cohort, defined as the first cohort potentially affected by the change in mandatory school leaving age.
We include in the pre- and post-treatment samples all individuals born either before, at the same time or after the pivotal cohort. By construction, the number of years of compulsory education
Y C“jumps” with the pivotal cohort and remains at the new level in the post-treatment sample. The timing and intensity of these jumps varies across countries, and we use the within country exogenous variation in the instrument to identify the causal effects of schooling on health.
We include in equation (8) country fixed effects, cohort fixed effects and country- specific linear or quadratic trends in birth cohorts. These trends account for country- specific improvements in health that are independent of educational attainment.
15On the other hand, country fixed effects control for national differences both in reporting styles and in institutions affecting health. Notice that the older cohorts in our data are healthier than average, having survived until relatively old age. Since the comparison of positively selected pre-treatment individuals with younger post-treatment samples is likely to result in a downward bias in the estimates, we control for this selection process by including cohort fixed effects.
5 Data
The estimation of the ”reduced form” and the dynamic health equation requires data on health outcomes, risky health behaviors, education, parental background and early socio-economic and health conditions. The Survey of Health, Ageing and Retirement in Europe (SHARE), the English Longitudinal Study of Ageing (ELSA) and their retro- spective interviews satisfy these requirements. SHARE is a longitudinal dataset on the
15”Failure to account for secular improvements in health may incorrectly attribute those changes to school reforms, biasing estimates toward finding health benefits of schooling.” (Lochner (2011), p.41)
health, socio-economic status and social relations of European individuals aged 50+, and consists of two waves - 2004/5 and 2006/7 - plus a retrospective wave in 2008/9 (SHARELIFE), covering several European countries - Austria, Belgium, Switzerland, Denmark, Spain, France, Germany, Italy, Greece, The Netherlands and Sweden.
16ELSA has similar characteristics and covers England.
17Since education is typically accumulated in one’s teens or twenties, by focusing on individuals aged 50+ we are considering the long-run effects of education on health.
The measure of health used in this paper is self-reported poor health (SRP H), a dummy equal to 1 if the individual considers her health as fair or poor and to 0 if she considers it as good, very good or excellent. This is a subjective and comprehensive measure of health, which is conventionally used in the applied literature (Lochner, 2011). One may object that self-reported information is likely to be dominated by noise and to fail to capture differences in more objective measures of health.
18This is not the case here: among the individuals in the sample who reported poor health, 46% had hypertension, 69% had cardiovascular diseases and 79% suffered some long- term illness. On average, they had 2.44 chronic diseases (certified by doctors). In contrast, the percentage of individuals in good health with similar diseases was 28, 44 and 33 percent, respectively.
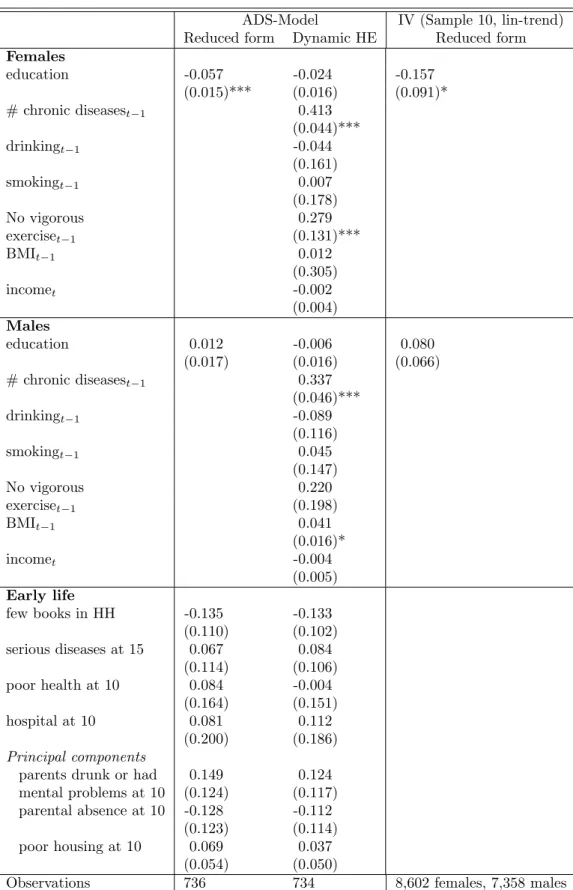
19Moreover, the latter group experienced only 1.10 chronic diseases. While our data contain information on chronic diseases, which can be argued to be more objective than self-reported health, we have chosen to focus on the latter in order to be able to compare our results with the bulk of estimates in the relevant literature. However, we also present in the robustness section of this paper estimates based on the number of chronic diseases.
20We measure educational attainment with years of education. The second wave of SHARE provides information on the number of years spent in full time education. In the first wave, however, participants were only asked about their educational quali- fications. Thus, for the individuals participating only in the first wave, we calculate their years of schooling using country-specific conversion tables. In ELSA, years of education are computed as the difference between the age when full-time education was completed and the age when education was started.
16The Czech Republic, Poland, Israel and Ireland joined in the second wave.
17For England, we use waves 2 (2004/5) and 3 (2006/7).
18For an early discussion about the importance of measurement error in self-reported health see Bound (1991) and Butler et al. (1987) as well as Baker et al. (2004). These authors were primarily concerned with the impact of measurement error in equations determining the impact of health on retirement and other labor market outcomes. Justification bias, i.e. non-working persons over- reporting specific conditions, is an obvious problem there.
19Heiss (2011) finds strong autocorrelation in self-reported health across waves and a strong corre- lation with future mortality for the Health and Retirement Study.
20Using the same dataset, we discuss at length how the education gradient varies with different measures of health in a companion paper (Brunello et al., 2011).
We have four measures of risky health behaviors: whether the individual is currently smoking, whether he or she drinks alcohol almost every day, whether he or she refrains from vigorous activity and the body mass index (BM I). These risk behaviors are among the seven listed by the World Health Organization as the most important factors affecting individual health - the remaining three being low fruit and vegetable intake, illicit drugs and unsafe sex.
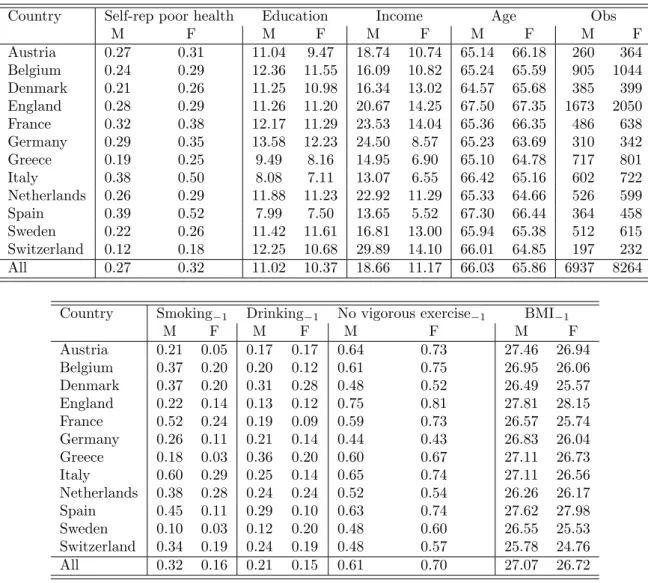
Table 1 reports the country averages of the health outcome
SRP H, years of edu-cation and annual income (thousand euro at 2005 prices, PPP) in 2006, as well as the means of the four health behaviors (in 2004), separately by gender. There is important cross-country and cross-gender variation, both in the outcome and in health behav- iors. As expected, both income and years of education are higher among males aged 50+ than among females of the same age group. The percentage of females reporting poorer health is higher than the percentage of males (32 versus 27 percent). Females are less likely to smoke and drink than males. They have a slightly lower body mass index (26.7 versus 27.1) and tend to exercise vigorously more often than males.
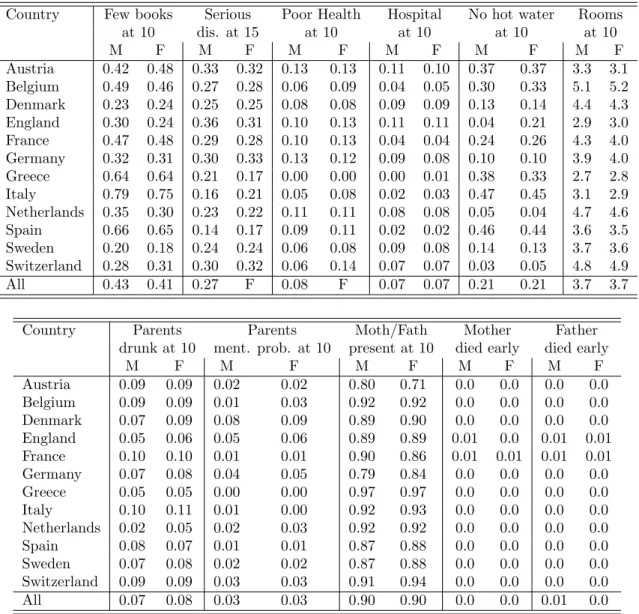
Table B.1 in the Appendix reports the country averages of the parental background variables included in the vector
Z. The table shows that there is important varia-tion both across countries and by gender. For instance, the percentage of individuals with less than 10 books in the house at age 10 ranges from 79% in Italy to 18% in Sweden. The gender gap is particularly relevant in England, where this percentage is 30% for males and 24% for females. Furthermore, the percentage of individuals who was in poor health at age 10 was 9% among Spanish males and 11% among Spanish females. There is less variation between genders in the parental background and hous- ing characteristics: we interpret this as suggestive evidence that parental background characteristics are substantially removed by gender differencing, since - within country and cohort - they are largely common between males and females, on average.
As discussed above, we use the ADS approach to estimate the dynamic health equation (6) and both the ADS and the IV approach for the ”reduced form” equation (8). The estimation of the dynamic health equation requires information on the current and the previous period. The two waves of SHARE and ELSA used in this paper include individuals who appear in both waves and individuals who are interviewed only in a single wave. We compute cell averages at time
tand
t −1 by using all individuals rather than the longitudinal subsample. Each cell is defined by gender, country, wave and semester of birth. We use semesters rather than years to increase the number of available cells in the estimation
21, and retain those cells that include at
21Since we do not have information on the month of birth for England, we aggregate by year of birth for this country.
least two observations. We use data from 12 countries, all of which have participated in at least two waves in the surveys.
We implement the IV approach by selecting 7 countries where the individuals in our sample experienced at least one compulsory school reform: Austria, Denmark, Eng- land, France, Italy, the Netherlands and the Czech Republic.
22A short description of the compulsory school reforms used in this paper can be found in Appendix C. Since the ”reduced form” equation (8) is static, we can use individuals who participated in both waves and those who participated in either the first or the second wave. When available, we measure the key variables (health, education) using the information pro- vided by individuals during their second interview. For those who did not participate to the second wave, we use the first wave.
6 Results
This section describes the results of our empirical analysis and is organized as follows:
first, the baseline estimates of the ADS model for the ”reduced form” and the dynamic health equation are presented. Next, we discuss in Section 6.2 the reduced form esti- mates based upon the IV approach. Finally, the ADS estimates of the ”reduced form”
health equation are compared to the IV results (Section 6.3). Section 6.4 concludes with several robustness checks.
6.1 Baseline Estimates of the Reduced Form and Dynamic Health Equations
As reviewed in Section 2, most of the earlier contributions to this literature fail to consider the endogeneity of education and health behaviors in their health regressions.
For the sake of comparison with this literature, we start the illustration of our empirical findings with the estimates of the ”reduced form” and dynamic health equations based on micro data. We use a linear probability model, treat education and behaviors as exogenous, and regress self-reported poor health on years of education and a vector of variables, which varies according to whether we consider the ”reduced form” or the dynamic health equation and we include parental and early life controls or not.
For each regression, we pool males and females but allow for the full set of interac- tions of each explanatory variable with a gender dummy. Preliminary testing suggests
22The inclusion of the last country is possible because the estimation of the ”reduced form” health equation does not require two waves per country. We exclude Germany and Sweden because school reforms in these countries were implemented at the regional level and our information on the region
that we cannot reject the null hypothesis that cohort, country, time and early life effects do not vary by gender.
23We therefore report only those parsimonious results.
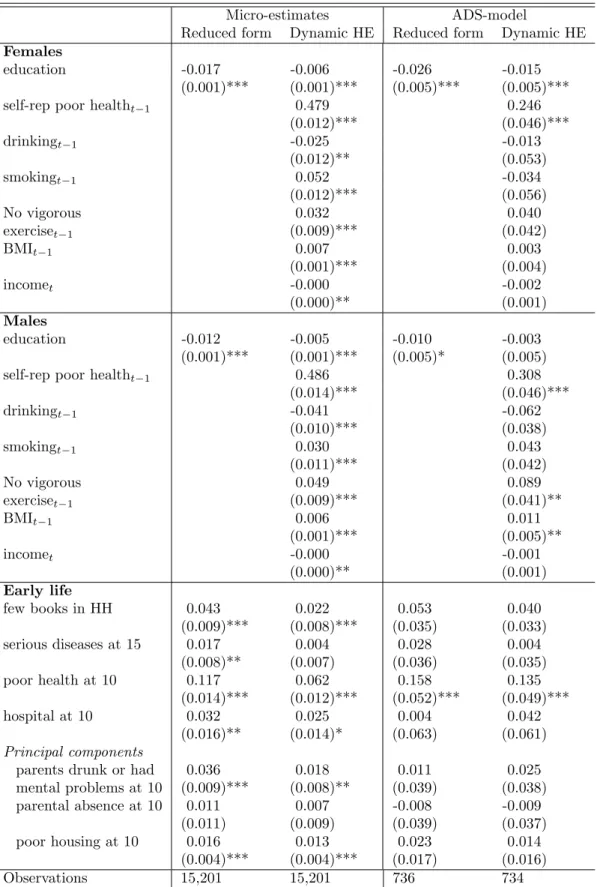
Table (2) is organized in two columns, one for the ”reduced form” and the other for the dynamic health equation, which includes health behaviors lagged once, the first lag of health and current income.
In the ”reduced form” equation the marginal effect of one additional year of schooling on poor health is equal to
−0.012 for males and to −0.017 for females, a relativelysmall effect when compared to the existing literature for Europe, which points to an effect in the range
−0.026 to −0.081 (Lochner (2011), Table 6). This difference can beexplained, at least in part, if the education gradient declines with age, given that our sample consists of individuals aged 50+ and the samples used in the literature typically include also younger individuals. Coefficients of parental and early life conditions, including poor health at age 10, are statistically significant and point in the expected direction: poor health conditions at 10 or 15 as well as poor parental environments at early ages increase self-perceived poor health at age 50+. Importantly, the inclusion of these variables reduces the gradient by 15 to 20 percent with respect to a more parsimonious specification without those (not shown in the table), which suggests that they capture at least in part the positive correlation between educational attainment and unobserved individual effects such as ability and initial health.
Turning to the dynamic health equation with early life variables, we find that our measures of risky health behaviors have statistically significant coefficients, with pre- dictable correlations: smoking, refraining from vigorous activity and poor diet leading to higher BMI are positively related to self-perceived poor health. Somewhat unexpect- edly, however, drinking alcohol almost every day is negatively related to self-reported poor health. Annual real income is negatively associated to perceived poor health, which exhibits important persistence over time - the lagged dependent variable has a coefficient close to 0.5 but is statistically distinct from 1.
Adding health behaviors, income and lagged health reduces the coefficient of ed- ucation from
−0.012 to −0.005 for males, and from −0.017 to −0.006 for females.Assuming that the returns to education for the sample of countries under study is equal to 0.07
24, the estimated mediating effect of behaviors lagged once is 9.7% for males and 16.8% for females - see Table 3. In the long run, when we include the effect of earlier health behaviors, the mediating effect almost doubles to 18.9% for males and
23The joint hypothesis is not rejected at the 5 percent level of confidence (p-value: 0.094). We tested separately also the null that the following effects are common between genders: cohort effect (p-value:
0.894), country effect (p-value: 0.42), background variables (p-value: 0.263), trends (p-value: 0.112) and we never reject the null at conventional significance levels.
24See for instance the estimates in Brunello, Fort and Weber (2009). Adding income to equation (6) implies thatLRM E is equal to πσ1
(πσ1+ν+qρY), whereq is the coefficient of income in the dynamic health equation,ρis the estimated return to education andY is average income.
32.3% for females, suggesting that considering only their first lag may substantially underestimate the contribution of health behaviors to the education gradient. Our estimated long-run effects are smaller than those found by Cutler et al. (2008), who use a different approach but conclude that measured health behaviors account for over 40% of the education gradient (on mortality) in a sample of non-elderly Americans.
25Although the inclusion of parental and early life controls in our regression is likely to attenuate the correlation between education, health behaviors and unobservables, there is no guarantee that this correlation will disappear entirely. In order to identify the causal impact of education on health and behaviors, we apply the
ADSprocedure discussed in Section 4.1, which combines aggregation and gender differentiation with selection on observables. The specification tests carried out on the micro data suggest that cohort, country and early life effects do not differ significantly by gender. As a consequence, when we take gender differences of cell data, these common effects are removed together with common unobservables. Therefore, our preferred specification of the
ADSmodel includes only differences in early life variables and excludes common country and cohort dummies and common trends in birth cohorts.
26Our results for the
ADSmodel are shown on the right-hand side of Table 2, both for the ”reduced form” and for the dynamic health equation. When we consider the former, we find that the overall effect of education on poor health is negative and larger in absolute values for females (−0.026) than for males (−0.010). Parental and early life variables are jointly statistically significant (p-value: 0.009), mainly because of the gender differences in poor health at age 10. Turning to the dynamic health equation, we find that the effect of education conditional on behaviors is much smaller (−0.015 for females and
−0.003 for males) than in the ”reduced form”. While the precision of theestimates of the effects of behaviors declines in the cell data with respect to the micro data, we cannot reject the null hypothesis that these effects are jointly statistically significant. Finally, income effects are insignificant and the persistence of self-reported poor health over time is substantially reduced with respect to the estimates based on micro data.
Aggregation and differentiation increases the absolute value of the overall education gradient for females from 0.017 to 0.026 but has limited effects on the gradient for males, which marginally declines in absolute value from 0.012 to 0.010. The short-run and the long-run mediating effects of health behaviors are also affected. As shown in Table 3, when compared to the estimates based on micro data, the long-run mediating effect for males declines in absolute value (from 0.007 to 0.004) but increases as a
25These authors estimate a static health equation, which includes income and occupation among the explanatory variables, and use the following measures of health behaviors: current smoker, ever smoker, number of cigarettes per day, obesity, regular exercise and use of seat belts always.
26
share of the gradient (from 18.9 to 44.5%). The opposite happens for females, for whom this effect increases in absolute value from 0.005 to 0.006 but declines as share of the gradient (from 32.3% to 22.8%).
In sum, when we explicitly take into account the endogeneity of education and health behaviors, we find that the long-run mediating effect of the latter ranges between 23 and 45% of the total education gradient. While the effect of education on behaviors accounts for an important share of the gradient, much remains to be explained, either by the role played by unmeasured behaviors or by effects that do not involve behaviors, such as better decision making, stress reduction and more health-conscious peers.
6.2 IV Estimates of the Reduced Form Health Equation
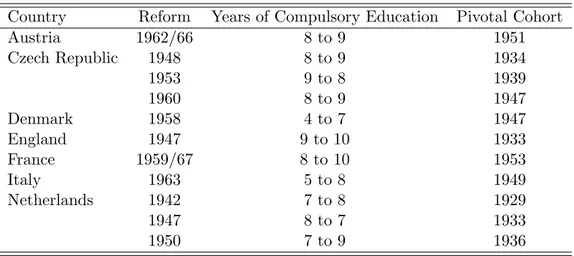
In this section, we present the estimates of the ”reduced form” health equation obtained using instrumental variables. We instrument education with the number of years of compulsory education, which varies across countries and cohorts because of compulsory schooling reforms. For each country, we construct a sample of treated individuals, who have experienced a change in compulsory education, and a control sample, with no change in compulsory schooling. Since our data include only individuals aged 50+, we need to focus on school reforms which took place between the 1940s and the 1960s, and to restrict our attention to a sub-sample of 7 countries affected by these reforms.
Table 4 shows the selected countries, the years and the content of the reforms as well as the pivotal cohorts, i.e. the first cohorts potentially affected by the reforms (see Appendix C for a short description of the education reforms used in this paper).
In order to ensure that individuals spent their schooling in their host country, we restrict our sample to individuals, who participated in the first or second wave of SHARE (second or third wave in ELSA), and were born in the country or migrated there before age 5. Additionally, we control for country fixed effects, cohort fixed effects as well as for some individual characteristics (whether the individual is foreign-born, whether there was a proxy respondent for the interview and indicators for the interview year). We capture smooth trends in education and health by adding country-specific polynomials in cohorts. In particular, we estimate two specifications, one with a linear trend and one with a quadratic trend.
Since the key identifying assumption that changes in average education within coun-
try can be fully attributed to the reforms is more plausible when the window around
the pivotal cohort is small, we estimate our model using two alternative samples, one
including individuals who were born up to 10 years before and after the reforms and
another where the relevant window is +7,-7. The two samples consist of 15,960 and
12,294 individuals respectively. Table 5 shows summary statistics by country for the larger sample.
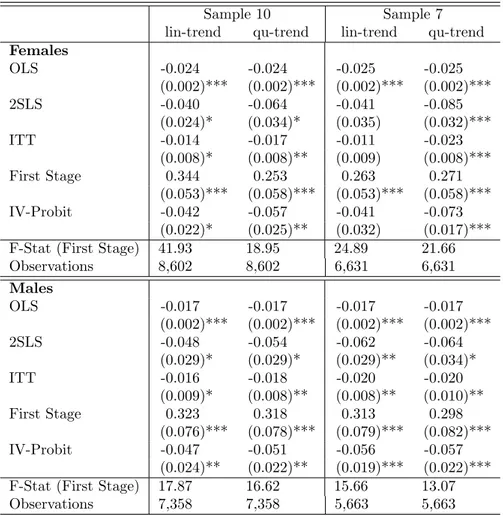
Table 6 presents our estimates of the health-education gradient for both males and females. We report the OLS, 2SLS, ITT (Intention-To-Treat), first stage and IV-Probit estimates for both samples, using two alternative specifications for the country-specific trends (linear or quadratic). The OLS estimate of the gradient is equal to
−0.017 formales and to
−0.024 or −0.025 for females, depending on the selected window. Theestimated magnitude of the gradient increases with instrumental variables: we find that one additional year of schooling decreases the probability of poor health by 4
−9 percentage points for females and by 5
−6 percentage points for males, depending on the selected window. IV-Probit estimations yield very similar results. The IV strategy works well: our first stage regressions show that the instrument is relevant and not weak (F-Statistics between 13 and 41) and that one additional year of compulsory schooling increases actual schooling by a quarter to a third of a year, broadly in line with previous findings in the literature using similar identification strategies. We interpret the IV estimates as Local Average Treatment Effects, i.e. the effects of schooling on health for the individuals affected by the reforms. These individuals typically belong to the lower portion of the distribution of education.
6.3 IV and ADS Results Compared
Next, we compare the education gradients estimated with the IV and the ADS ap- proaches (Table 7). For the IV approach, we report the estimates with the linear trend specification and the largest window (±10). We find that education reduces self-perceived poor health by 4 and 4.8 percentage points for females and males re- spectively. The ADS approach yields smaller estimates - in absolute value - for females (2.6 percentage points) and especially for males (1 percentage point).
Since the two approaches are based on a different set of countries and cohorts, we
re-estimate the ADS model for the same sample used in the IV approach. The results
are shown in the last column of Table 7. The magnitudes of the ADS estimates in this
new sample increase somewhat, to 2.8 percentage points for females and to 2 for males,
but remain smaller in absolute value than the IV estimates. To explain this difference,
we notice that, while IV estimates are Local Average Treatment Effects, i.e. the causal
effects of education on health for the individuals affected by the compulsory schooling
reforms, the estimates obtained with the ADS approach pertain to a randomly drawn
individual from the entire sample. If the protective effect of education on health is more
pronounced for persons with lower education, this could explain the higher magnitudes
obtained with the IV approach.
6.4 Robustness Checks
In this section, we focus on the ADS approach and consider several robustness checks.
We start by collapsing data by gender, country and year rather than semester of birth.
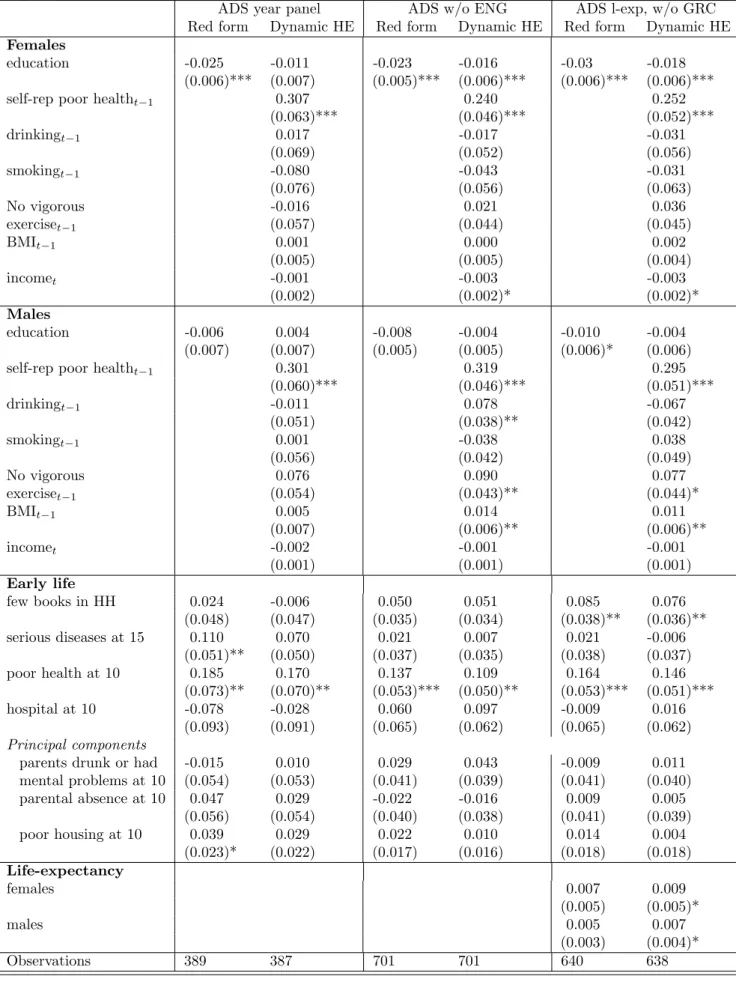
By doing so, we reduce the sample size by almost a half. As shown in the first two columns of Table 8, the effect of education on health is virtually unaffected for females but declines for males. Next, we omit England to take into account that English data are drawn from a different (although quite similar) survey and can only be collapsed by year of birth. The next two columns of Table 8 show that the education gradient changes only marginally. However, when we decompose the gradient into the effect mediated by behaviors and the residual effect, we find that the
LRM Ein this sub- sample is smaller than in the full sample, and is equal to 8.5% and 11.1% of the gradient for females and males respectively.
27Furthermore, we notice that the older cohorts in our data are strongly selected by mortality patterns.
28To control for this, we add to the regressions the level and the gender difference of life expectancy at birth, which vary by country, gender and birth cohort. Since these data are not available for Greece
29, we are forced to omit this country from the sample. As displayed by the last two columns in the table, life expectancy is never statistically significant in the ”reduced form” health equation, and only marginally significant (at the 10% level of confidence) in the dynamic health equation. We conclude that adding this variable does little to our empirical estimates.
We also run our estimates for the sub-sample of individuals aged 50 to 69 and find that one additional year of schooling reduces self-reported poor health by 11.5% for males and by 22.4% for females. These percentages are closer to those found in the literature. Since survivors aged 70 to 86 might be better educated and might experience a stronger protective role of education on health than the average individual in the same age group - i.e. they might have a higher education gradient - it is unlikely that the decline of the gradient with age is driven by selection effects.
One may think of several factors affecting changes in the education gradient by age group. On the one hand, the gradient could decline among older individuals because cognitive abilities decline with age. On the other hand, the effect of behaviors on health accumulates over time, which should increase the gradient with age. At the
27We have also estimated our equations on two sub-samples of countries, based on their proximity to the Mediterranean Sea, but cannot reject the hypothesis that the estimated coefficients are not statistically different.
28Age in our sample ranges from 50 to 86.
29We use data on life expectancy at birth from the Human Mortality & Human Life-Table Databases. The databases are provided by the Max Planck Institute for Demographic Research (www.demogr.mpg.de). The data are missing for some cohorts and for Greece. We use period mea- sures of life expectancy at birth since cohort measures are not available for all the cohorts considered in the study.