Tri-Criterion Modeling for Constructing More-Sustainable Mutual Funds
Sebastian Utz Department of Finance University of Regensburg 93040 Regensburg, Germany
Maximilian Wimmer Department of Finance University of Regensburg 93040 Regensburg, Germany
Ralph E. Steuer Department of Finance
University of Georgia Athens, GA, 30602-6253, U.S.A.
Abstract
One of the most important factors shaping world outcomes is where investment dollars are placed. In this regard, there is the rapidly growing area called sustainable investing where environmental, social, and corporate governance (ESG) measures are taken into account. With people interested in this type of investing rarely able to gain exposure to the area other than through a mutual fund, we study a cross section of U.S. mutual funds to assess the extent to which ESG measures are embedded in their portfolios.
Our methodology makes heavy use of points on the nondominated surfaces of many tri-criterion portfolio selection problems in which sustainability is modeled, after risk and return, as a third criterion. With the mutual funds acting as a filter, the question is: How effective is the sustainable mutual fund industry in carrying out its charge? Our findings are that the industry has substantial leeway to increase the sustainability quotients of its portfolios at even no cost to risk and return, thus implying that the funds are unnecessarily falling short on the reasons why investors are investing in these funds in the first place.
1 Introduction
Sustainable investment, which is an umbrella term for what is known in various circles as sustainable and responsible investment, socially responsible investment, or environmental, social, and corporate governance (ESG) investment, is perhaps the fastest growing area in the mutual fund industry today. It is based upon the desire of many investors to only attempt the optimization of the risk–return tradeoff in a way that supports ethical corporate behavior and keeps an eye on the general social good. Such concerns in investing can be traced back to the Quakers who banned profits from the weapons and slave trade, and to the John Wesley sermon on
“The Use of Money” delivered according to Smith (1982) in 1744 whose message was “to not harm your neighbor through your investments.”1Layered on top of this, we have today the many more specific concerns about the treatment of animals, the use of sweatshops, global warming, and so forth. Along with ecological disasters such as Chernobyl, the Exxon Valdez, Fukushima-Daiichi, and Deepwater Horizon, interest has only grown in this category of investment.
Taking its cue from much of this, in 2006, the United Nations established its Principles of Responsible Investment (UN PRI) in collaboration with the investment industry, government, and representatives of the public. Institutional investors, by becoming signatories, are to commit themselves to integrating ESG issues into their investment decision-making and to developing ESG tools and metrics for use in their analyses. Also, the Principles seek academic research on ESG topics. As of this writing, the Initiative has over 1,300 signatories from over 50 countries (www.unpri.org/signatories/signatories/). Because of the popularity of the trend, virtually all major mutual fund firms in North America and Europe offer at least one sustainable mutual fund for ESG investors.
In general, mutual funds manage themselves in accordance with a two-stage process. The first stage is security selection. In this stage, all assets from some categorization (e.g., the S&P 500) are screened so as to be suitable for the fund at hand. In this way, the first stage narrows down the larger pool to a more workable number of securities in the form of anapproved list. The second stage is asset allocation. In this stage, the fund’s wealth is allocated to the securities on the approved list.
The difference between the way a sustainable mutual fund is managed and the way a conventional mutual fund is managed really only takes place in the first stage, where, in a sustainable fund, the assets are further screened for only those that meet certain standards of sustainability. Only by surviving these additional standards can
1Although Wesley never used those exact words, this kind of phrase is used in Wikipedia and other places on the Web to summarize the takeaway from that sermon.
an asset wind up on the approved list of a sustainable mutual fund. But after the approved list is complete, as demonstrated in Utz and Wimmer (2014), there is no evidence indicating that sustainability is further taken into account in the second stage. That is, under the banner that all sustainability concerns are taken care of in the first stage, the second stage of a sustainable mutual fund is carried out in the same way that a second stage is carried out in a conventional fund. In other words, in the second stage, a sustainable fund’s wealth is allocated to the securities on its approved list in the same way that a conventional fund would allocate its wealth to the same securities if faced with the same approved list.
Concerning the above two-stage process, there is no problem with the security selection first stage. This is normal and necessary to reduce all potential securities down to a list of securities that is suitable to invest in and can be monitored by the mutual fund over time, but we have strong reservations about the way the second stage is practiced in sustainable mutual funds. This is because, from the securities on an approved list, one cannot expect to find the portfolio that best balances variance, expected return, and sustainability, by finding the portfolio that best balances just variance and expected return, as this is, with sustainability assessments suspended, what is done in the second stage.
Thus, the purpose of this paper is to analyze the ability to increase the levels of sustainability (which we also refer to as “sustainability quotients”) possessed by the portfolios of sustainable mutual funds to more fully align the funds with the intentions of the sustainable investors who invest in them. This is in recognition that over and above the utility earned by the financial objectives of risk and return, sustainable investors gain additional utility from the non-financial objective of sustainability. Thus, delegating sustainability to only the first stage so that the second stage can be treated as standard is not enough. What is needed is a more integrated second-stage approach, one that, beyond the risk–return tradeoff, can handle the more complex risk–return–sustainability tradeoff which is the challenge of a sustainable mutual fund. This attracts us to the class of procedures such as suggested by Hallerbach, Ning, Soppe and Spronk (2004), Ben Abdelaziz, Aouni and El Fayedh(2007), Ballestero, Bravo, P´erez-Gladish, Arenas-Parra and Pl`a- Santamaria (2011) , Xidonas, Mavrotas, Krintas, Psarras and Zopounidis (2012), Hirschberger, Steuer, Utz, Wimmer and Qi (2013), Cabello, Ruiz, P´erez-Gladish and M´endez-Rodriguez (2014), and Calvo, Ivorra and Liern (2014) to better give us an integrated capability.
At this point, it is helpful to note that in standard bi-criterion portfolio selection there is the variance–expected return efficientfrontier, but with sustainability in- cluded, we now find ourselves in non-standard tri-criterion portfolio selection in which there is the variance–expected return–sustainability efficientsurface. Of the procedures just mentioned, we employ the one from Hirschberger et al. (2013) in
this paper. This is because it best gives us the tri-criterion efficient surface capability needed to explain and visualize our analyses and show how the sustainable mutual fund industry can, indeed, significantly increase its levels of sustainability.
Private investors would typically find it overburdening to construct a sustainable portfolio on their own, and therefore must rely on the mutual fund industry, but then there is the question about how much are we to trust in the label of a “sustainable mutual fund.” Utilizing a large sample of portfolios from conventional and sustain- able mutual funds, in this paper we investigate the meaningfulness of that label and whether asset managers of sustainable mutual funds do all they can to offer their funds with the highest possible levels of sustainability. In a nutshell, not inconsistent with P´erez-Gladish, M´endez-Rodriguez, M’Zali and Lang (2013) but by different means, the answer is “No” as our results show that there is in general considerable unused opportunity to increase the sustainability of a sustainable mutual fund’s portfolio without having to concede anything on risk or return. However, the reason it isunusedis probably because it is not well understood in the industry as it would take a good eye to spot the opportunity from the vantage point of the second-stage as currently practiced, but not from the method we propose. While our results are likely to be a let down to those who have been investing in sustainable mutual funds, the good news is that there is ample room for things to be done better in the future.
Continuing with the paper, in Section 2 we review the problem of tri-criterion portfolio selection and discuss our parametrization of the model. In Section 3 we correlate standard bi-criterion portfolio selection to our tri-criterion model and look at the nature of its “nondominated” surface. In Section 4 we discuss the large number of quadratically constrainedε-constraint programs that are solved for the experiments of the paper. In Section 5 we discuss the results of the experiments. In Section 6 we overview computer times, and in Section 7 we conclude the paper.
2 Model and Parametrization of Tri-criterion Portfolio Se- lection
We begin this section with a review of tri-criterion portfolio selection, mostly drawn from Hirschberger et al. (2013), which is at the heart of the paper. With a focus on a more robust second-stage model to explore the inherent variance–expected return–sustainability tradeoff, letnbe the number of assets obtained from the first stage in the form of an approved list,µ ∈Rnbe the vector of expected returns for the assets,Σbe then×ncovariance matrix of the returns on the assets,ν∈Rnbe the vector of the sustainability values ascribed to the assets, and`andω be the lower and upper bounds on each asset. With sustainability as the third criterion that it is, this then results in, as a much more appropriate second-stage model for a
sustainable mutual fund, the following tri-criterion portfolio selection formulation min{z1(x) =xTΣx} portfolio return variance (1.1) max{z2(x) =µTx} expected portfolio return (1.2) max{z3(x) =νTx} portfolio sustainability (1.3)
s.t. 1Tx=1 (1.4)
xi∈[`,ω]for alli (1.5)
in which anyxsatisfying (1.4) is aportfolio, and the set of allxsatisfying both (1.4) and (1.5) is the feasible regionS⊂Rn indecisionspace. Because of the three criteria, there is another version of the feasible region, that beingZ⊂R3 incriterionspace, whereZ={z|zi=zi(x),x∈S}. In criterion space, ¯z∈Z is nondominatediff there does not exist anx∈Ssuch thatz1(x)≤z1(x),¯ z2(x)≥z2(x)¯ andz3(x)≥z3(x)¯ with at least one of the inequalities being strict. The set of all nondominated criterion vectors is called the nondominated set and is designatedN.
In decision space, ¯x∈Sis anefficientportfolio iff its ¯zis nondominated. Now, with the above as the second-stage model for a sustainable mutual fund, sustainability plays a role inbothstages of the two-stage process.
To parameterize the model, the first task is to find measures that appropriately quantify the sustainability of a company in (1.3). Such measures should derive from all of the operations, processes, and projects of a company that have a sustainability impact. In spirit with the UN PRI, several independent sustainability rating agencies (e.g., Inrate, Asset4, KLD Research & Analytics) monitor the corporate landscape at the individual firm level regarding ESG issues.
Since our use of sustainability assessments is from Asset4, we now describe that agency’s database and the process by which a security’s sustainability rating is compiled. The database contains assessments of more than 4,700 firms over the period 2002 to 2013. The assessments are updated on a yearly basis, and we only use the updated assessments
The database covers almost all firms in the S&P 500, Russell 1000, and MSCI World index. The analysts of Asset4 review firms on a large number of what are calleddata points, each concerning a specific issue such as “Does the company have a policy regarding the independence of its board,” “Does the company have a policy to reduce emissions,” and so forth. The answers are grouped into 15 categoriessuch as product innovation, employment quality, emissions reduction, shareholder rights, and so forth. Then each category is mapped into asocial pillar, with the three pillars beingenvironment,social, andcorporate governance, standing for ESG.
We use the three social pillar scores as well as a composite ESG-score in our study as different measures for the sustainability of a firm. This is to function as a
double check on the generality of this paper. A composite ESG-score is constructed by weighting the three social pillars. In this paper, we use equal weights for our composite ESG-score. A more elaborate approach to consolidate categories using a method called Technique for Order of Preference by Similarity to Ideal Solution is presented in Ballestero, Pl`a-Santamaria, Bravo and Bernabeu (2014). The values of all four scores (E, S, G, and composite ESG) range from 0 and 1. A higher value indicates a higher level of sustainability.
In addition to the sustainability data, we obtain all available mutual fund portfo- lio holdings from the CRSP Survivor-Bias-Free US Mutual Fund Database between 1Jan02 and 31Dec13. The database contains the exact portfolio holdings of U.S.
mutual funds on certain so-calledreporting dates, which are often quarterly but could be annually. Whenever there is a change in the securities held in the portfolio of a mutual fund on a reporting date, that constitutes a new, distinct reporting-date portfolio. We then link each distinct reporting-date portfolio to monthly return data obtained from Thomson Reuters Datastream and to ESG-score data obtained from Asset4. Since our monthly return and ESG data do not cover all portfolios entirely, we disregard all portfolios in which less than 70% of total assets are covered by our data.2 Finally, we follow Utz and Wimmer (2014) and use a list provided by the US Social Investment Forum along with several keywords (‘Environment,’ ‘Ethical,’
‘Social,’ ‘Clean,’ ‘Green,’ ‘Sustainable’) to determine whether a given mutual fund is to be classified as a sustainable mutual fund or as a conventional mutual fund.
This causes us to wind up with 1,075 different reporting-date portfolios stem- ming from 76 different sustainable mutual funds and 54,579 different reporting-date portfolios stemming from 4,999 different conventional mutual funds, for a total of 55,654 reporting-date portfolios. Thus, for each sustainable mutual fund we have on average 14 different portfolio compositions, and for each conventional mutual fund we have on average 11 different portfolio compositions, for analysis. The mean coverage of our portfolios is 80.47% for sustainable mutual funds and 80.25% for conventional mutual funds. On average, each sustainable reporting-date portfolio consists of 124 securities, and each conventional reporting-date portfolio consists of 87 securities.
3 Comparison with Standard Portfolio Selection
Concerning the nondominated set, we note that there is confusion between opera- tions research and finance as people in finance typically call points in the nondomi- nated set “efficient,” for instance the term efficient frontier. However, henceforth
2Our analysis assumes that the part of a portfolio covered by our data represents an unbiased sample of the total portfolio.
40%
60%
0.005 0.01 0.015 2%
3%
4%
Var
E Ret
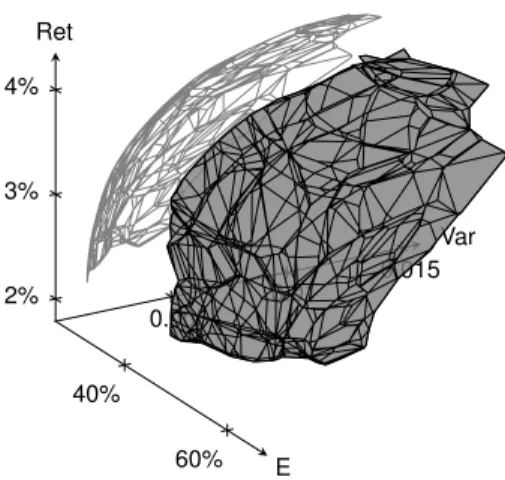
Figure 1: The nondominated surface of a sustainable mutual fund withn=46 assets.
By the way, the surface consists of 1797 platelets, but other than for visualization, they are of no particular significance in the paper.
we will use the termnondominatedin connection with criterion vectors and leave the termefficientto only apply to portfolios in decision space.
To compare with standard portfolio selection, which is (1.1–1.5) with (1.3) removed, consider Figures 1 and 2. Figure 1 shows the variance–expected return–
sustainability nondominated surface of one of the actual sustainable mutual funds in our study in which, without loss of generality, E is used as the sustainability measure.
The surface is made up of many curved patches, called “platelets,” each coming from the surface of a different paraboloidic solid. Although the surface may look dented and as if it may have many ridges (it is just the viewing angle) the surface is generally quite smooth with most of the platelets blending into one another in a continuously differentiable fashion. The significance of the nondominated surface is that somewhere on it is the criterion vector of the portfolio that optimizes the decision maker’s total utility. So, if one can locate an investor’s most preferred point on the nondominated surface, then by taking the inverse image of that point, one will have that person’s optimal portfolio.
The lighter gray shape in Figure 1 is the projection of the nondominated surface onto the variance–expected return plane. For better viewing, we have Figure 2.
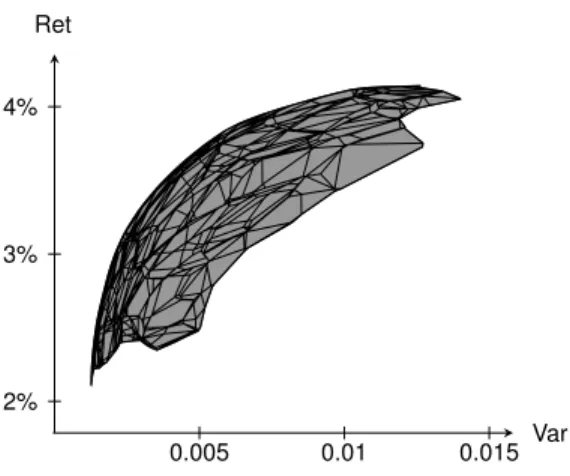
The “northwest” boundary of the shape is the standard variance–expected return nondominated frontier of Markowitz (1952) portfolio selection. Recall that the Markowitz nondominated frontier is piecewise parabolic. We can now see where the parabolic segments come from. They come from the projections of the platelets.
Notice that the shape is darkest just under the nondominated frontier. This means
0.005 0.01 0.015 2%
3%
4%
Var Ret
Figure 2: The projection of the surface (with its 1797 platelets) onto the variance–
expected return plane. Notice that the northwest boundary of the projection is the standard nondominated frontier.
that many of the platelets in Figure 1 are almost sideways to the variance–expected return plane. Thus, if we were to take a point on the variance–expected return plane just below the nondominated frontier, we could probably move quite far in the direction of sustainability before piercing the nondominated surface because of the sideways nature of much of the nondominated surface.
4 Using Quadratically Constrained ε -Constraint Linear Programs
With the number of investors feeling responsible about the non-financial conse- quences of their investments only growing, the sustainable mutual fund industry can only be expected to grow. But how it grows is important. Will it grow in a fashion that the term “sustainable mutual fund” is little more than a sales pitch, or will the industry be able to run itself for full effect? With the mutual fund as a middleman, the efficiency at which desires are converted into action, and how much gets lost in translation, are key issues. But how to measure a sustainable mutual fund’s efficiency? One way is to relate the level of sustainability at which the industry is currently operating to the level of sustainability at which the industry could operate without diminishing financial performance, and this is the approach taken in this paper.
Therefore, we now make use of the observation in the above sections to analyze potential opportunities for mutual funds to increase their E, S, G, and composite
ESG-scores without deteriorating any of their variances or expected returns. Note that for each reporting-date portfolio we have the type of fund, the monthly returns for the preceding 120 months (or as many as are obtainable) of all assets in the portfolio, and the current (as of the reporting date) E, S, G, and composite ESG- scores of these assets. Then, for the information needed in our analyses, we pursue for each of the 55,654 reporting-date portfolios theε-constraint3approach specified in the following four-step procedure:
1. Select from the 55,654 portfolios the weightingw∈Rnof a portfolio that has not previously been selected.
2. For formingµ, calculate as the expected return of each asset inwthe mean of its past 120 (or as many as we have) monthly returns. For the covariance matrix, calculate all possible (as there may be missing data) pairwise co- variances. If this does not yield a positive definite matrix, compute asΣthe nearest positive definite matrix using the procedure prescribed in Qi and Sun (2006).
3. For the lower and upper bounds on each asset, obtain
`=min
i {wi} and ω=max
i {wi}
4. Withνthe current (as of the reporting date) sustainability vector,ε1=wTΣw, andε2=µTw, solve
max ormin{νTx} (QCLP)
s.t. xTΣx≤ε1 µTx≥ε2
1Tx=1 xi∈[`,ω]for alli
eight times, four in maximization mode with E, S, G, and composite ESG for ν, and four in minimization mode with E, S, G, and composite ESG forν, holding variance to at most that ofwand expected return to at least that of w. The maximization runs produce efficient portfolios, and the minimization runs produceanti-efficientportfolios (worst over the feasible region givenε1 andε2). The efficient and anti-efficient portfolios give the range of each sus- tainability measure over the feasible region under theε-constraint conditions ofw. They also allow us to identify where within its ranges a mutual fund is operating as of a given reporting date.
z(x) z(w)
N
Projectz(w) onto point z(x) on the nondominated surface Nin the E-score direction.
E
Var Ret
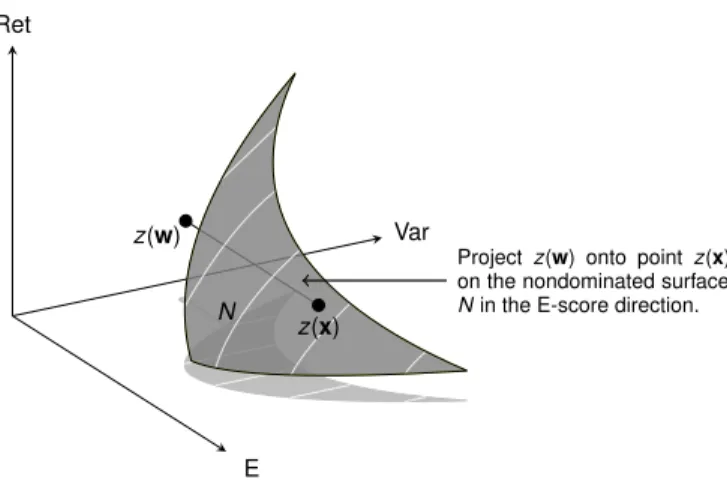
Figure 3: Projection of fund portfoliowonto the nondominated surfaceNin the E-score direction when the projection hits the nondominated surface.
All 8×55,654=445,232 optimizations were carried out on Cplex 12.6 called from Matlab. For clarity, it is beneficial to view the operation of (QCLP). Consider Figure 3 in which the shaded surface is to represent the variance–expected return–E nondominated surface andz(w)represents the location of the criterion vector of the current portfoliow. What the maximization of E does in Figure 3 is projectz(w) along the line of constant varianceε1and constant expected returnε2until point z(x)is encountered on the nondominated surface. What the minimization of E does is pursue the projection ofz(w)along the same line but in the opposite direction.
The two resulting criterion vectors tell us the range of possibilities forz3(x)given ε1andε2, and wherez3(w)is situated in relation.
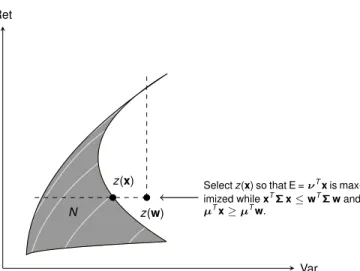
The inequalities, however, in (QCLP) are necessary as it could be the case that a projection does not hit the nondominated surface. Such a case is illustrated in Figure 4 with the same nondominated surface as in Figure 3, but from a different angle. Only the variance ofwin this illustration has been increased, so that the projection misses. In this case, we want the criterion vector on the nondominated surface that has the highest E-score while possessing, as indicated by the dashed lines, at most the variance ofwand at least the expected return ofw. This yields the point shown in Figure 4 which has the same expected return but less variance thanw.
The point is recognized as having the greatest E-score within the sector defined by the dashed lines after inspecting the white lines which are lines of constant E-value on the nondominated surface, with the E-values of the white lines increasing as we move to the lower right.
3For background information aboutε-constraint approaches, see Mavrotas, 2009.
z(x) N z(w)
Selectz(x) so that E =νTxis max- imized whilexTΣx≤wTΣwand µTx≥µTw.
Var Ret
Figure 4: Attempted projection of fund portfoliowonto the nondominated surfaceN in the E-score direction when the projection does not hit the nondominated surface.
On the nondominated surface, the white lines are contours of constant E-value.
5 Analyzing Results of QCLP Experiments
Although the UN PRI initiative obligates signatories to carry out ESG analyses, there have been few attempts to measure the actual sustainabilities possessed by portfolios in the mutual fund industry, namely only by Kempf and Osthoff (2008), Wimmer (2013) and Utz and Wimmer (2014). The difficulty in obtaining all of the holdings, monthly returns, and ESG information required and then tying it together is certainly partly responsible for this. But our dataset of 55,654 portfolios along with associated monthly returns and ESG scores enable us to conduct a comprehensive study of many mutual funds by looking at (a) each fund’s level of sustainability and (b) each fund’s opportunities to enhance its sustainability without having to subtract from the fund’s financial characteristics. To the best of our knowledge, this is the first paper that analyzes the differences between actual mutual fund portfolios and their efficient portfolio projections (that by construction have noninferior variances and expected returns yet maximum possible sustainability scores).
For each reporting-date portfoliowand each of its efficient and anti-efficient portfolios, we employ seven metrics (three financial, four sustainable) to assess their performances. In the financial category, the first two arein-samplevariance and in-sampleexpected return, which is just another way of referring to the variances and expected returns used in and obtained from the (QCLP) optimizations. The third is 3-monthsout-of-samplereturn, that being achieved during the three months
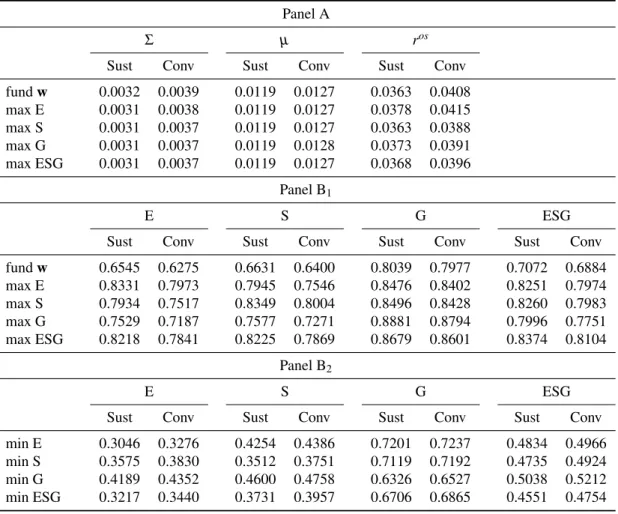
Table 1: Mean results of the efficient and relevant anti-efficient QCLP portfolios arranged by type of fund and metric
Panel A
Σ µ ros
Sust Conv Sust Conv Sust Conv
fundw 0.0032 0.0039 0.0119 0.0127 0.0363 0.0408 max E 0.0031 0.0038 0.0119 0.0127 0.0378 0.0415 max S 0.0031 0.0037 0.0119 0.0127 0.0363 0.0388 max G 0.0031 0.0037 0.0119 0.0128 0.0373 0.0391 max ESG 0.0031 0.0037 0.0119 0.0127 0.0368 0.0396
Panel B1
E S G ESG
Sust Conv Sust Conv Sust Conv Sust Conv
fundw 0.6545 0.6275 0.6631 0.6400 0.8039 0.7977 0.7072 0.6884 max E 0.8331 0.7973 0.7945 0.7546 0.8476 0.8402 0.8251 0.7974 max S 0.7934 0.7517 0.8349 0.8004 0.8496 0.8428 0.8260 0.7983 max G 0.7529 0.7187 0.7577 0.7271 0.8881 0.8794 0.7996 0.7751 max ESG 0.8218 0.7841 0.8225 0.7869 0.8679 0.8601 0.8374 0.8104
Panel B2
E S G ESG
Sust Conv Sust Conv Sust Conv Sust Conv
min E 0.3046 0.3276 0.4254 0.4386 0.7201 0.7237 0.4834 0.4966 min S 0.3575 0.3830 0.3512 0.3751 0.7119 0.7192 0.4735 0.4924 min G 0.4189 0.4352 0.4600 0.4758 0.6326 0.6527 0.5038 0.5212 min ESG 0.3217 0.3440 0.3731 0.3957 0.6706 0.6865 0.4551 0.4754
following aw’s reporting date. Given that portfolios obtained from Markowitz-style optimizations are known to work poorly out-of-sample DeMiguel, Garlappi and Uppal (2009), this out-of-sample return measure is important later in helping to show that our projected efficient portfolios do not have different financial characteristics from theirw’s. In the sustainable category, the four metrics are the E, S, G, and composite ESG scores of a portfolio.
In Table 1 are arranged the results of the 445,232 QCLP optimizations that were carried out in Step 4 of the four-step procedure specified earlier, 222,616 of which were used to generate the efficient portfolios (max E, max S, max G, max ESG) and 222,616 of which were used to generate the anti-efficient portfolios (min E, min S, min G, min ESG). With the results broken out by type of fund, (Sust) for sustainable and (Conv) for conventional, the table reports on the mean metric results of variance (Σ), expected return (µ), and 3-months out-of-sample return (ros) in Panel A, and on the mean metric results of E-score, S-score, G-score, and composite ESG-score in Panels B1and B2. Also shown in the table for comparison are mean metric results for the 55,654 reporting-date portfolios in the rows indicated by “fundw.” Note the slightly lower results forΣin the Sust and Conv columns of Panel A for max E, max S, max G, and max ESG than for fundw. This is not an error. The is because occasionally the projections miss the nondominated and the resulting lower value for variance experienced as shown in Figure 4 brings down the average.
In order to derive statistical inference, we need to test whether the efficient portfolios are different from their respective fund portfoliosw. Table 2 contains the results of severalt-tests based upon the type of fund (Sust, Conv) and the type of efficient portfolio generation strategy (max E, max S, max G, max ESG). The portfolio metrics employed in the table are (in the order of the rows) the average E, S, G, and composite ESG-score differences, the average 3-month return difference, the average variance difference, and the average expected return difference between the efficient portfolios and theirw’s. The values in parentheses are thet-statistics where the *, **, and *** denote significance at the 10%, 5%, and 1% level, respectively.
To illustrate Table 2, consider the Sust column under the heading max E. The firstt-statistic in this column is 42.71. What this shows is that efficient portfolios obtained by QCLP-projecting sustainablew’s in the direction of E have signifi- cantly higher E-scores than thew’s from which projected. The threet-statistics immediately below, starting with 37.20, are serendipitous in that the same efficient portfolios show significantly higher S, G, and ESG-scores as well even though not being the efficient portfolios obtained by QCLP-projecting along those directions.
While we note that thet-statistics are greater in the adjacent Conv column, this is no surprise as conventional funds are under no mandate to include more sustainability in their funds beyond what occurs by coincidence. The fiftht-statistic in the column is 0.35. It shows that there is no significant difference between the 3-month (out-of-
Table2:Efficientportfolios(e)vs.theircorrespondingreporting-dateportfolios(w).4 maxEmaxSmaxGmaxESG SustConvSustConvSustConvSustConv Ee−Ewdiff0.17870.16980.13890.12420.09840.09120.16740.1566 t-stat(42.71)∗∗∗(209.98)∗∗∗(32.37)∗∗∗(150.56)∗∗∗(23.55)∗∗∗(110.23)∗∗∗(40.12)∗∗∗(193.46)∗∗∗ Se−Swdiff0.13140.11450.17180.16040.09460.08710.15940.1469 t-stat(37.20)∗∗∗(156.83)∗∗∗(46.53)∗∗∗(217.49)∗∗∗(27.34)∗∗∗(118.90)∗∗∗(43.30)∗∗∗(198.64)∗∗∗ Ge−Gwdiff0.04370.04250.04570.04510.08420.08160.06400.0624 t-stat(27.29)∗∗∗(148.69)∗∗∗(28.77)∗∗∗(157.93)∗∗∗(51.81)∗∗∗(288.43)∗∗∗(39.22)∗∗∗(220.27)∗∗∗ ESGe−ESGwdiff0.11790.10890.11880.10990.09240.08660.13030.1219 t-stat(40.11)∗∗∗(187.49)∗∗∗(39.39)∗∗∗(186.59)∗∗∗(31.87)∗∗∗(147.15)∗∗∗(43.12)∗∗∗(207.03)∗∗∗ ros e−ros wdiff0.00140.0007−0.0001−0.00200.0009−0.00170.0005−0.0012 t-stat(0.35)(1.13)(−0.02)(−3.00)∗∗∗(0.23)(−2.61)∗∗∗(0.12)(−1.80)∗ Σe−Σwdiff−0.0000−0.0001−0.0001−0.0002−0.0001−0.0002−0.0001−0.0001 t-stat(−0.95)(−5.87)∗∗∗(−1.83)∗(−11.89)∗∗∗(−1.67)∗(−11.10)∗∗∗(−1.18)(−9.65)∗∗∗ µe−µwdiff0.00000.00000.00010.00010.00000.00010.00000.0000 t-stat.(0.16)(1.07)(0.30)(2.40)∗∗(0.20)(3.41)∗∗∗(0.15)(1.35) 4NoticethatthedifferencesreportedinthistablemebedifferfromvaluescalculatedusingTable1by0.0001duetorounding.
sample) returns of thew’s and the 3-month (out-of-sample) returns of the efficient portfolios, which is a key result to the validity of our study. The sixtht-statistic in the column is−0.95. This shows that the 3-month returns have not been made to align because of differences in variance.
With the figures in the columns under the other three headings of max S, max G, and max ESG showing similar results, the lesson of Table 2 is that while the QCLP efficient portfolios in all categories are highly comparable to their reporting-date portfolioswon financial matters, they are far superior, and this has been shown statistically, to their counterparts on sustainability matters. The interpretation here is that in sustainable mutual funds, where sustainability matters, there appears to be considerable room to increase the levels of sustainability in these funds for free (that is, without having to trade-off against any financial criteria).
Let us now drill down a little to confirm. Going back to Table 1, consider the Sust columns in Panel B1. In these columns, we see when pursuing a max E efficient portfolio generating approach that on average the E-score can be increased by .8331−.6545=.1786, the S-score by .1314, the G-score by .0437, and the composite ESG-score by .1179. These figures constitute an improvement of up to 27% in the level of sustainability. Observing similar improvements with the other efficient portfolio generating strategies of max S, max G, and max ESG, we can see from the table that there indeed exist substantial unused opportunities for sustainable mutual funds to increase their levels of sustainabilities regardless of sustainability metric used.
Even though in the table the sustainablew’s and their efficient portfolios show higher average levels of E, S, G, and ESG than their conventional counterparts, sustainable mutual funds in all cases have the potential to increase their levels of sustainability more than conventional mutual funds. For instance, in the E columns of Panel B1for max E, sustainable mutual funds can increase their sustainabilities on average by .1786, but conventional mutual funds can only increase their sus- tainabilities on average by .7973−.6275=.1678. This effect is seen throughout the panel. There are two explanations for this. One is that the ranges of possible sustainability are wider for sustainable mutual funds than for conventional mutual funds, and the other is that sustainable mutual funds operate less toward the upper ends of their ranges than conventional funds.
To statistically investigate these explanations, we do the following for each of the four sustainability measures for eachw-portfolioi. Arbitrarily selecting E to illustrate, we obtain portfolioi’s max E and min E scores (they are in the max E and min E figures reported in Panels B1and B2). We now introduce the notion of a portfolio’sposition of E-sustainability. It is determined by the location of the portfolio’s E-score in the range between its min E and max E. In particular, portfolio i’s position of E-sustainability pE(i)is calculated by standardizingi’s E-score on
the range between its min E and max E as follows pE(i) =i’s E-score−i’s min E
i’s max E−i’s min E
In this way, pE is a vector with 55,654 entries, each ranging from 0 to 1. A higher value indicates a higher position of sustainability because the portfolio’s sustainability is nearer to its maximum than minimum. VectorspS,pG, and pESG
are obtained similarly.
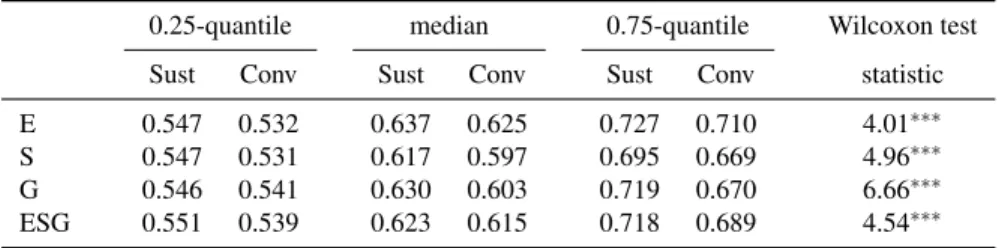
Table 3: Position of sustainability of sustainable funds vs. conventional funds.
0.25-quantile median 0.75-quantile Wilcoxon test
Sust Conv Sust Conv Sust Conv statistic
E 0.547 0.532 0.637 0.625 0.727 0.710 4.01∗∗∗
S 0.547 0.531 0.617 0.597 0.695 0.669 4.96∗∗∗
G 0.546 0.541 0.630 0.603 0.719 0.670 6.66∗∗∗
ESG 0.551 0.539 0.623 0.615 0.718 0.689 4.54∗∗∗
The first six columns in Table 3 show the 25% quantile, the median, and the 75%
quantile of the positions of sustainability by sustainable and conventional mutual funds separately. More than 75% of all mutual funds show positions of sustainability in the range between 0.5 and 1 and are therefore closer to the maximum than to the minimum.
We also test the ranks of the sustainable mutual funds compared to the con- ventional mutual funds with the nonparametric Wilcoxon rank sum test. In the rightmost of Table 3 we report upon the results of these Wilcoxon rank sum tests and observe that all of their correspondingp-values are significant at the 1% level.
This means that sustainable mutual funds exhibit significantly higher ranks and hence have higher positions of sustainability than conventional funds. However, although the position of sustainability in the second stage of the asset management process is higher for sustainable mutual funds, sustainable mutual funds still have more unused opportunities to enhance their absolute sustainability quotients (cf.
Table 2). The only reason by which this is possible is observed in Table 1: The range of achievable sustainability quotients is larger for sustainable funds than it is for conventional funds.
6 Computer Time
Because the sustainable mutual fund industry and fund research firms like Morn- ingstar could and probably should report on results such as developed in this paper
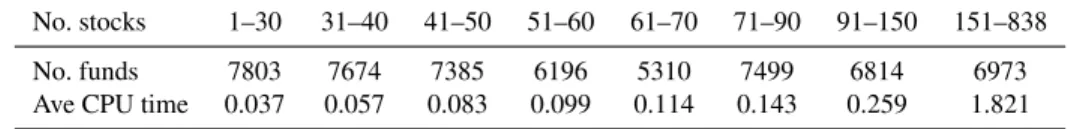
Table 4: Computer time analysis (in seconds).
No. stocks 1–30 31–40 41–50 51–60 61–70 71–90 91–150 151–838
No. funds 7803 7674 7385 6196 5310 7499 6814 6973
Ave CPU time 0.037 0.057 0.083 0.099 0.114 0.143 0.259 1.821
for their sustainable clients, Table 4 reports on the CPU times required for solving all of the (QCLP)s of this study. The first row displays the number of assets a fund consists of. The second row contains the number of mutual funds in each group, and the third row contains the average CPU time required to solve all of aw’s eight QCLPs consecutively. All computations were performed on an Intel Core i7-2600 (3.40 GHz) computer using the QCP solver of Cplex 12.6. While CPU times are negligible for smaller portfolios, they increase at an increasing rate with the size of the portfolio. For the largest portfolio in our analysis (n=838), the computation of the four efficient and the four anti-efficient portfolios required a time of 16.57 seconds. While total time was almost five hours, this is not out of the question for the industry or a fund research firm to do periodically given the hundreds of billions of dollars invested in sustainable mutual funds.
7 Conclusions
In this article, we adopt a QCLP approach to compute certain efficient portfolios in a tri-criterion model that includes risk, expected return, and sustainability. We compare efficient portfolios with the real portfolios of mutual funds and find that sustainable mutual funds could markedly increase the sustainability quotients of their portfolios without jeopardizing financial goals. To illustrate, notice that the average composite ESG-score of sustainable fund portfolios (0.7072) is only slightly higher than the respective score of conventional funds (0.6884). However, by integrating sustainability into the asset allocation as an objective, sustainable funds could achieve an ESG-score of 0.8374 on average, that is, they could outperform their conventional equivalents almost eight times more than they currently do.
Thus, we conclude that the sustainable mutual fund industry has substantial leeway to increase the sustainability quotients of its portfolios at even no cost to risk and return. The natural thought is that the sustainable mutual fund industry is operating within a framework of binding trade-offs. In this framework, to obtain more sustainability, it could only come at the expense of financial performance.
Investors accept this. But the research of this paper does not find the trade-off situation tight at all. Our findings are that the sustainable mutual fund industry
is leaving considerable sustainability on the table. That is, the sustainability of a sustainable mutual fund can be increased quite substantially before any costs to the financial criteria would have to be paid. What this shows is that while today’s first-stage screening process is sufficient to create portfolios with enough extra sustainability for it to be noticed, the funds are in reality only marginally sustainable when compared to the extra sustainabilities that could, without cost, be built into the funds. This underscores the importance of conducting the second-stage in a fashion other than the way it is currently practiced because it is only by the inclusion of sustainability assessments in this stage that the extra unutilized sustainabilities can be identified and then fulfilled.
The conclusion that the sustainable mutual fund industry has substantial leeway to increase the sustainability quotients of its portfolios has implications about the allocative function of finance. The allocative function of finance is the process by which an economy sees to it that its (scarce) capital is allocated to the production of those goods and services that best satisfy the preferences of the society. In fact, the allocative function is one of the primary justifications for the field of finance.
Scaling this down to the sustainable mutual fund industry, the allocative function to be carried here is to facilitate the signaling to producers about the goods, services, and management practices that the suppliers of capital in this market wish to see more of and those that they wish to see less of. Unfortunately, because of the amount of sustainability left on the table, the efficiency at which the allocative function operates in the sustainable mutual fund industry is not at the level that one would normally expect of any intermediary in a modern market-based economy.
So why does the situation appear to continue in this way with so little, other than this paper, in the way of change apparent on the horizon? One reason is that the suppliers of capital to the industry really have no way of knowing much about these issues. Consequently they put nearly full trust in the industry figuring that they are the professionals and know how to do this, so there is no pressure to speak of from them. Another is that from the industry side, the phenomenon can’t be seen from the second-stage approaches currently used. What it takes is a more robust second-stage modeling approach oriented around tri-criterion tools and concepts as in this paper, but these tools are very new and take time to adapt to, so progress can only be expected to be gradual. Furthermore, more research needs to be done to make sure that the results of this paper can be readily confirmed by others before one could expect to se major change based upon the results of this paper.
In closing, the paper demonstrates that there is considerable slippage in the sustainable mutual fund industry with regard to its current servicing of the needs of sustainable investors and more research is needed on the subject. But with the capabilities of this paper, and with models the industry can now begin to build on its own, the industry should be in a much better position in the future to fulfill
its mandate—to create and manage sustainable mutual funds—in a more efficient allocative way.
References
[1] Enrique Ballestero, Mila Bravo, Blanca P´erez-Gladish, Mar Arenas-Parra, and David Pl`a-Santamaria. Socially responsible investment: A multicriteria approach to portfolio selection combining ethical and financial objectives.
European Journal of Operational Research, 216(2):487–494, 2012.
[2] Enrique Ballestero, David Pl`a-Santamaria, Mila Bravo, and Ana Garcia Bern- abeu. Estimating the ethical achievement levels of mutual funds by synthetic indicators. Available at SSRN, http://ssrn.com/abstract=2471446, 2014.
[3] Fouad Ben Abdelaziz, Belaid Aouni, and Rimeh El Fayedh. Multi-objective stochastic programming for portfolio selection. European Journal of Opera- tional Research, 177(3):1811–1823, 2007.
[4] J. M. Cabello, F. Ruiz, Blanca P´erez-Gladish, and P. M´endez-Rodriguez. Syn- thetic indicators of mutual funds’ environmental responsibility: An application of the reference point method. European Journal of Operational Research, 236(1):313–325, 2014.
[5] C. Calvo, C. Ivorra, and V. Liern. Fuzzy portfolio selection with non-financial goals: Exploring the efficient frontier. Annals of Operations Research, avail- able online, 2014. DOI: 10.1007/s10479-014-1561-2.
[6] V. DeMiguel, L. Garlappi, and R. Uppal. Optimal versus naive diversification:
How inefficient is the 1/N portfolio strategy? Review of Financial Studies, 22(5):1915–1953, 2009.
[7] Winfried Hallerbach, Haikun Ning, Aloy Soppe, and Jaap Spronk. A frame- work for managing a portfolio of socially responsible investments.European Journal of Operational Research, 153(2):517–529, 2004.
[8] Markus Hirschberger, Ralph E. Steuer, Sebastian Utz, Maximilian Wimmer, and Yue Qi. Computing the nondominated surface in tri-criterion portfolio selection. Operations Research, 61(1):169–183, 2013.
[9] Alexander Kempf and Peer Osthoff. SRI funds: Nomen est omen. Journal of Business Finance and Accounting, 35(9/10):1276–1294, 2008.
[10] Harry M. Markowitz. Portfolio selection. Journal of Finance, 7(1):77–91, 1952.
[11] G. Mavrotas. Effective implementation of theε-constraint method in multi- objective mathematical programming problems. Applied Mathematics and Computation, 213(2):455–465, 2009.
[12] Blanca P´erez-Gladish, P. M´endez-Rodriguez, B. M’Zali, and P. Lang. Mutual funds efficiency measurement under financial and social responsibility criteria.
Journal of Multi-Criteria Decision Analysis, 20(3-4):109–125, 2013.
[13] Houduo Qi and Defeng Sun. A quadratically convergent Newton method for computing the nearest correlation matrix. SIAM Journal on Matrix Analysis and Applications, 28(2):360–385, 2006.
[14] T. Smith. A chronological list of Wesley’s sermons and doctrinal essays.
Wesleyan Theological Journal, 17(2):88–110, 1982.
[15] Sebastian Utz and Maximilian Wimmer. Are they any good at all? A financial and ethical analysis of socially responsible mutual funds. Journal of Asset Management, 15(1):72–82, 2014.
[16] Sebastian Utz, Maximilian Wimmer, Ralph E. Steuer, and Markus Hirschberger. Tri-criterion inverse portfolio optimization with application to socially responsible mutual funds. European Journal of Operational Re- search, 234(2):155–164, 2014.
[17] Maximilian Wimmer. ESG-persistence in socially responsible mutual funds.
Journal of Management and Sustainability, 3(1):9–15, 2013.
[18] P. Xidonas, G. Mavrotas, T. Krintas, J. Psarras, and C. Zopounidis, editors.
Multicriteria Portfolio Management. Springer, New York, 2012.