Deterministic transfer of spin polarization in wire-like lateral structures via the persistent spin helix
M.Schwemmer,A.Hanninger,M.Weingartner,M.Oltscher,M.Ciorga,D.Weiss,D.Schuh, D.Bougeard,T.Korn,and C.Sch€ullera)
Institut f€ur Experimentelle und Angewandte Physik, Universit€at Regensburg, D-93040 Regensburg, Germany (Received 14 September 2016; accepted 13 October 2016; published online 27 October 2016) We used spatially- and time-resolved Kerr rotation microscopy to show that in lateral wire-like structures, based on a modulation-doped GaAs-AlGaAs quantum well, an optically initialized spin polarization can be deterministically transferred to specific lateral positions, employing the persis- tent spin helix (PSH). To this end, we show that confinement in two directions leads to a strong enhancement of the effective decay time of spin polarization, which can be exploited to transfer spin polarization over relatively large lateral distances. This is demonstrated by the investigation of L-shaped wire-like lateral structures, where the legs are positioned in directions parallel and perpendicular to the wave vector of the PSH.Published by AIP Publishing.
[http://dx.doi.org/10.1063/1.4966184]
The key tool to manipulate the spin in semiconductor- based devices is spin-orbit interaction.1 However, on the downside, the spin-orbit interaction leads to spin dephasing, which limits the performance of spintronics or spin-based information processing devices. In this respect, an important milestone has been the proposal of a SU(2) spin rotation symmetry in quantum wells, based on the zincblende-type semiconductors, by Berneviget al.2For (001)-grown quan- tum wells, this outstanding situation occurs for balanced lin- ear Rashba3 and Dresselhaus4 spin-orbit fields. Very appealingly, the SU(2) symmetry ideally protects the system against Dyakonov-Perel spin dephasing5and should support a helical mode, the so called persistent spin helix (PSH), which opens up interesting application possibilities. Even before the proposal of Berneviget al., Schliemannet al. sug- gested a non-ballistic spin field-effect transistor, based on the same theoretical principles of balanced spin-orbit fields.6 Since then, a wealth of experimental and theoretical investi- gations has appeared along these lines. Most prominent are the first experimental evidences of the existence of a PSH by transient spin grating spectroscopy,7 direct mapping via time- and spatially-resolved Kerr microscopy,8 and weak localization/antilocalization experiments.9Closely related, a spin Hall effect transistor was demonstrated by Wunderlich et al.10Subsequently, the PSH was investigated in, e.g., gated structures,11 laterally confined structures,12 structures with imbalanced spin-orbit interactions13,14 or via inelastic light scattering.15Very recently, investigations in biased structures under charge transport were reported.16,17
In this work, we used spatially- and time-resolved Kerr rotation microscopy to show that spin polarization can be deterministically transferred to specific lateral positions via the PSH. We started by experimentally verifying the PSH in the as-grown sample, a GaAs-AlGaAs single quantum well, via spatially-resolved Kerr microscopy, followed by the investigation of narrow channels with lateral widths down to 3lm. These experiments have shown that the effective
decay time of the spin polarization is prolonged by a factor of about three in narrow channels, as compared to the two- dimensional (2D) case. Finally, we used L-shaped lateral structures to transfer spin polarization to specific lateral posi- tions, employing the two distinct inplane directions, parallel and perpendicular to the wave vector of the PSH.
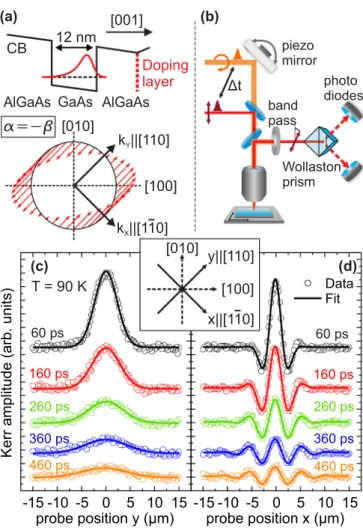
The sample contains a (001)-grown, one-side n- modulation-doped GaAs-Al0.3Ga0.7As single quantum well, hosting a two-dimensional electron system (2DES) with elec- tron density n5.91011cm2and mobility l8.4105 cm2V1s1, measured via magneto transport under illumina- tion atT¼4.2 K. Figure1(a)shows a schematic picture of the conduction-band profile of the active region of the sample. It consists of a 12 nm GaAs quantum well with a Si delta- doping layer, separated by a 20 nm-thick AlGaAs spacer. The sample parameters are designed for equal magnitudes of the linear Rashba and Dresselhaus coefficients,aandb, respec- tively.2 The electric field, due to space charges, inside the quantum well is pointing in ½001 direction [cf. Fig. 1(a)].
This means that for our sample a¼–b, with b being posi- tive.18 The spin-orbit Hamiltonian of an electron in a (001)- oriented quantum well is given byHSO¼aðk010rxk100ryÞ þbðk100rxk010ryÞ, if terms linear in kjj¼ ðk100;k010Þ are considered, only. The effective kjj-dependent spin-orbit field Beff is usually defined via a Zeeman-type Hamiltonian HSO¼rB^ eff, where ^r¼ ðrx;ry;rzÞ contains the Pauli spin matrices. For a¼–b, this results in an effective spin-orbit field BeffðkjjÞ ¼bðk100k010Þk110=k110 [red arrows in Fig.
1(a)], which is for all kjj either parallel or antiparallel to the [110] inplane direction of the quantum well, depending on the sign of the sum (k100–k010). With these parameters, the PSH is supported in the ½110direction for spins that are initially aligned perpendicular to the quantum-well plane.2 For sim- plicity, we assign for the following considerations the ½110 and [110] directions as x and y, respectively [see inset between Figs. 1(c) and 1(d)], so that the x direction is the direction of the wave vector of the PSH.
The experiments are performed with a mode-locked Ti:Sapphire laser, operated at a central wavelength of 795 nm
a)Electronic mail: christian.schueller@ur.de
0003-6951/2016/109(17)/172106/4/$30.00 109, 172106-1 Published by AIP Publishing.
APPLIED PHYSICS LETTERS109, 172106 (2016)
Reuse of AIP Publishing content is subject to the terms at: https://publishing.aip.org/authors/rights-and-permissions. Download to IP: 132.199.97.65 On: Mon, 31 Oct 2016 17:10:41
and a repetition rate of 80 MHz. The experimental setup is sketched in Fig.1(b). The laser beam is divided into two pulse trains (pump and probe beams) via a beam splitter, and a time delayDtbetween pump and probe pulses can be adjusted via a mechanical delay line. The individual pulses have a pulse duration of about 0.1 ps, and a spectral full width at half max- imum (FWHM) of about 12 nm. Via optical band-pass filters, the pump pulses are spectrally shaped with a center wave- length of 780 nm and FWHM of about 10 nm from the high- energy tails of the plain pulses, and probe pulses with a center wavelength of 810 nm and FWHM of about 10 nm from the low-energy tails of the plain pulses [orange and red beams in Fig. 1(b)]. After all optical components, in particular, the band-pass filters, the pulse duration is about 0.4 ps, with no significant chirp of the pulses. With these settings, the energy of the pump pulses is at the onset of the absorptive region, and the energy of the probe pulses in the transparent region of the quantum well.19The used power densities are on the order of 40 kW/cm2(90 kW/cm2) for the pump (probe) beam. The pump pulses are circularly polarized, while the probe pulses are linearly polarized, in order to probe the spin polarization via the magneto-optical Kerr effect. To avoid the build-up of a dynamic nuclear polarization, the helicity of the pump beam is modulated by a liquid crystal modulator and a lock-in
scheme is used to increase the detection sensitivity. The two laser beams are colinearly focused via a 100 microscope objective onto the sample, which is kept in vacuum in a liquid-He cooled cold-finger cryostat atT¼90 K. Fine tuning of the pump-beam path via a piezo-electric mirror holder allows to move the pump spot laterally on the sample surface with respect to the probe spot. Both spots have a diameter of about 1.4lm, which enables high-resolution scans. A motor- izedx-y-stage for the cryostat in combination with the piezo- electric mirror holder allows to scan, e.g., the probe beam, while keeping the pump spot position fixed at the sample, or vice versa. The pump beam is filtered out from the back- reflected light by a band-pass filter, and the rotation of linear polarization of the probe beam is detected by an optical bridge via two balanced photo diodes.
We start by discussing the experiments on the as-grown wafer. These experiments are similar to the experiments of Ref. 8. Figures 1(c) and1(d)show lateral line scans of the Kerr signal (probe beam) for different time delays Dtbetween the pump and probe pulses. The circularly polar- ized pump pulses (spot position fixed at x, y¼0) create a local spin polarization via the excitation of spin-polarized electron-hole pairs due to optical selection rules. Subsequently, the spin polarization is measured via the Kerr rotation of the linearly polarized probe beam. For lateral measurements, the probe spot is moved in y direction on the sample surface with respect to the position of the pump spot [Fig.1(c)] or in xdirection [Fig.1(d)]. From Figs.1(c)and1(d), we can see that the signal at x, y¼0, i.e., the maximum spin polariza- tion, decreases with increasingDt. This is partly due to the recombination of the photo-excited electron-hole pairs and partly due to the diffusion of charge carriers out of the exci- tation spot with time. For the direction perpendicular to the PSH direction [ydirection, Fig.1(c)], the lateral Kerr signal exhibits a Gaussian profile, which broadens with increasing Dt due to diffusion, while for the direction of the PSH [x direction, Fig. 1(d)] the Kerr signal shows an oscillatory behavior, resembling the PSH. The solid lines in Fig. 1(c) are fits of a Gaussian function, Fðy;wy;Dt;sSpinÞ ¼A= ðwy ffiffiffi
pp
ÞexpðDt=sSpinÞexp½ðy=wyÞ2, where A is a con- stant, wy the width of the Gaussian function, Dt the time delay between the pump and probe pulses, and sSpin
the effective decay time of the spin signal. In Fig.1(d), the solid lines are fits of a product of a Gaussian and a cosine function, Gðx;wx;Dt;sSpin;kPSHÞ ¼ A=ðwx ffiffiffi
pp
ÞexpðDt= sSpinÞexp½ðx=wxÞ2cos½ð2p=kPSHÞx, with the width of the Gaussian function wxand the wavelength of the PSH kPSH. The experimental data points can be fitted quite well by these functions. Figure 2(b)shows kPSH, which is extracted from fits like in Fig.1(d), for all measured time delaysDtbetween the pump and probe pulses. One can see from this plot that kPSH starts at a value of about 7.2lm for short time delays and converges towards about 5.4lm with increasing Dt. It was shown by Saliset al.20that the finite spatial extension of the initial spin polarization is the reason for this effect and, hence, kPSH5.4lm at longDt is the actual wavelength of the PSH of the system.
After verifying the PSH experimentally in the as-grown sample, which confirms that approximately a–b in our sample, we turn now to the investigation of the PSH in
FIG. 1. (a) Schematic picture of the conduction band-edge profile of the sample and of the effective spin-orbit fieldBeff(red arrows) at the Fermi energy inkspace. (b) Setup for spatially and time-resolved Kerr rotation microscopy. (c) Line scans of the Kerr rotation signal along theydirection (see inset) for different time delaysDt. The pump spot is fixed aty¼0. (d) Same as (c) but along thexdirection. The pump spot is fixed atx¼0.
172106-2 Schwemmeret al. Appl. Phys. Lett.109, 172106 (2016)
Reuse of AIP Publishing content is subject to the terms at: https://publishing.aip.org/authors/rights-and-permissions. Download to IP: 132.199.97.65 On: Mon, 31 Oct 2016 17:10:41
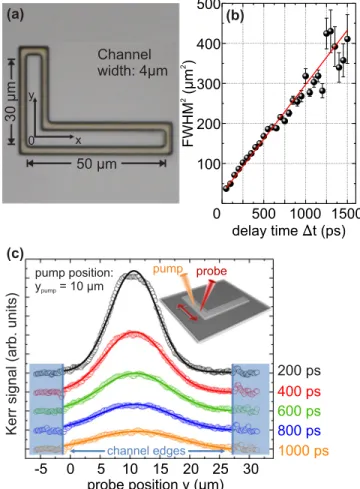
confining structures. The lateral structures are defined via electron-beam lithography and subsequent reactive-ion etch- ing. In the left panel of Fig.2(a), a microscope image of a processed sample is shown. The darker gray areas are etched through the 2DES. All channels have a length of 150lm and widths between 3lm and 50lm. The longitudinal direction of the channels is thex direction, i.e., the direction of the wave vector of the PSH. The right panel of Fig.2(a)displays the Kerr line scans alongxfor a fixed time delay ofDt¼500 ps for three selected channel widths of 3, 7.5 and 50lm. For each channel width, the signal strength is normalized to the measurement at Dt¼100 ps [not shown]. It can be clearly seen from this plot that the signal strength, i.e., the spin polarization, is enhanced with decreasing channel width.
This is because the confinement prevents the diffusion of charge carriers inydirection.12In the narrowest channel, the electrons can diffuse essentially inxdirection only. Altmann et al. have shown that the lifetimesPSH of the PSH depends only weakly on the confinement and is of order 1 ns.12They found a transition to 1D diffusion for channels thinner than 8lm, employing a model, where the finite injection spot size and the diffusion of electrons out of the excitation spot were taken into account.12 For our investigations, we concentrate
on the effective decay timesSpinof the measured spin polari- zation in the channels. We determinesSpinfor different chan- nel widths by taking Kerr scans for different Dt and then extract the exponential decay timesSpinof the Kerr signal ver- sus Dt from fits, as described above. Figure 2(c)shows the obtained sSpin versus channel width. One can see that sSpin increases by up to a factor of about three in the narrowest channel (3lm) in comparison with the 2D case. Specifically, sSpinincreases strongly for channel widths smaller than about 10lm, reflecting the transition to 1D diffusion.12
Here, we will demonstrate how we exploit the enhanced effective decay time of spin polarization in the quasi-1D struc- tures to transfer spin polarization in lateral L-shaped wire-like structures to specific spots on the sample. Figure3(a)shows a microscope image of an L-shaped wire with 4lm channel width.
The used coordinate system, with its origin in the corner of the L, is also indicated. Thexdirection is the direction of the wave vector of the PSH. Figure3(c)displays Kerr line scans on they leg of the structure. The blue-shaded areas mark the regions out- side theyleg. Comparing these traces with the measurements on the as-grown sample in Fig. 1(c), the impact of the enhanced effective decay time of spin polarizationsSpinon the wire struc- ture is obvious: In the wire structure, there is a relatively strong spin signal observable, even forDt¼1000 ps, and the measured spin distribution is slightly wider for comparableDt, indicating
FIG. 2. (a) Microscope image of etched channels along thexdirection. The darker gray areas are etched through the quantum well (left panel). Kerr line scans for three selected channel widths (right panel). Each dataset is normal- ized to its signal strength atDt¼100 ps. The line scans were taken, as sketched in the left panel, with fixed probe spot, while the pump spot is scanned. (b) Wavelength of the PSH versus time delayDtbetween pump and probe pulses. (c) Effective decay time of the spin polarizationsSpinver- sus channel width.
FIG. 3. (a) Microscope image of an L-shaped wire structure. (b) Plot of the squares of the FWHM of measured spin polarization profiles from (c) versus Dt. The solid line is a linear fit to the data, from which the spin diffusion constant is extracted. (c) Line scans in theyleg of the L-shaped wire struc- ture. The pump position is fixed at ypump¼10lm. The blue-shaded areas mark the regions outside the wire.
172106-3 Schwemmeret al. Appl. Phys. Lett.109, 172106 (2016)
Reuse of AIP Publishing content is subject to the terms at: https://publishing.aip.org/authors/rights-and-permissions. Download to IP: 132.199.97.65 On: Mon, 31 Oct 2016 17:10:41
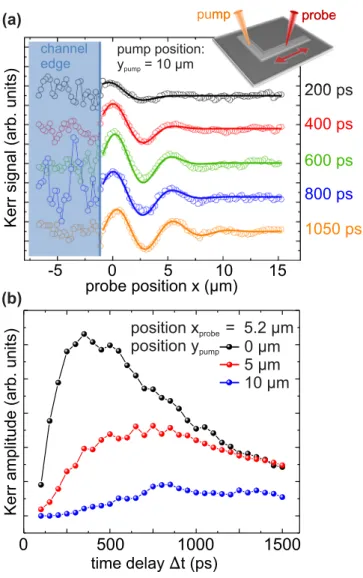
faster diffusion due to the transition from 2D to quasi-1D behav- ior. In Fig.3(b), the squared FWHM of the measured spin polari- zation profiles in the y leg are plotted versus Dt for all the measured time delays. From the slope of this curve, we extract a spin diffusion constant of aboutDs¼245 cm2/s, in agreement with other reports on similar systems.12,21In the measurements displayed in Fig. 4(a), the pump spot is fixed at position ypump¼10lm in theyleg, while the probe spot is scanned in the xleg for differentDt. Here, the blue-shaded area marks the out- side region left of thexleg [cf. Fig.3(a)]. From these measure- ments, one can read that, from spin-up initialization at position ypump¼10lm, a spin down polarization is, e.g., transferred to position x2.6lm, while spin up is at position x5.2lm.
Furthermore, we find from these investigations that spin polari- zation can be transferred in the wire-like structures around a cor- ner over a total distance of at least 20lm, while in the 2D
structure the spin signal has vanished already after a distance of about 10lm (cf. Fig.1(d)). Figure4(b)shows the Kerr ampli- tude in thexleg at positionxprobe¼5.2lm versus time delay for different pump positionsypumpin theyleg. By increasing the dis- tance of the pump position inydirection, one can see here the build-up of the spin signal in thexleg.
In conclusion, we have demonstrated a strongly enhanced effective decay time of the optically induced spin polarization in wire-like structures, based on a modulation-doped GaAs quantum well with a 2DES in the regime of the PSH. Via L-shaped lateral structures, we could show that the spin polar- ization can be deterministically transferred over distances of at least 20lm, even around a corner.
We acknowledge the financial support by the Deutsche Forschungsgemeinschaft via SFB 689 and project SCHU1171/7.
1S. Datta and B. Das,Appl. Phys. Lett.56, 665 (1990).
2B. A. Bernevig, J. Orenstein, and S.-C. Zhang,Phys. Rev. Lett.97, 236601 (2006).
3Y. A. Bychkov and E. I. Rashba, Pis’ma Z. Eksp. Teor. Fiz.39, 66 (1984) [JETP Lett.39, 78 (1984)].
4G. Dresselhaus,Phys. Rev.100, 580 (1955).
5M. I. D’yakonov and V. I. Perel’, Z.Eksp. Teor. Fiz. 60, 1954 (1971) [Sov. Phys. JEPT33, 1053 (1971)].
6J. Schliemann, J. C. Egues, and D. Loss, Phys. Rev. Lett.90, 146801 (2003).
7J. D. Koralek, C. P. Weber, J. Orenstein, B. A. Bernevig, S.-C. Zhang, S.
Mack, and D. D. Awshalom,Nature458, 610 (2009).
8M. P. Walser, C. Reichl, W. Wegscheider, and G. Salis,Nat. Phys.8, 757 (2012).
9M. Kohda, V. Lechner, Y. Kunihashi, T. Dollinger, P. Olbrich, C.
Sch€onhuber, I. Caspers, V. V. Bel’kov, L. E. Golub, D. Weiss, K. Richter, J. Nitta, and S. D. Ganichev,Phys. Rev. B86, 081306 (2012).
10J. Wunderlich, B. G. Park, A. C. Irvine, L. P. Zarbo, E. Rozkotova, P.
Nemec, V. Novak, J. Sinova, and T. Jungwirth,Science330, 1801 (2010).
11J. Ishihara, Y. Ohno, and H. Ohno,Phys. Exp.7, 013001 (2014).
12P. Altmann, M. P. Walser, C. Reichl, W. Wegscheider, and G. Salis,Phys.
Rev. B90, 201306(R) (2014).
13L. Yang, J. D. Koralek, J. Orenstein, T. R. Tibbetts, J. L. Reno, and M. P.
Lilly,Nat. Phys.8, 153 (2012).
14L. Yang, J. D. Koralek, J. Orenstein, T. R. Tibbetts, J. L. Reno, and M. P.
Lilly,Phys. Rev. Lett.109, 246603 (2012).
15C. Sch€onhuber, M. P. Walser, G. Salis, C. Reichl, W. Wegscheider, T.
Korn, and C. Sch€uller,Phys. Rev. B89, 085406 (2014).
16P. Altmann, F. G. G. Hernandez, G. J. Ferreira, M. Kohda, C. Reichl, W.
Wegscheider, and G. Salis,Phys. Rev. Lett.116, 196802 (2016).
17Y. Kunihashi, H. Sanada, H. Gotoh, K. Onomitsu, M. Kohda, J. Nitta, and T. Sogawa,Nat. Commun.7, 10722 (2016).
18M. Studer, G. Salis, K. Ensslin, D. C. Driscoll, and A. C. Gossard,Phys.
Rev. Lett.103, 027201 (2009).
19The photoluminescence spectrum of the quantum well (not shown) has a maximum at about 807 nm and a high-energy cutoff, reflecting the Fermi energy, where the absorptive region starts, at around 795 nm.
20G. Salis, M. P. Walser, P. Altmann, C. Reichl, and W. Wegscheider,Phys.
Rev. B89, 045304 (2014).
21R. V€olkl, M. Schwemmer, M. Griesbeck, S. A. Tarasenko, D. Schuh, W.
Wegscheider, C. Sch€uller, and T. Korn, Phys. Rev. B 89, 075424 (2014).
FIG. 4. (a) Line scans in thex leg, while the pump position is fixed at ypump¼10lm in theyleg. The blue-shaded area marks the region left of the xleg. (b) Kerr amplitude at positionxprobe¼5.2lm for different pump posi- tionsypumpversusDt.
172106-4 Schwemmeret al. Appl. Phys. Lett.109, 172106 (2016)
Reuse of AIP Publishing content is subject to the terms at: https://publishing.aip.org/authors/rights-and-permissions. Download to IP: 132.199.97.65 On: Mon, 31 Oct 2016 17:10:41