Mirella Cacace
The Changing Public/Private Mix in the American Healthcare System
TranState Working Papers No. 58
Sfb597 „Staatlichkeit im Wandel“ − „Transformations of the State“
Bremen, 2007
[ISSN 1861-1176]
Mirella Cacace
The Changing Public/Private Mix in the American Healthcare System (TranState Working Papers, 58)
Bremen: Sfb 597 „Staatlichkeit im Wandel“, 2007 ISSN 1861-1176
Universität Bremen
Sonderforschungsbereich 597 / Collaborative Research Center 597 Staatlichkeit im Wandel / Transformations of the State
Postfach 33 04 40 D - 28334 Bremen Tel.:+ 49 421 218-8720 Fax:+ 49 421 218-8721
Homepage: http://www.staatlichkeit.uni-bremen.de
Diese Arbeit ist im Sonderforschungsbereich 597 „Staatlichkeit im Wandel“, Bremen, entstanden und wurde auf dessen Veranlassung unter Verwendung der ihm von der Deutschen Forschungsgemein- schaft zur Verfügung gestellten Mittel veröffentlicht.
The Changing Public/Private Mix in the American Healthcare System
A
BSTRACTThis paper discusses the fundamental changes in the American health care system dur- ing the past four decades. By applying a multidimensional framework, the changing role of the state in financing, service provision, and in the regulation of the health care sys- tem are scrutinized. The results suggest a considerable “blurring” of the private, market based health care system of the United States. While the state constantly retreats from service provision, it substantially intensifies its engagement in financing and also in the regulation of the system. The most path-breaking changes in regulation, however, are observed through the introduction of managed care, which, from a private market side, brought new elements of hierarchical coordination into the system.
C
ONTENTS1.INTRODUCTION...1
1.1 Research context and analytical approach ... 1
1.2 Health care system overview ... 3
1.3 The major reforms... 6
2. THE EVOLUTION OF PRIVATE HIERARCHY IN THE MANAGED CARE MARKET...8
2.1 The mechanisms of governance in managed care ... 9
2.2 The proliferation of managed care ... 11
3.THE FINANCING DIMENSION...13
3.1 The changing level of financing... 14
3.2 Changes in the financing structure ... 16
3.3 Intersectoral comparison ... 18
3.4 The changing role of the state in financing ... 20
4.THE SERVICE PROVISION DIMENSION...21
4.1 The size of the health care sectors... 21
4.2 The public/private mix in the health care sectors... 23
4.3 The changing role of the state in service provision... 26
5.THE REGULATION DIMENSION...26
5.1 Coverage ... 27
5.2 Financing system... 30
5.3 Remuneration ... 33
5.4 Access of health care providers to markets... 35
5.5 Access of patients to health care providers ... 38
5.6 Benefit package... 39
6.SUMMARY AND CONCLUSION...41
REFERENCES...44
LIST OF ABBREVIATIONS...50
BIOGRAPHICAL NOTE...51
The Changing Public/Private Mix in the American Healthcare System
1. I
NTRODUCTION1.1 Research context and analytical approach
This paper addresses the changing role of the state1 in the American health care system during the past four decades. It starts from the point in time, when the state became an important actor through the introduction of the public health insurance programs Medi- care and Medicaid2 in 1965. The economic crisis following the oil price shocks in the 1970s, however, forced the government to put cost containment strategies at the top of its agenda. The pertinent question here is therefore, how the role of the state has changed under the condition of “permanent austerity” (Pierson 2001). As the state is not the only actor in the American health care system, a complex interplay between public and private interventions (Hacker 2002: 23, Oberlander 2002) will come under scrutiny.
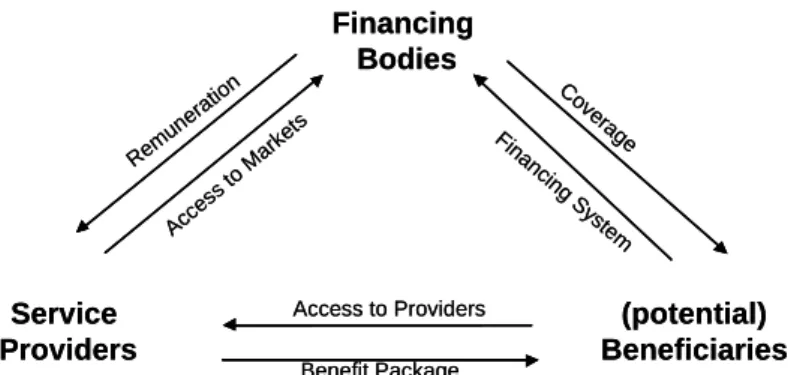
In order to approach this research question in a systematic way, a multidimensional analytical framework is suggested distinguishing between the role of the state in financ- ing, service provision, and the regulation dimension of health care systems (Roth- gang/Cacace/Grimmeisen et al. 2005). Using the analogy of a house (figure 1) that represents the health care system in total, financing and service provision are the pillars.
The regulation dimension represents the roof and therefore relates to the pillars by de- scribing which aspect of the health care system, financing or service provision, is regu- lated. The fundament symbolizes the values, goals, and perceptions in health care.3 Figure 1: Financing, service provision and regulation of health care systems
Source: Rothgang/Cacace/Grimmeisen et al. (2005)
1 In the US-context the notion of “the state” might be somewhat misleading. In this contribution, “the state” is the
summary category for the federal, the states’, and the local governments. I will refer to “the states” in the follow- ing, whenever addressing the single member states.
2 Medicare and Medicaid provide health care coverage for the aged, the disabled, and for the indigent.
3 This part of the house will not be explored here. See Albrecht/Frisina (2006) for a comparative examination of values in the health care systems of Britain, Germany, and the US.
Historically, market competition has been the dominant coordination mechanism in the health care system of the United State emphasizing the relevance of private actors in all aforementioned dimensions: in financing, in service provision, and in the regulation of health care. During the observation period, the growing role of the state primarily be- comes manifest in funding of health care and in the regulation of these government- funded programs. This is most surprising as conventional wisdom about the de- regulatory American state in general, and the “private nature” (Docteur/Suppanz/Woo 2003: 5) of the health care system in particular, teaches us the contrary. But in 2003, the level of public health expenditure measured as a percentage of the GDP was exactly as high in the US (6.8%) as, for example, in the United Kingdom; a country in which the role of the government in health care financing is very strong (OECD Health Data 2006). Not even included in these figures are considerable amounts of tax exemptions (about 1% of GDP) through which the federal government subsidises private employ- ment-based health insurance. Thus in terms of total health care expenditures, today more than half of spending comes from public sources.
A second major trajectory of change to be explored here was initiated by the emer- gence of a phenomenon which is often viewed as particularly American (Glied 2000:
709), namely through managed care4. Managed care deeply affects the relationship among the three main actors in health care systems: insurers, providers and beneficiaries (Hacker/Marmor 1999). A highly diverse array of managed care arrangements has al- most completely supplanted conventional indemnity insurance5 today. In short, man- aged care arrangements brought about their own, particular instruments of steering pro- viders’ and patients’ behaviour. From a regulatory perspective, a hierarchical form of governance has been established. Interestingly, although the US-government supported the spread of HMOs in the 1970s and contracts with private managed care organizations
4 Managed care is often contrasted with conventional indemnity insurance highlighting that there is “some kind of
interference” in the transactions between insurers, doctors, and patients in the former. It is, however, not easy to define managed care in general, as it encompasses a highly diverse array of institutional arrangements. Thus al- though a catch-all-definition of managed care would be very helpful at this point of reading, it is impossible to provide one. Hacker and Marmor (1999) take this point and propose to make no general statement about managed care at all but to differentiate carefully between different forms that emerged, i.e. between Health Maintenance Organizations (HMOs), Point of Service (POS), or Preferred Provider Organizations (PPOs) for example. I fol- low this proposition in my examination of managed care in section 2.
5 Indemnity insurance was the dominant private health insurance arrangement until in the late 1980s (Kaiser/HRET
2006). In the US, indemnity insurers reimburse for covered health care services only according to a percentage of what they consider the “usual and customary” charge. The provider is allowed to balance bill, i.e. to charge the patient for the difference. In addition, indemnity insurers require cost sharing from the insured persons.
today, it is not the state but private market participants that created this hierarchical mode of coordination (Cacace 2008, cf. Hsiao 2002).
In order to explore these changes in detail, this contribution continues with a health care system overview (1.2). A short legislative history in section 1.3 provides with in- formation on the most important reforms between 1965 and today. Due to its crucial importance, the next section (section 2) is dedicated to managed care, its growth and the instruments applied. What follows is a detailed assessment of the changing role of the state. By applying the analytical framework put forward above, changes are examined in the financing dimension (section 3), in service provision (section 4), and in the regula- tion dimension (section 5). Finally, section 6 concludes by bringing together the evi- dence about the changing public/private mix in the American health care system.
1.2 Health care system overview
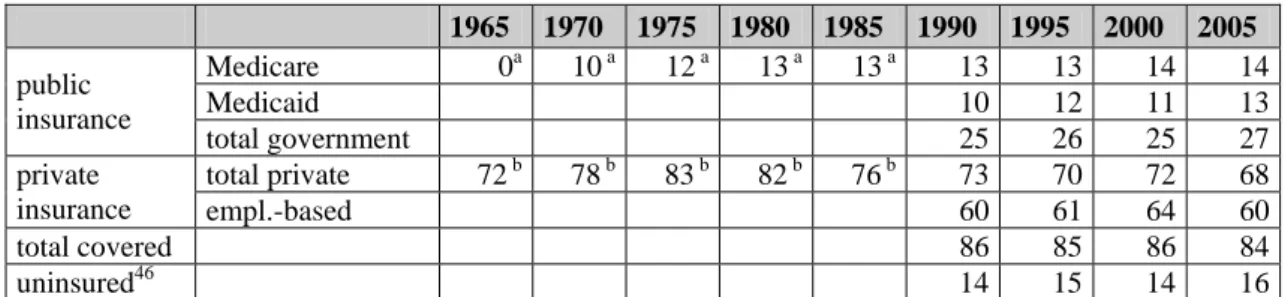
Today, about 68% of the US population has private insurance; either employment based (60%) or as directly purchased individual plans (9%). The most vulnerable low-income groups (13%) as well as the aged over 65 and the disabled (14%) are covered by the main public insurance programs Medicare and Medicaid (US Census Bureau 2006).
Although it had repeatedly been on the political agenda, no mandatory universal health insurance scheme has yet been legislated in the US. Thus in 2005, 16% of the US popu- lation was without health insurance.6 Furthermore, due to inadequate benefit packages, millions must be considered as underinsured (Schön/Davis/How 2006, Stone 2000).7
In private insurance, premiums are calculated based on the expected health risk. De- pending on the specific health plan, cost sharing8 is required from the insured person.
The major part of the privately insured receives coverage through group health plans provided by the employer on a voluntary basis (employer-sponsored health insurance).
The state influences employer’s decision to offer coverage by making their contribution tax deductible. These tax subsidies are quite substantial as they account for 113 billion US$ (US OMB 2006), i.e. about 1% of the GDP or 7% of total health care expenditure.
6 Due to double coverage, these figures do not add up to 100%.
7 According to the US Census Bureau (2006: 20) people were considered “uninsured” if they were not covered by any type of health insurance at any time in the previous calendar year. Under the category of “coverage” head counts are reported (see section 5.1). The term “underinsured”, however, relates to the content of the benefit package, i.e. the number and kinds of services included in an insurance contract (see section 5.6) and means that some insured persons, although they are covered by insurance, receive only a minimum of health care benefits.
8 Cost sharing may have the form of deductibles, coinsurance rates, and co-payments, or any combination of these
elements. A deductible means that a certain amount (like first US$ 500 per year) is to be paid out of the patient’s pocket before the insurance makes any pay-outs. Coinsurance is usually paid as a percentage rate (e.g. 10%) of the health care bill. Co-payments are defined as fixed amounts required per doctor visit, for example.
Employers either self-insure9 their employees or they contract with private health in- surers in order to provide coverage. As they pay the major part of the insurance pre- mium, i.e. between 73% of the cost for family insurance and 84% for individual cover- age on an average (Kaiser/HRET 2006: 61), they pre-select the health insurance plans offered to their employees. Employers’ choice therefore plays a major role in the com- petition between plans (Cacace/Rothgang/Thompson 2007, Keen/Light/Mays 2001). In employer-sponsored insurance, the number and the risk structure of employees within the firm is relevant for premium calculation. Small employers with a few severely ill employees may face prohibitively high premium costs (Reinhardt 1993, Kaiser/HRET 2006). Thus, while most large employers offer health insurance, a great deal fewer small businesses actually provide coverage.10 By the same rationale, private health insurance can be unaffordable for single individuals who are not covered by group insurance. All these factors contribute to the fact that insurance coverage is closely linked to the spe- cific working place.
The public Medicare program is established as a social insurance scheme that pro- vides health benefits to all individuals aged over 65. The program is divided into Part A for hospital insurance and Part B covering outpatient doctor visits. In both cases rela- tively high co-payments are required from the beneficiaries and some services like e.g.
long-term care, are not covered by Medicare at all (Green Book 2004). As a conse- quence, many beneficiaries in addition hold a private insurance policy called Medigap11 in order to insure them against cost sharing and for uncovered services.
Medicaid, by contrast, is a means-tested program financed through federal and state tax revenues. Medicaid offers quite comprehensive coverage for the health care needs of the most vulnerable parts of the poor population (Reinhardt 2005). At present, all gov- ernment funded health care programs12 taken together account for nearly half of total health care spending.
9 Self-insurance is a health care financing technique by which employers pay claims out of an internally funded
pool bearing the full financial risk for the health care cost of their employees. Occasionally, the administration of plans is left to private insurance carriers.
10 In 2006, only 60% of firms with 3-199 workers offered coverage compared to almost 100% of large firms (200 or more workers). This number declined from 68% in 2000 (Kaiser/ HRET 2006: 34).
11 Medigap is a supplementary health insurance policy sold by private insurance companies to cover the services not
included in the Medicare program. Medigap policies are regulated by federal and state law and are standardized in order to secure comparability.
12 In addition to Medicare and Medicaid, the government finances some minor programs like e.g. the public health programs and some programs provided for special population groups, like the active members of the military ser- vices and their families and the veterans (e.g. TRICARE, Veteran Affairs).
The delivery of services, with the medical profession and hospitals as the chief ac- tors, is largely the domain of the private sector. Hospitals, represented by the American Hospital Association (AHA), are mainly private non-profit providers. Although some physicians13 are directly employed in hospitals or in Health Maintenance Organizations (HMOs), most are self-employed private professionals either working independently or as part of a medical group (Walshe 2003: 52, Jacobson 2001). The medical groups in- corporate a number of physicians, either in a single specialty area but often across a number of specialties (multispecialty groups). The majority of specialists conduct their practices within a hospital setting.
Since the concern for the quality of health care provision has increased in recent years, service providers are increasingly monitored and evaluated. Managed care or- ganizations, too, are held responsible when the quality of care is not met. For this pur- pose almost all US-member states have passed patients’ right laws providing the legal basis for litigation against health insurance plans in the cases when needed services are denied (Docteur/Suppanz/Woo 2003, Flood/Stabile/Tuohy 2001). This also gave rise to some regulatory power being given to the courts.
Due to the simultaneous decentralization and fragmentation of the American health care system, administrative costs14 are high and considerable sources of inefficiencies exist (Woolhandler/Himmelstein 2002, Reinhardt 1993). Thus while the advocates of the system speak in favor of the freedom of choice and consumers’ sovereignty, critical observers condemn its “undesirability, unaffordability, and ungovernability” (Mar- mor/Mashaw/Harvey 1992: 175). Indeed, health care in the US is the most expensive within the OECD world consuming more than 15% of the GDP, while the nation as a whole ranks relatively low on customary health-status indicators (Schoen/Osborn/
Huynh et al. 2005, Reinhardt 2005). On the other hand, the American health care sys- tem has brought about some innovations, the most path-breaking examples being man- aged care and Diagnosis Related Groups (DRGs15), which were the forerunners for simi- lar arrangements all over the OECD world.
13 The term “physician” in this case study is used as a summary category for the whole profession, i.e. for primary and specialist care doctors, surgeons etc.
14 It is estimated that about 25% of total health care spending today is absorbed by administration (Woolhan- dler/Himmelstein 2002).
15 DRGs were introduced in 1983 by the Medicare program as a reimbursement method for hospital stays. In con-
trast to the cost reimbursement method that was supplanted, the DRGs are calculated in advance, i.e. prospec- tively. For DRG calculation, all illnesses are split into currently about 540 groups and costs per case are estimated within each group. Adjustments are made for certain factors such as local wage levels, teaching hospitals, dura- tion of stay, and hospitals with a large proportion of indigent patients. DRG payments cover the hospital stay in-
1.3 The major reforms
In 1965 the Johnson administration enacted Medicare and Medicaid as publicly funded programs under the Titles XVIII and XIX of the Social Security Act. Medicare falls within the authority of the Department of Health and Human Services (DHHS) and is now administered by the Centers of Medicare and Medicaid Services16 (CMS). In the Medicaid program, the federal government sets the broad guidelines under which the states administer the single programs.
After the state increased the access to health care through Medicare and Medicaid, the oil price shock and “tax payer’s revolt” forced the government to put cost contain- ment strategies at the top on the agenda (Marmor 2000, Patel/Rushefsky 1999). Once that this need was of paramount importance, the debate about how to cope with soaring health costs centered on two broad approaches; namely whether the state or the market is more promising in achieving this objective (Marmor/Mashaw/Harvey 1992). There- fore, as a regulatory measure, the federal government and the states began to control the number and the rates of hospitals beginning in theearly 1970s. In addition, peer review organizations were established to evaluate and monitor care provided in the publicly funded programs. At about the same time, the federal government promoted the cost saving effects of HMOs. In 1973 it established the HMO Act targeted at the spread of managed care in private and in public settings. Although both approaches to contain health care cost – the regulatory and the market based – were applied, their success was limited. Continuingly rising medical costs combined with a recession during 1973–1975 contributed to the withdrawal of proposals to establish a national health insurance pro- gram in the mid-1970s (Patel/Rushefsky 1999).
Although Medicare and Medicaid were under severe fiscal pressure almost from the moment the programs began, major inclusion processes into the public schemes halted.
In 1981 President Reagan’s proposal to abolish the entitlement character of the Medi- caid program failed to pass the Congress, but the program nevertheless experienced some major changes. In line with Reagan’s “new federalism” the states got more discre- tion in defining eligibility rules and also obtained waivers17 to force Medicaid benefici- aries into private managed care plans. In the Medicare program, a prospective payment system (PPS) based on Diagnosis Related Groups (DRGs) was introduced in 1983.
Thus, in contrast to his rhetoric of deregulation, the Reagan administration in fact more
cluding all ancillary services without surgery and other physician fees. Investment costs are included to a certain degree (Getzen 2004).
16 The CMS until 2001 was known as the Health Care Financing Administration (HCFA).
17 Waivers allow the member states to deviate from federal regulation in the Medicaid program.
heavily regulated the public health care programs, especially as the medical profession is concerned.
In private insurance, the McCarran-Ferguson Act of 1945 assigns general regulatory and tax collecting competency to the single member states (Jost 2001, Pol- litz/Tapay/Hadley et al. 2000). Thus a decentralized approach is taken with the conse- quence of considerable variation between the member states. What is more, in 1974, through the Employee Retirement Income Security Act (ERISA), the federal govern- ment exempted all self-insured health plans from the states’ taxation, regulation, and control (Hacker 2004, Gabel/Jensen/Hawkins 2003).18 Unregulated private insurance, however, produces adverse effects. Thus the de-regulations of ERISA worsened the situation of the uninsured (Cacace/Rothgang/Thompson 2007). To partially overcome these limitations, the federal government mandated the COBRA-plans19 in 1985 as a minimal protection of workers in the transition between jobs.
In order to solve the problem of the high number of uninsured, President Clinton proposed to establish mandatory insurance on the basis of “managed competition” (cf.
Enthoven/Kronick 1989a,b) in 1993. According to the proposal, coverage should be provided through employers in a government-regulated, but highly competitive insur- ance market. The reform proposal, however, failed against the strong resistance of sev- eral actors (Quadagno 2005, Giaimo/Manow 1999). After the defeat of the Clinton plan several incremental steps were taken to increase access to existing public and private programs (Hackey 2001, Walshe 2003, Pollitz/Tapay/Hadley et al. 2000). In 1996 the Health Insurance Portability and Accountability Act (HIPAA), for example, was estab- lished to secure portability and the continuation of private group insurance. HIPAA is a federal law, thus all states and all health plans, even those exempted under ERISA, have to comply with HIPAA. Another step in this direction was the Balanced Budget Act (BBA) of 1997. With the BBA President Clinton signed the most noteworthy extension
18 For example, most US-states mandate private insurers to finance an internal risk-pool in order to cover those parts
of the population who are otherwise hard to insure (Acs/Long/Marquis et al. 1996). Under ERISA, self-insured health plans do not contribute to the financing of these pools. The effects of ERISA have been quite substantial as self-insurance grew considerably. While in 1984 only about 8% of all insured workers were covered by self- insurance, currently 55% are in some sort of self-insured health plan (Erdmann 1995: 102, Kaiser/ HRET 2006:
127).
19 In the case of job loss or in the transition between jobs, COBRA-plans enable the individual to continue group
health plans on a premium, which is calculated on the basis of risk pooling. However, the duration of COBRA plans is restricted from 18 to a maximum of 36 months, and the insured has to pay the full costs (102%) out of his/her own pocket. COBRA-plans received their name as they are created under the Consolidated Omnibus Budget Reconciliation Act (COBRA) of 1985.
of Medicaid, the State Children’s Health Insurance Program (SCHIP), into law. In addi- tion, the Medicare+Choice (Part C) program was created, which gave Medicare benefi- ciaries a wider choice of managed care health plans. HIPAA and the BBA legislation also laid the fundamentals for Medical Saving Accounts (MSA)20 in private insurance and in the Medicare program thereby underlining the increasing reliance on private market arrangements in the public programs (Fuchs/James 2005).
The growing importance of the private sector arrangements also becomes most evi- dent when considering the most recent Medicare legislation, the Medicare Prescription Drug, Improvement, and Modernization Act (MMA) of 2003. The MMA was enacted to offer a voluntary drug benefit21 to subscribers to be phased in by 2006. The benefit can be offered as a stand-alone benefit (Part D) or as a part of managed care plans, which from 2003 on was called Medicare Advantage thereby replacing Medicare+Choice. In both cases, private insurers offer the drug benefit and are allowed to negotiate with pharmaceutical companies for drug prices; thus the boundaries between the public and the private become increasingly blurred (Gold 2005).
2. T
HE EVOLUTION OF PRIVATE HIERARCHY IN THE MANAGED CARE MARKETThe fundaments for managed care were laid as early as in the 1930s, but it took a con- siderable time span for managed care to break through. With managed care a new and exceptional mode of governing the health care system emerged, as hierarchical control over market participants is exerted by private actors, namely by private health insurers (Cacace 2008, cf. Hsiao 2002). Due to the impact of these events for the following ar- gumentation, this section is inserted here to provide an overview of the instruments ap- plied in managed care (section 2.1) and the most relevant stages of its evolution (section 2.2). From the highly diverse array of managed care arrangements, it focuses on the Health Maintenance Organizations (HMOs), the Preferred Provider Organizations
20 MSA are part of a broader range of insurance products called consumer-driven health plans, which rely on high
deductibles in order to make consumers price-conscious about their choices. MSA must be combined with very high-deductible health plans providing only a minimum benefit to the insured. The money saved in the accounts may be spent on the benefits at the time services are needed.
21 The MMA is criticised because the statutes prevent the CMS from bargaining with drug companies for lower
drug prices leaving this task explicitly to the private health plans that offer the benefit, instead. Another critical issue is that the program heavily relies on consumer out-of-pocket payments. The standard drug benefit in 2007, for example, requires a deductible of US$ 265. Once this deductible is reached, the enrolee pays a coinsurance rate of 25%. If total spending for drugs reaches 2,400 US$, the enrolee has to bear all cost until total spending reaches about 5,450 US$ (doughnut hole) (Kaiser Foundation 2007). From that amount on, the consumer receives catastrophic coverage, but still has to contribute a 5% coinsurance rate.
(PPOs), and Point of Service Plans (POS). These organizational forms are the most common arrangements in a highly diversified managed care market and most appropri- ate for an illustration of the ongoing changes.
2.1 The mechanisms of governance in managed care
Although there is no single broadly accepted definition, there seems to be some agree- ment that managed care differs with respect to the specifications of the contractual rela- tionship between insurer, patients and service providers from conventional insurance (Glied 2000: 709, cf. Cacace 2008). More specifically, managed care organizations may interfere in the relationship between doctor and patient and limit the services provided, or they may contract with selected providers only (selective contracting), thereby limit- ing the choice of provider. What complicates the analysis, is the fact that the instru- ments applied to control providers’ and patients’ behaviour once differed largely be- tween the organizational forms but become increasingly mixed today (cf.
Hacker/Marmor 1999).
In the first Health Maintenance Organizations (HMOs) that emerged in the American health care market, insurers and service providers became integrated into one organiza- tion (see e.g. Wagner 2003, Patel/Rushefsky 1999). For this purpose, HMOs employed primary and specialist care providers on a salary and built up or acquired their own clin- ics. Thereby HMOs not only merged the functions of insurance and service provision under unified ownership, but also tightly integrated inpatient and outpatient care provi- sion (Newbrander/Eichler 2001). This vertically and horizontally integrated organiza- tional form stands in deep contrast to traditional indemnity insurance where insurers, inpatient and outpatient care providers were used to operate independently from each other. While in indemnity insurance the provider is reimbursed according to the fee he or she demands (fee-for-service principle), the services in an HMO are provided at a fixed price agreed upon in advance (prospective payments). Over time, the HMO mar- ket became highly diversified with the staff-model, the group-model, the network- model, and the independent practice association (IPA)22 as the core managed care or- ganizations. In addition, so called “mixed models” emerged which combine at least two
22 The staff-model characterizes an HMO where the physicians are employed on a salary. In the group-model, the HMO contracts with a provider group, which in turn employs the single physicians. The group-model HMOs (like the staff-models) are closed-panel HMOs, because the physicians must be members of the contracted group practice to participate in the HMO. In the network-model and in Independent Practice Associations (IPAs) the HMO contracts with more than one provider group and also with individual practices in the latter. IPAs are an open-panel arrangement, which means that they contract with all physicians who meet the selection criteria of the IPA and the HMO. Network-HMOs in contrast can be either closed or open-panel HMOs (cf. Wagner 2003).
aforementioned HMO-models. Since about one decade, the portion of the IPAs and of mixed models grew markedly amongst HMOs.
In the staff-model HMO, physicians are employed on a salary, which is optionally combined with a financial incentive (bonus/malus option) (Wagner 2003, Ame- lung/Schumacher 2004). In all other cases, i.e. the group-model, the network-model, and the IPAs, the HMO selectively contracts with one or several multispecialty provider groups. Providers are selected according to their economic and quality-related perform- ance (credentialing), and contract renewal depends on the providers’ actual performance characteristics (Kongstvedt 2003, Erdmann 1995). Selective contracting implies some scope for negotiation between insurers and providers. Thus, depending on the competi- tive market environment, the HMO can use its market clout in order to bargain for lower prices (Amelung/Schumacher 2004). Payment is usually performed on a prospec- tive all-inclusive capitation rate, which means that providers receive a fixed sum per HMO-subscriber (Wagner 2003). Although the capitation rates are risk-adjusted, usu- ally by taking age and gender as indicators, the risk of treatment is shifted from the in- surer towards the provider. Therefore the service provider is forced to match economic considerations with medical treatment decisions if he contracts with an HMO on a capi- tation basis. But also mixed remuneration methods are applied, including discounts on a fee-for-service rate where a portion of payment is withheld and paid out depending upon the performance of provider. In addition, providers have to accept review proce- dures and further inference in clinical decision-making.
Not only the provider’s, but also the patients’ behavior is controlled in an HMO.
There are several restrictions put on patients’ utilization of care. For example, the pa- tient’s free choice of doctors, a principle that was traditionally upheld in indemnity in- surance, is constrained to pre-selected providers. In most HMOs a gatekeeper, which in general is the primary care physician, restricts patients’ access to specialists and option- ally also to inpatient hospital care. Depending on the seriousness of their ailment, pa- tients in HMOs might not even see a physician at all during their episode of illness, as new professional careers like the nurse practitioner or the physician assistant were es- tablished to provide appropriate care at lower cost (Scott/Ruef/Mendel et al. 2000). Cost sharing, as an alternative method of steering the excessive consumption of services (moral hazard), in general is not applied by HMOs. With this respect HMOs differs crucially from indemnity insurance and from the Preferred Provider Organizations, which are illustrated next.
In a Preferred Provider Organization (PPO), a network of self-employed providers is related to the managed care organization through contracts. In this respect PPOs do not differ substantially from most HMOs. Instead of using a capitation, remuneration is usually performed on discounted fee-for-service rates (Kruse 1997). The discounts pro-
vide some scope for bargaining and each party’s relative negotiation strength deter- mines how the risk shared between the providers and the managed care organization (Amelung/Schumacher 2004, Joffe 2003). Although discounted fee-for-service pay- ments typically do not concentrate as much risk on physicians as when capitation pay- ments are applied, physicians’ behavior is monitored by utilization reviews23 and stan- dardization requirements. Selective contracting is also a powerful instrument to influ- ence physicians’ behaviour and as the PPO network constitutes an important source of revenue, physicians are concerned not to be de-listed from the provider panels (Rich/Erb 2005). Because there is usually no gatekeeper, patients in a PPO have direct access to specialists (Newbrander/Eichler 2001). Additionally, they may choose a pro- vider from outside of the contracted network, yet at the cost of higher co-payments.
The Point of Service Plans (POS) combine the features of HMOs and PPOs. In POS the consumer chooses a provider at the time the service is needed and makes co- payments if he does not accept gatekeeping or the pre-selected network. Therefore the POS and PPO alike provide more choice but at the same time use cost sharing as an instrument to influence consumer’s behaviour.
2.2 The proliferation of managed care
Managed care health plans compete with traditional indemnity insurance on lower prices for services and lower cost sharing while at the same time providing more com- prehensive benefit packages (Erdmann 1995). As a result of this highly competitive process indemnity plans, which had prevailed in employer-sponsored health insurance at 73% in 1988, were almost completely driven out of the market by 2006 (3%) (Kai- ser/HRET 2006: 57). At the same time, many fundamental changes within the managed care landscape took place, like e.g. the increasing “profitization” of managed care or- ganizations, the rapid growth of the Preferred Provider Organizations (PPOs), and the increasing demand for regulation as one consequence of the managed care backlash24.
23 According to the point in time they set in, utilization reviews are categorized as prospective, concurrent or retro-
spective instruments. Pre-certification or second opinion requirements, for example, mean that approval must be obtained from the insurance company, before elective surgery is performed (prospectively). As a form of retro- spective review, managed care organizations will sometimes refuse to pay for services that do not meet their standards (Getzen 2004: 205).
24 The backlash describes an increasing reservation of the public against managed care as a consequence of quality concerns, rising especially in conjunction with the HMOs from the mid-1990s on (Blendon/Brodie/Benson et al.
1998).
In the 1970s, when managed care was still rare, relatively small non-profit25 Health Maintenance Organizations (HMOs) were the only arrangements that were offered.
From the mid-1980s on, HMOs experienced enormous growth, increasing consolida- tion, and the conversion into commercial for-profit enterprises (“profitization”). While in 1981 only 12% of all HMO enrolees subscribed to a for-profit plan, this number in- creased to 63% by 1997 and remains at that level until today (CMS 2003a). HMOs pro- liferated quickly; within less than 10 years they doubled their market share from 16%
(1988) of all covered workers to 31% in 1996 (Kaiser/ HRET 2006). From 1996 on, the number of HMO enrolees declined and the more loosely structured PPOs, gained ground in the managed care market, a development referred to as the managed care backlash. In response to the backlash, most HMOs started Point of Service Plans (POS) in order to regain market share. POS peaked around 1998/99 with 24% of all covered workers but declined thereafter. By 2005 only 21% of all covered workers subscribed to a HMO, and 13% to a POS with declining tendency, while PPOs account for 61% (Kai- ser/ HRET 2006). As the for-profit ownership is even more prominent in PPOs, more than 70% of managed care organizations are for-profit today (Town/Feldman/
Wholey 2004).
Now turning to the role which the state played in these changes, the federal govern- ment clearly supported the spread of HMOs in public and in private settings. Convinced by the efficiency gains to be attained, the federal government passed the HMO Act in 1973. The HMO Act advised employers with more than 25 employees (who offer health insurance to their workers at all) to include at least one managed care plan in their set of choices. In addition, federal funds were provided to HMOs, which qualified26 to serve Medicare beneficiaries. The HMO Act had some effects on the growth of HMOs, but only further deregulation, including the federal requirement to relax states’ restrictions on selective contracting in the 1980s, supported the breakthrough of managed care (Glied 2000). In the 1980s the state assumed a more active role in promoting managed care amongst the beneficiaries of the public programs. Initiated through the Omnibus Budget Reconciliation Act (OBRA) of 1981, the US-member states received the option
25 Non-profit HMOs receive subsidies but are also subject to premium regulation. Most importantly, they are not allowed to adjust their premium rates to the individual health risk but have to apply community rating, which is the same mode of premium calculation like e.g. social insurance schemes. Non-profit HMOs therefore have com- petitive disadvantages as compared to for-profit organizations. I will come back to this important difference in detail when discussing the regulation of the financing system in section 5.2.
26 These qualification requirements were highly restrictive and therefore somewhat released in the late 1970s and early 1980s.
to waive27 from federal Medicaid regulation in order to move beneficiaries into private managed care plans. Through the Balanced Budget Act (BBA) waivers were no longer required to make participation in managed care mandatory from 1997 on (Glied 2000).
The percentage of Medicaid beneficiaries choosing (or having to choose) managed care grew from 9.5% in 1991 to 58% in 2002 (Hackey 2001, CMS 2003a). For Medicare beneficiaries, yet the incentives to join managed care plans were modest by comparison.
As most Medicare beneficiaries hold Medigap policies, which insure them against the risk of cost sharing and incomplete benefit packages, participation in managed care is less attractive. Moreover, Medicare beneficiaries are used to having a free choice of provider and therapy (Reinhardt 2005), a principle that is not supported by managed care. Thus market penetration of Medicare+Choice was low; peaking at 16% in 1999, and declining thereafter to 14% in 2002 (CMS 2003a). However, with the most recent Medicare reform, the MMA of 2003, participation rate in managed care plans is ex- pected to increase (Gold 2005).
While the federal and the states’ government embraced an active role in moving Medicare and Medicaid beneficiaries in managed care plans, the states’ governments have also been active in passing laws that restrict managed care practices from the mid- 1990s on (Rich/Erb 2005: 244). In response to lobbying by consumers and health care providers, many states legislators enacted Patient’s Bill of Rights for consumer protec- tion and so called “anti-managed care laws”28 (Quadagno 2005, Aspen Health Law Cen- ter 1998). While the consumer protection laws enabled the litigation of managed care organization in the case of the denial of service regarded as necessary, the anti-managed care laws allowed some providers, especially pharmacies, the access to managed care markets (Flood/Stabile/Tuohy 2001, Jensen/Morrisey 1999). The states thereby limited the degree of control managed care organizations were able to exert on patients and pro- viders.
3. T
HE FINANCING DIMENSIONIn order to explore the changing role of the state in the American health care system, we now turn to the three analytical dimensions, i.e. to financing, service provision, and regulation. To start with the financing dimension, the role of the state is measured quan-
27 The waiver applied in this case is the section 1915(b) (freedom-of-choice waiver), which allowed the states to experiment with new modes of provider reimbursement.
28 Anti-managed care laws denote any-willing-provider (AWP), freedom-of-choice and direct-access regulation,
designed to delineate the nature of provider-panels created by managed care firms. AWP regulation requires a managed care organization to include or contract with any provider who is willing to accept the terms of the net- work. Freedom-of-choice and direct-access laws allow subscribers to obtain services from any licensed provider outside the network (at higher co-payments) or to bypass their gatekeeper (Jensen/ Morrisey 1999).
titatively as the portion of public spending on total health care expenditures. Under pub- lic expenditures, tax funded programs as well as social insurance schemes are sub- sumed.29 The private sources of health care financing comprise private health insurance, out-of-pocket payments, and other private funds such as charities – a source with some relevance in hospital funding in the US. Thus after a short presentation of the total level of health care spending in the American health care system (section 3.1), this section turns to the public/private mix, i.e. the structure of financing health care (section 3.2).
Furthermore, a detailed picture of the role of the state in terms of financing is provided by an inter-sectoral comparison (section 3.3). The sectoral approach differentiates be- tween inpatient (hospital) care, outpatient (ambulatory) health care, the dental health care sector and the pharmaceutical sector. Section 3.4 summarizes the results of the fi- nancing dimension.
3.1 The changing level of financing
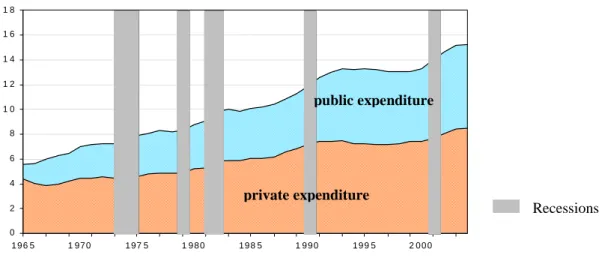
Total health care expenditure in the US increased from US$ 205 per capita in 1965 to US$ 6.100 in 2004 (OECD Health Data 2006). Over the same period, total expenditure in percentages of the GDP rose from 5.6% to 15.3%, which is the highest rate of all OECD countries30. The expenditure growth rate shows no linear progression; phases of accelerated growth and intermission can be observed instead. In addition, as we see from figure 2, some periods of expenditure growth like, for example, in 1981/82 and in 2001 correspond with phases of economic recession31. Though in the other periods, health care cost measured as a share of GDP rose without changes in the denominator.
29 In other countries, like Germany or Austria, for example, social insurance contributions are associated with self-
governing autonomous collective actors (Rothgang/Cacace/Schmid 2006). This is not the case in the US, how- ever. Therefore both tax funding and social insurance financing are considered jointly and attributed to the role of the state.
30 The OECD average in 2004 was 8.8%.
31 The phases of economic recession date to the years 1973–1975, 1980, 1981/82, 1990/91 and 2001 (NBER 2007).
Figure 2: Total health expenditures as a share of GDP
Recessions
0 2 4 6 8 1 0 1 2 1 4 1 6 1 8
1 9 6 5 1 97 0 1 97 5 1 9 8 0 1 9 8 5 1 9 9 0 1 9 9 5 2 0 0 0
public expenditure
private expenditure
Source: OECD Health Data 2006
Until in the early 1980s, the growth of total health care expenditures was mainly fed by an increase in public expenditure caused by the introduction and the expansion of the public Medicare and Medicaid programs. Starting from 1983, when Diagnosis Related Groups (DRGs) were introduced in the Medicare program, public expenditure growth stagnated. But there were no long-run effects of DRGs on health care costs (Getzen 2004: 391). Medicare and Medicaid expenditures steeply increased thereby consuming an ever-increasing share of the GDP. Thus the public programs have been the main driving force for an increase of total health expenditures in the beginning of the 1990s.
Private expenditures, on the other hand, accelerated in the 1980s and remained almost constant from 1992 on, fluctuating around 7–7.5% of GDP and even shrinking occa- sionally in absolute terms. The decade of the 1990s is marked by a rapid expansion of managed care in private health insurance followed by the inclusion of Medicaid benefi- ciaries into private managed care plans. The observations therefore support the view that managed care had considerable effects on the containment of health care cost.32 Starting with the economic shock in the aftermath of 9/11, total health expenditure again has risen rapidly in absolute terms and, due to a slow-down in economic growth, even more dramatically in relation to the GDP (CMS 2006). Cumulated over five years, between 2000 and 2005, premiums for family coverage have increased by 73% (!), compared with inflation growth of 14% and wage growth of 15% (Kaiser/HRET 2005:
32 Managed care has been evaluated many times for its cost-containing and quality-related performance (see e.g.
Miller/Luft 1997, Miller/Luft 2002). Most surveys concluded that they significantly reduced health care cost al- though some of these savings may have been achieved by selecting subscriber groups with favourable risk- structure (cream-skimming). The evidence about the quality of service provision is more mixed, however. For an overview of the cost and the quality issues in HMOs see e.g. Rich/Erb (2005) or Glied (2000).
1, cf. Kaiser/HRET 2006: 18). Hence, since the beginning of the new millennium the longest period of slow growth in health care expenditure has come to an end.
3.2 Changes in the financing structure
Before Medicare and Medicaid were introduced, only about 23% of total health expen- diture came from public funds, mainly from taxes, while the overwhelming share in health care expenditure derived from private sources, especially out of pocket (45% in 1965). At that point in time, only some minor programs, i.e. workers’ compensation and temporary disability insurance were financed by some sort of social insurance contribu- tion (CMS 2006).
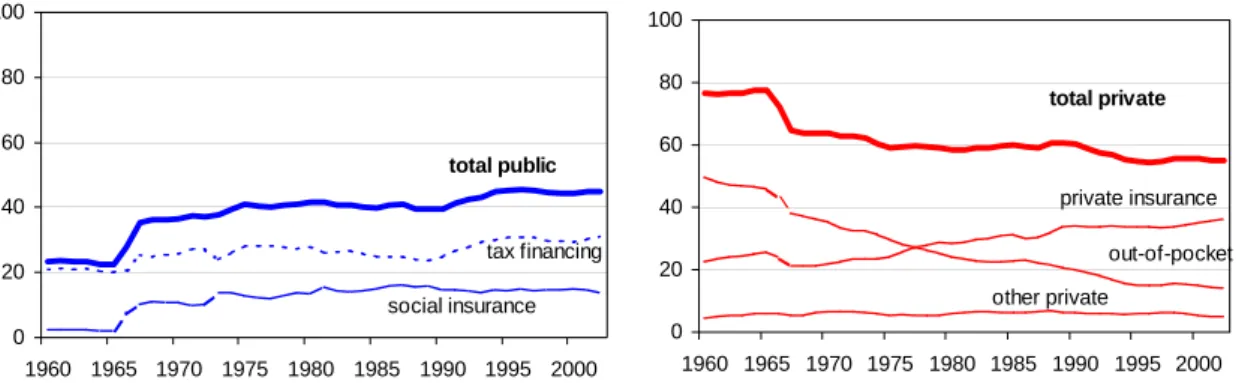
Figure 3 illustrates that with the implementation and expansion of Medicare and Medicaid, the public/private mix of financing health care in the US underwent a funda- mental change. Public tax financing and social insurance financing increased considera- bly while private expenditures decreased correspondingly. The Medicare program gave considerable rise in social insurance funding thereby enforcing a principle that was hardly established in the American health care system.
Figure 3: Public and private financing as a percentage of total health care financing
Public financing in % of total financing
0 20 40 60 80 100
1960 1965 1970 1975 1980 1985 1990 1995 2000 total public
tax financing social insurance
Private financing in % of total financing
0 20 40 60 80 100
1960 1965 1970 1975 1980 1985 1990 1995 2000 total private
out-of-pocket other private
private insurance
Source: OECD Health Data 2006
The effects of the implementation of the public programs and an initial expansion phase resulting from the inclusion of disabled persons in the Medicare program lasted until around 1975. By 1975 public funding covered 41% of all health care expenditure, after which it levelled off, remaining relatively stable until it started increasing again in the early 1990s. The new flow of public funds mainly accrues to the tax-financed Medicaid program, and reflects several changes in the program features. The peaking poverty rate around 1993, the payments made to disproportionate share hospitals (DSH)33, and the
33 In the DSH program service providers are remunerated more generously for their services Medicaid payments since they serve a higher number of uninsured or underinsured patients than the average hospital, which serve a disproportionate share of Medicaid or low-income patients.
set-up of the State Children’s Health Insurance Program (SCHIP) in 1997 contributed to this increase (Kaiser Commission 2002). In 2004, almost 45% of health care expendi- ture came from public sources. About 32% of total health care expenditure was tax- financed; 12.5 % derived from social insurance contribution.
This picture changes, when tax exemptions are considered through which the federal government subsidises private employer-sponsored insurance. The practice of providing tax subsidies is not unusual within the OECD world, though it is quantitatively much more important in the US than in other countries (Adema/Ladaique 2005, Hacker 2002).
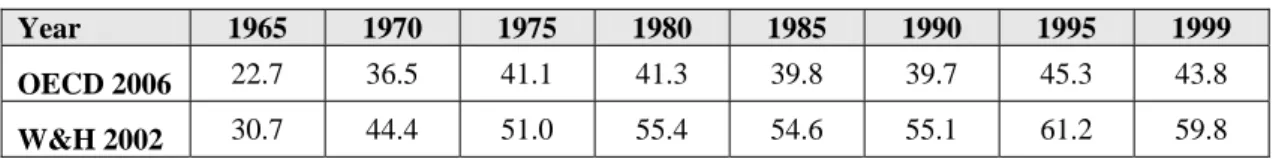
It is estimated that in 2006 the federal government has spent about US$ 133 billion (US OMB 2006), which is about 1% of the projected GDP of that year, in federal tax de- ductibles as subsidies to employer-sponsored health insurance programs.34 The OECD health data categorize the tax exemptions under private health care spending. As Wool- handler and Himmelstein (2002) emphasize, this assignment is incorrect as the subsidies are forgone tax revenues and therefore levied from public sources. Their re-calculation (see second line in figure 4) shows that this amount is quite substantial.
Figure 4: Diverging estimates of public health expenditures (in % of total exp.)
Year 1965 1970 1975 1980 1985 1990 1995 1999
OECD 2006 22.7 36.5 41.1 41.3 39.8 39.7 45.3 43.8
W&H 2002 30.7 44.4 51.0 55.4 54.6 55.1 61.2 59.8
Source: OECD Health Data (2006), Woolhandler/Himmelstein (2002)
According to these results, the public share started to surpass its private counterpart as early as 1975. The disparity between the estimates and the official figures widens over time. In 1999, almost 60% of total health expenditures came from public funds as com- pared to 44% reported by the OECD on the basis of national statistics. Hence, the role of the state in financing health care is considerably higher than is commonly assumed (Docteur/Suppanz/Woo 2003, Hacker 2002, Stone 2000). If this funding structure is then divided “tri-chotomously” into tax financing (45%), social insurance contribution (15%) and private financing (40%), US health care will be predominately tax-funded.
Therefore it is not appropriate to call the US a private system with respect to financing today.
When recalling figure 3 we see a second remarkable trend in US health care financ- ing; this time as an interesting shift within private financing. Although private insurance funding reacted to the introduction of Medicare and Medicaid with a temporary drop, it
34 By comparison, federal governments’ spending on Medicare was about US$ 309 billion in 2004 and US$ 173
billion on Medicaid. The co-financing of the states in the Medicaid program accounted for US$ 120 billion in 2004 (CMS 2006). Therefore, as Iglehart (1999) has already stated in 1999, tax expenditures make up the third largest federal health program after Medicare and Medicaid.
soon recovered, assuming a constantly growing share in health care financing. Thus at the same time when public funds have accounted for an ever increasing portion of the health care bill, private insurance financing also expanded and out-of-pocket payments declined (Levit/Freeland/Waldo 1990). Beginning in the 1970s and accelerated through the spread of managed care from the mid-1980s on, private insurance started to widen the scope of benefits and tighten requirements for out-of-pocket payments. While pri- vate insurance made up 25% of total health care financing in 1965, this figure had risen to 37% by 2004. Out-of-pocket payments for health care decreased from a high 45% in 1965 to about 30% in 1975 and down to 13.2% in 2004. This out-pocket-rate is remark- able as it is lower than Canada for example (14.9%) and even slightly below Denmark (13.9) (OECD Health Data 2006).
In sum, this means a considerable rise in collective financing through both, the public programs and private insurance financing as well. These quantitative data, however, have to be read with caution as they do not reflect the degree of solidarity achieved by collective financing in the US health care system. More precisely, solidarity in private health insurance financing is restricted as premium calculation, within some limits set by the federal and states’ governments, follows the principle of risk-equivalence (ex- perience-rating) and therefore implies only minimal re-distributional effects.
3.3 Intersectoral comparison
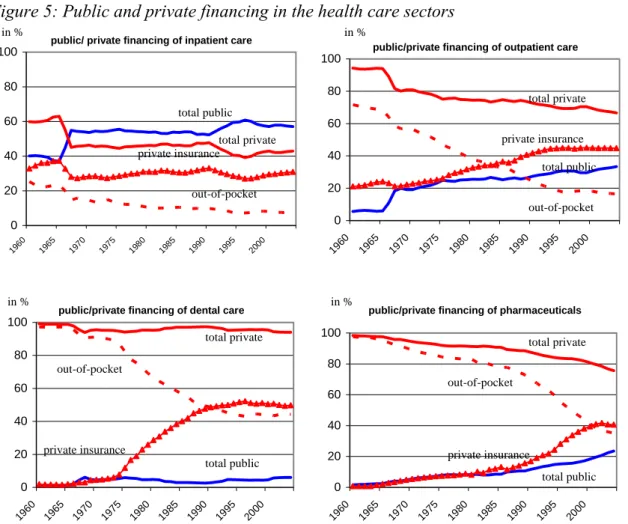
In order to investigate the trends described above in greater depth, public spending in the inpatient and the outpatient as well as the dental and the pharmaceutical sector will be examined separately here. At the beginning of our observation period, the role of the government in financing is rather modest in all sectors, but it is most prominent in the sector which consumes most resources, i.e. in inpatient care. In 1965, the public expen- diture constituted about 37% of total expenditure in the inpatient sector, as compared to 6% in outpatient care (CMS 2006). Public financing at this time was of almost no quan- titative relevance in either the pharmaceutical (2.4%) or in the dental health care sector (1.2%).
In the inpatient health care sector the public/private mix altered fundamentally when Medicaid and Medicare were introduced. Public expenditure rose from 37% (1965) to about 55% of total inpatient care expenditure in 1975. In the 1990s a second leap is ob- servable, augmenting the public share by another 5% to over 60% of total inpatient care expenditure. From the mid-1990s onwards this trend halted, and public financing of inpatient care fluctuated henceforward at around the 60% margin until 1997 but fell from then on to 57% in 2004. Out-of-pocket payments fell from 24% in 1965 to 7.4% in 2004.
Figure 5: Public and private financing in the health care sectors
public/ private financing of inpatient care
0 20 40 60 80 100
1960 1965
1970 1975
1980 1985
1990 1995
2000
public/private financing of outpatient care
0 20 40 60 80 100
1960 1965
1970 1975
1980 1985
1990 1995
2000
public/private financing of dental care
0 20 40 60 80 100
1960 1965 1970 1975 1980 1985
1990 1995
2000
public/private financing of pharmaceuticals
0 20 40 60 80 100
1960 1965 1970 1975 1980 1985
1990 1995
2000
Source: Centers for Medicare & Medicaid Services (CMS 2006): Health Accounts35
Inpatient care is the costliest of all health care sectors, consuming a large part of the financial resources. Bearing in mind that the public share in total health expenditure was 45% in 2004 (OECD Health Data 2006), we can clearly identify a disproportionate share of public financing allocated to the inpatient sector. In addition, the inpatient sec- tor is the only one in which public expenditure exceeds private financing today. Thus the state assumed (and has always had), the strongest role in that sector.
The growth rate of public financing was even more dramatic in the outpatient sector.
From 1965 to 1975 public expenditure had expanded from 6% to 25% of outpatient spending, followed by a more or less constant increase throughout the 1980s and 1990s, amounting to 31% in 2004. Out-of-pocket payments fell from 68% to about 18% in 1995 within a span of thirty years and have continued to decline slightly until today.
Compared to all other sectors, public expenditure is lowest in dental health care. This is most plausible as routine dental care procedures are not covered under Medicare, nor are dental care services in general included in the basic Medicaid package. The public
35 Please note that tax exemptions, which effectively are public expenditures, also are included in private financing in the CMS data sets.
in %
total private
private insurance out-of-pocket
total public
in %
total private
out-of-pocket
private insurance
total public total private
out-of-pocket private insurance
total public in %
total private total public in %
private insurance
out-of-pocket
share nevertheless rose from 1.2% in 1965 to 6 % in 2004. At the same time there was a considerable increase in private insurance financing, particularly between the mid-1970s and the mid-1990s. Again, we find a remarkable decline in out-of-pocket payments, which can largely be explained by the penetration of managed care plans into the mar- ket. In contrast to traditional private indemnity insurance, managed care health plans regularly include dental care procedures in their benefit packages. Out-of-pocket expen- diture dropped steeply from 97% in 1965 to 44% in 2004.
The pharmaceutical sector was least affected by the introduction of Medicare and Medicaid, as no outpatient drug coverage was included in Medicare, for example, when the program was established. In the Medicaid program, prescription drugs are an op- tional benefit. Nevertheless, public drug expenditures rose steadily over the period un- der investigation. They grew from a low 2.4% in 1965 to 15% in 1995 and reached al- most 24% in 2004. We see, therefore, that the pharmaceutical sector was influenced less by the introduction of the public programs than by their expansion over time, especially over the last decade. Private insurance financing steeply increased, especially beginning from the 1990s, and amounted to about 41% in 2004, while out-of-pocket financing fell from over 95% in 1965 to 35% in 2004. Depending on the further development of the new Medicare drug benefit (see MMA in section 1.2), Medicare funding is expected to increase and individuals’ out-of-pocket and Medicaid spending to decline in the coming years (Kaiser Foundation 2006, Heffler/Smith/Keehan et al. 2005).
3.4 The changing role of the state in financing
To sum up this analysis for the financing dimension, there is a strong increase in public involvement in the US health care system from the beginning of the observation period in 1965 onwards. This flow of public funds into the system is largely due to the public Medicare and Medicare programs, but also a result of constantly rising tax exemptions to the benefit of private, employer-sponsored health insurance. Therefore, it is no longer appropriate to label the American health care system a private system with respect to financing but rather a “mixed system” (Marmor 2006, Oberlander 2002). This finding implies a considerable blurring of the financing system, especially as with the social insurance contributions an almost completely new element of health care financing en- tered the American health care system.
Private insurance financing also increased which means that collective financing through both public and private insurance led to a considerable decline in out-of-pocket payments in all health care sectors. This development was supported by the diffusion of managed care arrangements seeking competitive advantages (Gabel/Ginsburg/Picker- eign et al. 2001). With HMOs and their followers penetrating the private market, benefit packages became more comprehensive and cost sharing declined. Thus, taking devel- opments from the mid-1960s on into consideration, a “privatization of risks” (Hacker
2004) in purely quantitative terms is not observed for the financing of the American health care system.
But these quantitative data do not reflect the fact that insurance protection leaves se- vere gaps in coverage. In addition, as mentioned before, the solidarity-aspect of private health insurance financing needs to be questioned. What is more, due to high total health care spending in the US, even low out-of-pocket payment rates equal relatively high absolute amounts. All these aspects, however, are dealt with in the regulation di- mension, especially in the regulation of coverage and the financing system in sections 5.1 and 5.2. This brings us back to the necessity to explore all three dimensions simul- taneously, i.e. the financing, the service provision and the regulation of the health care system.
4. T
HE SERVICE PROVISION DIMENSIONService provision is the second dimension which is measured quantitatively. Yet there is no straight way to quantify the role of the state in the delivery of services over all sec- tors (Rothgang/Cacace/Schmid 2006). Therefore we first measure the size and the pub- lic/private mix in each sector, i.e. in the hospital sector, the nursing home sector, the outpatient sector, the dental health care sector, and the pharmaceutical sector (section 4.1). The most appropriate measurement approach, which allows for comparison among the sectors at the same time, is to use monetary terms. Monetary data indicate the flow of funds into the health care sectors thereby explaining the changing size of the respec- tive sector over time. In a second step, data on the public and private responsibility in each sector are used to describe the changing the public/private mix (section 4.2). In order to combine data on the size of the sectors with the information on its pub- lic/private mix, an indicator (Public Service Provision Index = PPI) is provided in the concluding section (section 4.3).
4.1 The size of the health care sectors
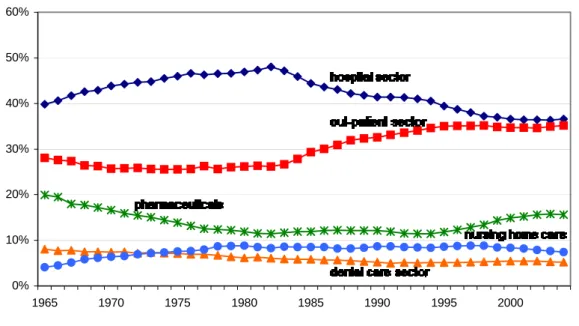
During the whole study period, most monetary resources are absorbed by the hospital sector (CMS 2006). From 1965 up to a turning point the percentage of total health ex- penditures allocated to the hospital sector rapidly increased from about 40% in 1965 to 48% in 1982. This turning point is clearly marked by the introduction of the DRG-based payment system for hospital care. The share subsequently decreased as quickly as it rose, eventually arriving at 37% of monetary resources in 2004 (see figure 6). Corre- spondingly, the monetary resources allocated to the outpatient sector remained constant at a few percentage points below the 30% margin and increased from the early 1980s on.
Figure 6: Percentages of monetary resource flows in all sectors36
Source: CMS 2006, own calculation
The nursing home sectors’ relevance increased during the study period, fostered by demographic changes. Between 1965 and 1980 the percentage of monetary resources devoted to that sector doubled from 4% to 9%. From 1998 on, the point in time when DRGs were introduced also for the nursing home sector (cf. CMS 2003c) the share de- creased to 7% in 2004. Monetary resources allocated to the dental care sector remained stable at 7%–8% of total until the late-1970s and then started to decline, eventually reaching 5% in 2004. The percentage of resources allocated to the pharmaceutical sector sharply declined from 21% in 1965 to about 12% in the mid-1990s. From 1995 to 2004, however, the percentage of monetary resources spent on pharmaceuticals rose again rapidly to 16%. Due to price increases and higher consumption levels, prescription drugs have represented a rapidly growing cost component in service delivery (Doc- teur/Suppanz/Woo 2003).
The introduction of the DRG-based prospective payment system (PPS) in Medicare had a major impact on the two largest sectors in terms of resource flows, i.e. the hospital and the outpatient sector. In the hospital sector, rates were forced down and procedures that have been performed on an inpatient basis have been moved to outpatient settings.
At the time of their introduction DRGs uniquely applied to Medicare patients but as Medicare is almost a “monopsony buyer” (Ruggie 1992: 932) of inpatient care, the bulk of the hospital care procedures fell under the PPS. Medicaid and private insurers fol- lowed the Medicare example and introduced DRGs in the 1990s (Raffel/Raffel 1997, Getzen 2004). The spread of managed care, too, gave rise to a shift from inpatient
36 This calculation follows an institutional classification of monetary resources.
0%
10%
20%
30%
40%
50%
60%
1965 1970 1975 1980 1985 1990 1995 2000