P olicy R eseaRch W oRking P aPeR 4736
Making Regional Cooperation Work for South Asia’s Poor
Sadiq Ahmed Ejaz Ghani
The World Bank South Asia Region
South Asia Regional Programs Unit September 2008
WPS4736
Public Disclosure AuthorizedPublic Disclosure AuthorizedPublic Disclosure AuthorizedPublic Disclosure Authorized
Abstract
The Policy Research Working Paper Series disseminates the findings of work in progress to encourage the exchange of ideas about development issues. An objective of the series is to get the findings out quickly, even if the presentations are less than fully polished. The papers carry the names of the authors and should be cited accordingly. The findings, interpretations, and conclusions expressed in this paper are entirely those of the authors. They do not necessarily represent the views of the International Bank for Reconstruction and Development/World Bank and its affiliated organizations, or those of the Executive Directors of the World Bank or the governments they represent.
Policy ReseaRch WoRking PaPeR 4736
South Asia has attracted global attention because it has experienced rapid GDP growth over the last two decades.
What is not so well known is that South Asia is the least integrated region in the world. South Asia has opened its door to the rest of the world but it remains closed to its neighbors. Poor market integration, weak connectivity, and a history of friction and conflict have resulted in two South Asias. The first South Asia is dynamic, growing rapidly, highly urbanized, and is benefiting from global integration. The second South Asia is rural, land locked, full of poverty, and lagging. The divergence between the
This paper—a product of the South Asia Regional Programs Unit, South Asia Region—is part of a larger effort in the Region to promote dialogue and debate on the importance of regional cooperation for growth and poverty reduction in South Asia. Policy Research Working Papers are also posted on the Web at http://econ.worldbank.org. The authors may be contacted at Sahmed2@worldbank.org, and/or Eghani@worldbank.org
two South Asias is on the rise. Policy makers in South Asia have realized that countries and regions can not grow in isolation. The unique geography of South Asia—
distance and density—has the potential to raise growth through increased flow of labor, capital, ideas, technology, goods and services within the region and with the rest of the world. Most lagging regions, in terms of both per capita income and poverty incidence, in South Asia are either land-locked or located in the border areas.
Regional cooperation and market integration will unlock the development of these lagging regions in South Asia.
Making Regional Cooperation Work for South Asia’s Poor
Sadiq Ahmed
1Ejaz Ghani
I. Introduction
South Asia continues to grow rapidly and its largest economy, India, approached near double-digit growth in 2006-07. This is a remarkable transformation of a region where countries have been infamously dubbed as a “basket case”. Well up to the late 1970s South Asia, which includes eight countries—Afghanistan, Bangladesh, Bhutan, India, Maldives, Nepal, Pakistan and Sri Lanka—was known for conflict, violence and widespread and extreme poverty. In the initial years after independence, the South Asian countries adopted import substitution growth strategies with heavy trade protection, curbed the growth of private firms, and introduced restrictive labor laws to protect workers. After some 30 years, the outcome of these policies turned out to be very different from what the leadership had in mind. South Asia delivered sluggish growth, continued dependence on low-productivity agriculture, low levels of industrialization, weak export performance and inadequate creation of good jobs. Between 1960 and 1980 South Asia grew at only 3.7 percent per year. Much of the labor force was engaged in low-income activities in agriculture and informal services and some 45 percent of the population lived below the poverty line.
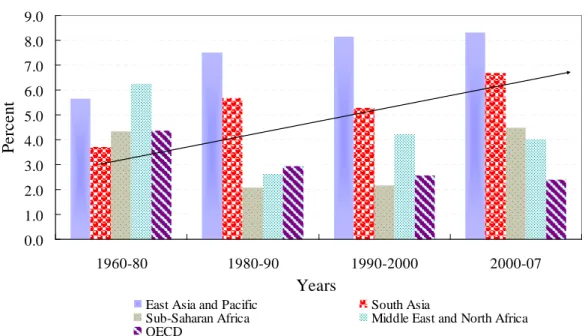
South Asia’s prospects changed in the 1980s as it adopted pro-growth policies. It opened up markets to international competition, replaced the public sector with the private sector as the engine of growth, and improved macroeconomic management (Ahmed 2006). The results were impressive. South Asia’s annual GDP growth rate climbed to around 5.7 percent during 1980-2000, which further accelerated to 6.5 percent during 2000-2007. It is now the second fastest growing region in the world, after East Asia. Growth rates in South Asia and East Asia appear to be converging (see figure 1). In 2007, India experienced a remarkable GDP growth of 9 percent, close to that of China.
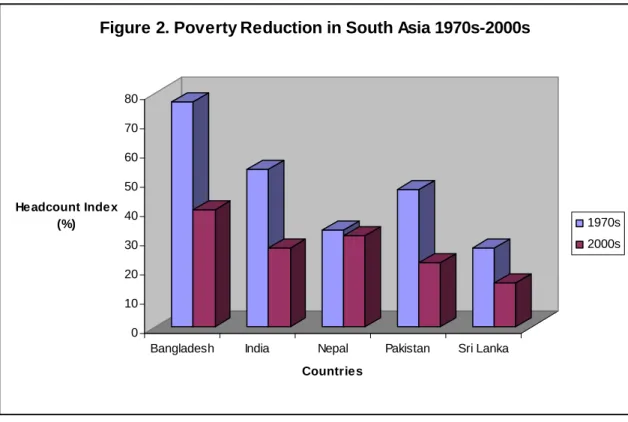
Other South Asian countries like Bangladesh, Pakistan and Sri Lanka experienced a growth rate of 6.5 percent. Private investment has boomed, supported by rising national saving rates in South Asia. It now attracts global attention because of rapid growth, global outsourcing, and skill intensive service exports. Rapid growth has been instrumental in reducing poverty in South Asia. Poverty has come down sharply in all countries (figure 2). Progress has also been made in improving human development and the social indicators compare favorably with countries in other regions with similar income levels (Ahmed 2006).
1 The authors are with the World Bank in Washington D.C. Parts of the analysis of this paper draw from an earlier paper (Ahmed and Ghani 2008). The views expressed in this paper are those of the authors and do not necessarily reflect the views of the World Bank Group. Research assistance from Veronica Milagros Minaya is gratefully acknowledged. Errors are the sole responsibility of the authors.
While there is much to celebrate, two negative developments have emerged: first, there is evidence of growing income inequality in South Asia; and second, there is growing imbalance between regions within countries and among the countries themselves. With fairly large and open borders, the growing imbalances in incomes and opportunities among South Asian countries present similar social and economic problems to the prosperous neighbors as imbalances within.
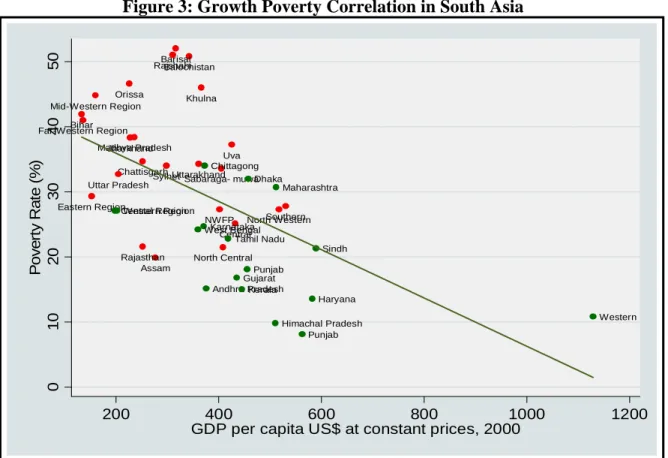
Poverty, income growth and lagging regions are inter-related. South Asia’s experience shows that the incidence of poverty and income growth is strongly and negatively correlated (Figure 3). With few exceptions lagging regions exhibit a higher than average rate of poverty and lower than average per capita incomes. The growing divergence between lagging and leading regions also suggests that lagging regions on average are growing more slowly than leading regions.
Figure 1. Real GDP Growth
0.0 1.0 2.0 3.0 4.0 5.0 6.0 7.0 8.0 9.0
1960-80 1980-90 1990-2000 2000-07
Years
Percent
East Asia and Pacific South Asia
Sub-Saharan Africa Middle East and North Africa OECD
Source: World Bank's World Development Indicators.
Notes: Data are averages.
South Asia’s data include the 2007 growth rate, while the rest of the regions do not.
So, a substantial part of the poverty and lagging regions challenges is a growth challenge. Two major development issues facing South Asia are: first, how can South Asia grow even faster than in the recent past? And second, how can lagging regions accelerate growth to catch up with growth in the leading regions?
The problem of inequality is, however, a more complex challenge. Growth
acceleration in the lagging regions might help reduce inequality. But this is only a part of
the larger task of making growth more inclusive. The pattern of growth that benefits
0 10 20 30 40 50 60 70 80
Headcount Index (%)
Bangladesh India Nepal Pakistan Sri Lanka Countries
Figure 2. Poverty Reduction in South Asia 1970s-2000s
1970s 2000s
Source: World Bank Regional Database.
Notes: 1) Poverty estimates use national poverty lines. The respective dates are: Bangladesh (1975 and 2005); India (1974 and 2005); Nepal (1977 and 2004); Pakistan (1970 and 2005); and Sri Lanka (1976 and 2005).
income growth for the poor, higher employment elasticity of growth, and strengthened public service delivery including better social protection policies all need to be core elements of a strategy to lower income inequality.
II. Growth Acceleration, Lagging Regions 2and Inequality: A Framework
The experience of East Asia shows that growth that is supported by factor accumulation as well as productivity improvements can lead to higher growth.
3South Asia’s experience is similarly positive (Ahmed 2006). Additionally, it has two key assets, demography and geography, which have not yet been fully utilized. It has a young labor force. More workers will join the labor force over the coming decades. Though the small size of the manufacturing sector has prevented the region from converting the demographic dividend into a window of opportunity, the large and potentially competitive labor force could be the catalyst that could attract regional and global production centers to be located in South Asia, as firms move in response to wage differences, and globalization benefits low-income countries. South Asia’s geography also has the potential to
2 A lagging region is defined as a poor region that does not grow as fast as the others, and its per capita income is low compared to national average.
3 See Gill and H. Kharas, 2007
Figure 3: Growth Poverty Correlation in South Asia
Source: Staff estimates using data in figures 4 and 5
Southern Sabaraga- muwa
Central Uva
North Western
North Central NWFP Balochistan
Eastern Region Far-Western Region
Mid-Western Region
Assam Bihar
Chattisgarh Jharkhand Madhya Pradesh
Orissa
Rajasthan Uttar Pradesh
Uttarakhand Barisal
Khulna Rajshahi
Sylhet
Western Punjab
Sindh Central RegionWestern Region
Andhra Pradesh Gujarat
Haryana Himachal Pradesh Karnataka
Kerala
Maharashtra
Punjab Tamil Nadu
West Bengal Chittagong
Dhaka
01020304050Poverty Rate (%)
200 400 600 800 1000 1200
GDP per capita US$ at constant prices, 2000
accelerate growth. It has the highest population density in the world, and the second largest proportion of population living in the border areas after Europe. High population density and better access to markets can benefit growth by allowing South Asian firms to take advantage of agglomeration economies.
Despite this benefit of geography—density and distance—South Asia’s true
growth potential has not been realized due to the lack of market integration within
countries and across countries. South Asia accounts for only 3 percent of the world
surface area, but it sustains a “whopping” 20 percent of the world population, nearly 1.5
billion people. It has the highest population density in the world, yet it has one of the
lowest urbanization rates. There are indeed large differences across countries in South
Asia. In 2005, India (which accounts for 74% of the regional population) produced close
to 80% of the South Asian GDP. Pakistan (13 % of South Asian population), Bangladesh
(10%), Sri Lanka (1%) and Nepal (2%) accounted for 11%, 6%, 2.3% and 0.7%, of the
regional GDP, respectively. Bhutan, Maldives and Afghanistan collectively accounted for
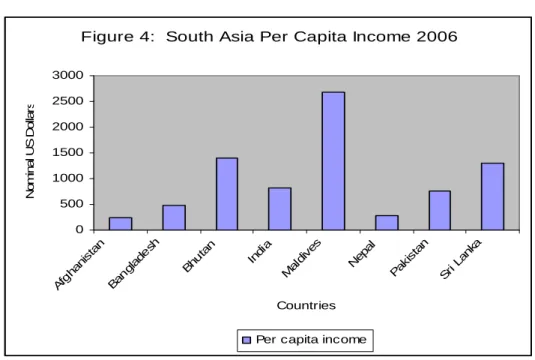
less than 1% of South Asia GDP. The differences in per capita income are large, ranging
from a high of $2700 for Maldives (for the year 2006 measured in current US dollars) to
a low of only $250 for Afghanistan (figure 4). Even if one were to exclude the small
economies of Maldives and Bhutan, the per capita income gaps are pretty large.
Figure 4: South Asia Per Capita Income 2006
0 500 1000 1500 2000 2500 3000
Afghani stan
Banglade sh
Bhu tan
Indi a
Maldives
Nepal Paki
stan Sri Lank
a
Countries
Nominal US Dollars
Per capita income
Source: World Bank 2007.
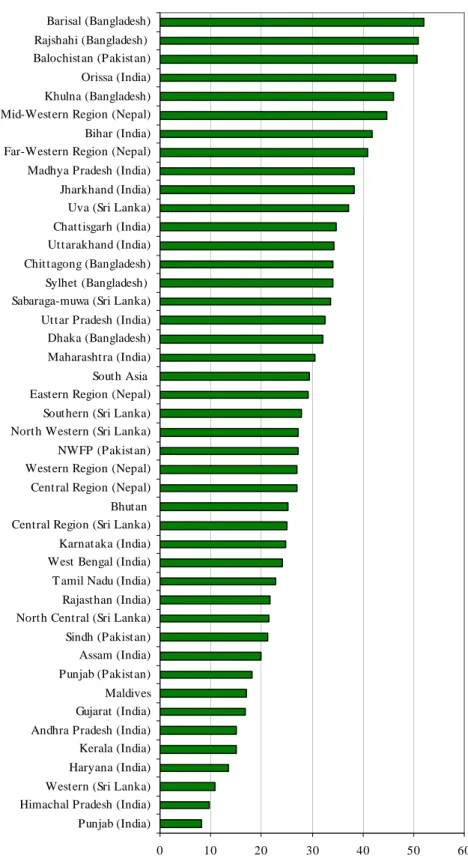
The income gap at the national level carries through at the sub-national level (figure 5). During the period 1993-2004, GDP growth in the leading states in India grew at twice the rate compared to the lagging states. The average annual growth rate for the leading states (A.P., Gujarat, Haryana, Karnataka, Kerala, Maharashtra, Punjab, Tamil Nadu, and West Bengal) was 5.9 percent. The average growth rate for the lagging states (Bihar, M.P., Orissa, Rajasthan, and UP) was 3.0 percent per annum. In Sri Lanka, the leading regions grew at an annual average rate of 6.5 percent during the period 1996- 2005, while the lagging regions (Sabaragamua, Central, Uva, and North Western) grew at an average rate of 1.5 percent per annum. In Pakistan, the difference in the growth rates between the leading and lagging regions is less striking. The leading regions of Punjab and Sindh experienced an average annual growth rate of 2.3 percent during the period 1991-2000, while the lagging regions of Baluchistan and NWFP grew at an average annual rate of 1.8 percent. In Bangladesh, the leading regions (Dhaka and Chittagong) grew at an annual average rate of 3.15 percent annum while the lagging regions (Barisal, Rajshahi, Khulna, Sylhet) grew at an average annual rate of 2.73 percent during the period 1990-1999. Nepal’s growth since 2000 has averaged a paltry 3%, around half of the South Asian regional average. Conflict, poor road connectivity, and urban bias associated with earlier growth spurts have resulted in a clear divide between lagging regions and the Kathmandu valley.
The above picture suggests that despite the differences in economic size and
population, South Asian countries face similar development challenges arising from large
spatial disparities. South Asia’s leading regions are leaving lagging regions behind, as
exemplified by the phrase “two South Asias”. The leading regions are characterized by
rapid GDP growth, urbanization and integration with the global economy. The lagging
regions remain rural, rely on low value activities, and are not well integrated with the
national, regional, and global markets.
Figure 5: Per Capita Income in South Asia (2004 Constant US$)
0 500 1,000 1,500 2,000 2,500 3,000 3,500 Bihar (India)
Far-Western Reg. (Nepal) Afghanistan Eastern Region (Nepal) Uttar Pradesh (India) Mid-Western Region Madhya Pradesh (India) Central Region (Nepal) Sylhet (Bangladesh) Western Region (Nepal) Rajshahi (Bangladesh) Barisal (Bangladesh) Orissa (India) Rajasthan (India) Assam (India) Jharkhand (India) Chattisgarh (India) Khulna (Bangladesh) Manipur (India) Balochistan (Pakistan) Chittagong (Bangladesh) J&K (India) Northern (Sri Lanka) Nagaland (India) NWFP (Pakistan) North Central (Sri Lanka) Meghalaya (India) Uttarakhand (India) Mizoram (India) West Bengal (India) Arunachal Pr. (India) Eastern Region (Sri Lanka) T ripura (India) Dhaka (Bangladesh) South Asia Sabaraga-muwa (Sri Lanka) Andhra Pradesh (India) Sikkim (India) Karnataka (India) Uva (Sri Lanka) Central Region (Sri Lanka) Southern (Sri Lanka) North Western (Sri Lanka) Punjab (Pakistan) T amil Nadu (India) Kerala (India) Gujarat (India) A & N Islands (India) Himachal Pradesh (India) Maharashtra (India) Punjab (India) Sindh (Pakistan) Haryana (India) Bhutan Pondicherry (India) Delhi (India) Western (Sri Lanka) Goa (India) Chandigarh (India) Maldives
Source: India -Directorate of Economics & Statistics of respective State Government; Sri Lanka- Central Bank of Sri Lanka; Bangladesh- Statistical Yearbook of Bangladesh ; Nepal (household income per capita)- CBS and World Bank staff calculations using NLSS I and II; Pakistan –World Bank Staff; Bhutan, Afghanistan and Maldives-World Development Indicators.
The development experience of South Asia, where rapid GDP growth has been accompanied by high regional disparities, contrasts with the regional experience of high income market economies. There is evidence for strong convergence among regions in US, Japan, and European Union
4,5. The income gap between the leading and lagging regions in South Asia is much larger compared to the spatial disparities in developed countries. In India, GDP per head in the state where it is highest (Haryana) is 5 times greater than in the state where it is lowest (Bihar). In the USA, the difference is only 2.5 times, and in Japan only two times. Regional disparities are indeed expected to change over time with the level of development. The big issue is whether future developments in South Asia will bring about convergence or divergence between the leading and lagging regions.
Given the strong negative relationship between income and poverty illustrated in figure 3 above, it is hardly surprising that with few exceptions, most lagging regions also show higher than average rates of poverty (figure 6). Nearly half a billion people live in the lagging regions of South Asia. Nearly 60 percent of the poor in India live in the lagging states. Every seventh poor Indian lives in Bihar, a lagging state. Sri Lanka shows disturbing regional disparity in poverty rates between the Western region (a leading region) and the rest of the country. Nepal’s Western region (lagging region) has a substantially higher poverty incidence than the more prosperous Kathmandu valley. In Pakistan, inter-provincial disparities in poverty incidence between the leading regions (Sindh and Punjab) and the lagging regions (NWFP and Balochistan) are huge.
Why some areas develop and others remain underdeveloped is determined by three key drivers: movement of productive factors, transportation costs, and scale economies. This is derived from spatial economics–the study of where economic activity takes place and why (see Fujita, Krugman and Veneables 1999; World Bank 2008d).
Drawing on these works, an ongoing World Bank study is looking at the interactions between geography, institutions and trade, and how they promote or constrain growth in the lagging regions of South Asia
.. Geographic, institutional, and trade differences are larger in South Asia compared to Japan, Europe and USA. In Japan, nearly 97 percent of people live within 100 kms of the coast. In Europe, more than half the population lives within 100 km of the coast or an ocean navigable waterway. USA is more like India with a large proportion of the land area away from coast. But because of high labor mobility and an efficient agriculture in USA, a high proportion of the population lives close to the coast. In India, factor mobility has not been able to arbitrage geographical disparities.
Disparities between the leading and lagging regions are high not because of geography but because of poor market integration due to high transportation costs; poor connectivity between regions and countries; low factor mobility; and regulatory restrictions that prevent firms from taking advantage of the scale economies.
4 See Barro and Sala-I-Martin, 1995, chapter 11.
5 See European Union 2007, which provides evidence on convergence occurring both at the national and regional levels within European Union
Figure 6: Poverty Incidence in South Asia (headcount %)
0 10 20 30 40 50 60
Punjab (India) Himachal Pradesh (India) Western (Sri Lanka) Haryana (India) Kerala (India) Andhra Pradesh (India) Gujarat (India) Maldives Punjab (Pakistan) Assam (India) Sindh (Pakistan) North Central (Sri Lanka) Rajasthan (India) T amil Nadu (India) West Bengal (India) Karnataka (India) Central Region (Sri Lanka) Bhutan Central Region (Nepal) Western Region (Nepal) NWFP (Pakistan) North Western (Sri Lanka) Southern (Sri Lanka) Eastern Region (Nepal) South Asia Maharashtra (India) Dhaka (Bangladesh) Uttar Pradesh (India) Sabaraga-muwa (Sri Lanka) Sylhet (Bangladesh) Chittagong (Bangladesh) Uttarakhand (India) Chattisgarh (India) Uva (Sri Lanka) Jharkhand (India) Madhya Pradesh (India) Far-Western Region (Nepal) Bihar (India) Mid-Western Region (Nepal) Khulna (Bangladesh) Orissa (India) Balochistan (Pakistan) Rajshahi (Bangladesh) Barisal (Bangladesh)
Source: Pakistan - World Bank Staff; Sri Lanka - HIES 2002; Nepal - NLLS 2003-04; Bangladesh- HIES 2005; Bhutan- IMF;
Maldives-ADB.
Note: For India, data for poverty headcount rate based on 2004/2005; For Sri Lanka data for poverty are based on 2002; Pakistan- 2005/2006; Bangladesh-2005; Nepal - 2003/2004; Bhutan-2000; Maldives-2004.
There are two types of geography—first and second nature geography. First nature geography favors some regions by virtue of endowments of proximity to rivers, coasts, ports, and borders. Economic activity may concentrate in coastal urban areas because of proximity to the domestic and external markets, and better logistical link between foreign suppliers and customers, than can interior based industry. First level geography explains why some leading regions are located in coastal areas (Maharashtra, Gujarat, and Tamil Nadu in India; and Karachi in Pakistan). Real GDP per capita growth rates for the coastal states in India grew at 4.5 percent per annum during the 1990s compared to 2.5 percent for the land locked states. Second nature geography is determined by human made infrastructure. Physical infrastructure influences the interactions between economic agents. Improved infrastructure lowers transportation costs, encourages mobility of labor, goods, capital, and ideas, and increases the size of the market. These interactions give rise to scale economies. As agricultural productivity increases, it releases labor and capital from rural areas, which migrate to urban areas, to take advantage of agglomeration forces. Regions with a higher urbanization rate tend to have higher productivity. These forces can generate virtuous circles of self-reinforcing development. Empirical studies identify the second nature geography--physical infrastructure--as a key causal factor in explaining level and trend in regional disparities (see Kanbur and Veneables 2005a). Clearly, South Asia is yet to take advantage of the growth benefits of its demography and geography.
In addition to the lagging regions problem, South Asia also exhibits growing income inequality. Figure 7 shows economic inequality as measured by the Gini coefficient.
6Inequality in South Asia is rising but less than in East Asia.
7This is apparent when comparing the growing inequality between the rich and the poor in India compared to China. Nepal and Sri Lanka have the highest levels of inequality in South Asia. They also have the highest growth in inequality. Pakistan and rural India have the lowest levels of inequality. Is inequality between regions, i.e. spatial inequality, also rising?
increases as an economy shifts from agriculture to manufacturing. There are some signs
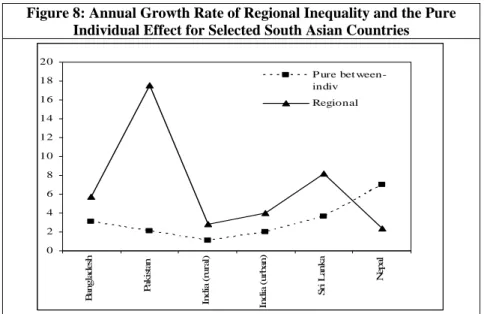
For most countries, growth in inequality across leading and lagging regions is rising faster than growth in inequality across individuals. Figure 8 reports regional inequality at the sub-national level using the Theil inequality measure.
8The figure shows that regional inequality is rising at a much faster pace than pure inequality in all countries except for Nepal and, to some extent, India. Regional inequality generally
6 We are grateful to Nobuo for this work.
7 Based on their survey of evidence of over 50 developing nations, Kanbur and Venables (2005a, 2005b) argue that the uneven spatial impact of trade and globalization played a major role in the increase in regional and urban spatial inequalities in developing countries in recent years. Moreover, they argue that, in addition to geographic remoteness, the backward regions and rural areas suffered from an inequitable distribution of infrastructure, public services and policies that constrained the free migration of peoples from backward places.
8 The Theil inequality measure has a convenient property: it can be decomposed into inequality across areas, or “regional inequality”, and inequality between individuals, after controlling for the former, or
“pure between-individual inequality”.
Figure 7: Gini Coefficient (the latest available) and the Annual Growth Rate of Gini (%)
0 5 10 15 20 25 30 35 40 45 50
ladesh a(Rural) Urban) Nepal kistan i Lanka (Rural) Urban) Indonesia etnam
Bang Indi India( Pa Sr China China( Vi
South As ia East As ia
Gini Coefficient (%)
0 0.5 1 1.5 2 2.5 3
Annual growth rate of Gini (%)
Gini Growth
Source: World Bank staff estimation using household income and expenditure surveys of each country.
Note: Source data for Bangladesh - HIES 1991-92 and 2005; Pakistan - PIHS 1998- 99 and PSLM 2005-06; India - NSSO 50th and 55th rounds; Sri Lanka - HIES 1990- 91 and 2002; Nepal - NLLS 1996-97 and 2003-04. Data for all East Asian countries are in the World Bank’s data department; and survey years are 1993-2004 for China;
1999-2004 for Indonesia; 1992-2004 for Vietnam.
Figure 8: Annual Growth Rate of Regional Inequality and the Pure Individual Effect for Selected South Asian Countries
0 2 4 6 8 10 12 14 16 18 20
esh an ral) an) nka pal
P ure bet ween- indiv Regional
Banglad Pakist India (ru India (urb Sri La Ne
Source: World Bank staff estimates using household income and expenditure surveys of each country.
of regional convergence in Nepal and India, as the extremely poor areas in Nepal and India have achieved faster growth rates in consumption. Poorer parts of Nepal and India have benefited from remittance flows as workers have moved to areas of higher economic density either at home or abroad.
Can South Asia achieve both high and inclusive growth? Good examples of factors that can contribute to high and inclusive growth are labor mobility, better job creation, skills and education, and resolution of internal conflict. Inclusive growth is not about balanced growth but shared opportunities. Spatial disparities in growth are inevitable when growth accelerates and countries make the transition from being an agricultural to an industrialized economy. The challenge for public policy is to identify the growth constraints in the lagging regions and remove them.
The strongest indicator of inclusive growth is poverty reduction. As mentioned earlier, all South Asian countries have reduced poverty. Going forward, however, poverty reduction is likely to be complicated by the fact that growth is increasingly concentrated in the leading regions, while poverty is concentrated in the lagging regions. The large concentration of poor in the lagging regions suggests public policy must concentrate in raising growth and improving human development in these lagging regions. The evidence that regional inequality is rising also suggests that higher income growth in lagging regions might help reduce income inequality.
III. Cross-Border Constraints to Growth and Poverty Reduction
The lagging regions challenge requires recognition of another factor of geography that has been largely neglected in public policy debates: much of the South Asia’s lagging regions are either land-locked countries (Afghanistan and Nepal) or are border districts/states/provinces of the three larger countries of Bangladesh, India and Pakistan.
This is obvious from Figure 5, Map 1 and Table 1 that show the following results.
•
The landlocked countries of both Afghanistan and Nepal are among the lowest per capita income group in the region (Figure 5).
•
Out of 14 states of India that have borders with neighbors, 12 have per capita income levels that are at or below the national average (Arunachal Pradesh, Assam, Meghalaya, Mizoram, Nagaland, Tripura, Manipur, West Bengal, Bihar, Uttar Pradesh, Jammu and Kashmir, and Rajasthan). The only exceptions are Punjab and Gujarat (Figure 5 and Map1).
•
In Pakistan, per capita income is lower than average in the border provinces of North-West Frontier, Balochistan, and rural Sindh. As in the case of India, Pakistan’s Punjab is an exception. Similarly, urban Sindh is richer than the national average because of the dominance of the port city of Karachi (Figure 5 and Map1).
•
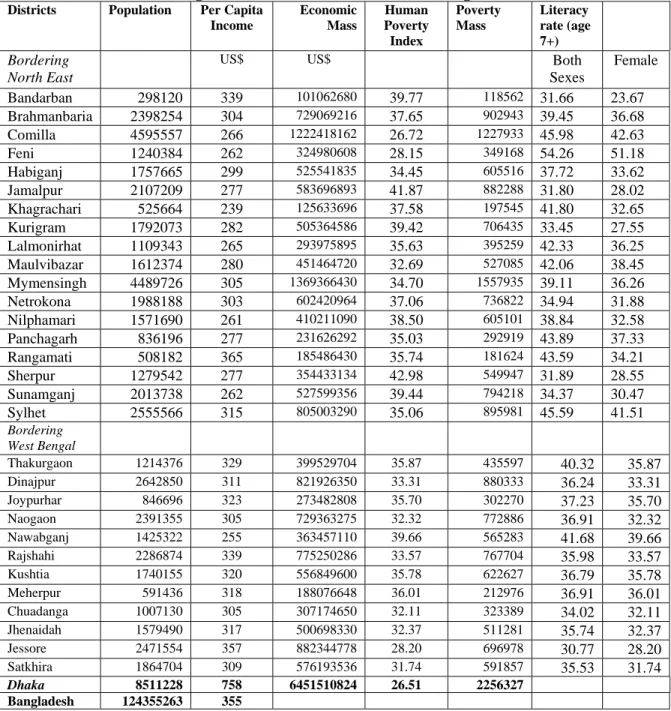
In Bangladesh, the border districts tend to have lower than average per capita
income than the national average (Table 1).
Source: Figure 5.
Notes: 1) Leading/lagging regions are defined at the national level based on per capita incomes above or below the national average. 2) Afghanistan, Bhutan and Maldives show national averages as sub-national data are not available.
•
Most lagging regions in income terms are also lagging in terms of having higher than average incidence of poverty and/or poorer human development indicators (Figure 6, Maps 2 and 3, and Table 1).
Table 1: Population Mass, Economic Mass and Poverty Mass: Bangladesh Districts Bordering India’s North East and West Bengal (2000)
Districts Population Per Capita Income
Economic Mass
Human Poverty Index
Poverty Mass
Literacy rate (age 7+) Bordering
North East
US$ US$ Both
Sexes
Female Bandarban 298120 339 101062680 39.77 118562 31.66 23.67 Brahmanbaria 2398254 304 729069216 37.65 902943 39.45 36.68 Comilla 4595557 266 1222418162 26.72 1227933 45.98 42.63
Feni 1240384 262 324980608 28.15 349168 54.26 51.18
Habiganj 1757665 299 525541835 34.45 605516 37.72 33.62 Jamalpur 2107209 277 583696893 41.87 882288 31.80 28.02 Khagrachari 525664 239 125633696 37.58 197545 41.80 32.65 Kurigram 1792073 282 505364586 39.42 706435 33.45 27.55 Lalmonirhat 1109343 265 293975895 35.63 395259 42.33 36.25 Maulvibazar 1612374 280 451464720 32.69 527085 42.06 38.45 Mymensingh 4489726 305 1369366430 34.70 1557935 39.11 36.26 Netrokona 1988188 303 602420964 37.06 736822 34.94 31.88 Nilphamari 1571690 261 410211090 38.50 605101 38.84 32.58 Panchagarh 836196 277 231626292 35.03 292919 43.89 37.33 Rangamati 508182 365 185486430 35.74 181624 43.59 34.21 Sherpur 1279542 277 354433134 42.98 549947 31.89 28.55 Sunamganj 2013738 262 527599356 39.44 794218 34.37 30.47 Sylhet 2555566 315 805003290 35.06 895981 45.59 41.51 Bordering
West Bengal
Thakurgaon 1214376 329 399529704 35.87 435597 40.32 35.87 Dinajpur 2642850 311 821926350 33.31 880333 36.24 33.31 Joypurhar 846696 323 273482808 35.70 302270 37.23 35.70 Naogaon 2391355 305 729363275 32.32 772886 36.91 32.32 Nawabganj 1425322 255 363457110 39.66 565283 41.68 39.66 Rajshahi 2286874 339 775250286 33.57 767704 35.98 33.57 Kushtia 1740155 320 556849600 35.78 622627 36.79 35.78 Meherpur 591436 318 188076648 36.01 212976 36.91 36.01 Chuadanga 1007130 305 307174650 32.11 323389 34.02 32.11 Jhenaidah 1579490 317 500698330 32.37 511281 35.74 32.37 Jessore 2471554 357 882344778 28.20 696978 30.77 28.20 Satkhira 1864704 309 576193536 31.74 591857 35.53 31.74
Dhaka 8511228 758 6451510824 26.51 2256327
Bangladesh 124355263 355
Note: Population data refer to 2001, per capita income data refer to 1999/2000, and human poverty index refers to 2000.
Source
:
Massum 2008Source: Figure 5.
Notes: Afghanistan, Bhutan, and Maldives show national poverty rates.
Source: Figure 5 and 6.
Notes: Afghanistan, Bhutan, Maldives show national poverty rates.
Detailed analysis of these lagging regions indicates the following socio-economic characteristics (Massum 2008; Government of India 2008; World Bank 2005a; World Bank 2005b; World Bank 2005c; World Bank 2006; World Bank 2007; World Bank 2008a).
•
These lagging land-locked/border countries/states/provinces/districts have an estimated 400 million people of which an estimated 200 million people are poor (reference year of 2005). This is about 50 percent of South Asia’s estimated total number of poor for the year 2005.
•
Much of the population is rural (90 percent) and most are engaged in low- productivity agriculture.
•
The human development indicators tend to be below the comparable national average and many indicators are lower than the average in South Asia.
•
Infrastructure is on average poorer than rest of the respective countries and poorer than the average for South Asia
•
The border regions on average tend to be more vulnerable to water shortages and flooding problems than other parts.
A review of history suggests that not all areas were lagging and poor for all the time. For example both Afghanistan and Nepal prospered in the 18
thand 19
thcenturies on the basis of free trade and commerce with neighbors including Central Asia, Middle East, Indian sub-continent and China. Over the years, conflict and border restrictions removed this key source growth. A more dramatic example is that of North-East India (the so-called 7 sisters). The partition of Indian sub-continent into Pakistan and India brought havoc to the economies of these seven sisters, especially the booming state of Assam, by cutting off its sea-access and sharply raising the transport distance with the rest of India (see Box 1). The Kashmir valley was a prosperous and peaceful tourist resort until conflict between Pakistan and India took its toll. The Federally Administered Territories of Pakistan (FATA) and the NWFP were similarly prosperous and peaceful trading outposts until regional and global conflicts converted many parts of these border areas into conflict prone, security risk regions with low per capita incomes, high incidence of poverty and low human indicators.
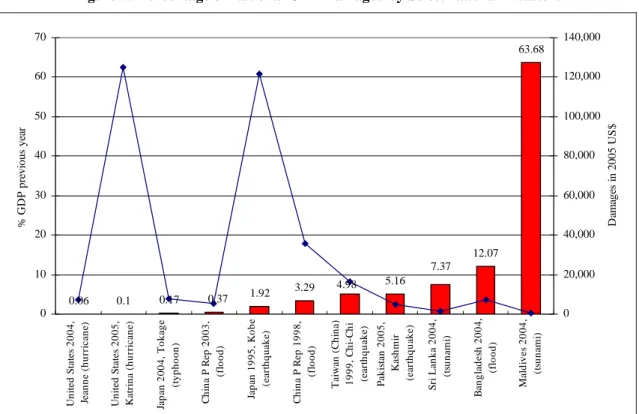
Apart from being poor, the lagging regions also share a number of common vulnerabilities. First and foremost is the vulnerability to natural disasters. Figure 9 shows the impact of natural disasters in terms of the share of GDP lost. South Asia has lost a significant amount of its GDP because of natural disasters. This loss has been especially significant for Maldives, Bangladesh, Sri Lanka and Pakistan. The impact of natural disaster is particularly strong in South Asia because of its high population density.
The losses are typically not insured in the financial market. It is the poor who are
adversely affected by disasters.
Box 1. Bangladesh and India: A Tale of Two Border Regions
India’s North East and West Bengal lag behind the rest of India in per capita gross state domestic product (GSDP). So do the Bangladesh districts adjoining West Bengal and India’s North East. India’s North East and Bangladesh districts bordering the above region and West Bengal have considerable similarity like being predominantly agricultural- agriculture accounting for the largest share of employment; narrow manufacturing base; and low levels of consumption of electricity which significantly constrain their growth prospects. The three hill districts of Bangladesh have large shares of tribal population, so do three states of India’s North East, and people of both these sub-regions have been practicing the same low productive agricultural technology featuring shifting cultivation called Jhum for generations. The two regions formed a single economic entity under the British rule, shared common infrastructure and developed close linkages which contributed to economic growth of both the regions. Partition of British India in 1947 into two separate states, India and Pakistan, and the two regions falling in two countries which did not maintain friendly relations, caused havoc to the economy of India’s North East, as sudden snapping of all economic linkages made its economy extremely vulnerable besides converting it into a virtually land locked region. The adjoining Bangladesh (then East Pakistan) districts also suffered by losing their traditional sources of supplies and markets for their products, but as they retained most of the common infrastructure including access to the sea, and thereby to the outside world, their situation was not as bad. Their growth performance, however, indicate that they performed relatively poorly compared to most other Bangladesh districts. So did Bangladesh districts bordering West Bengal. With the emergence of Bangladesh as an independent country in 1971, it was expected that the linkages earlier lost would be restored, but little progress has been made so far in this direction. It is, however, believed that improved economic linkages between India’s North East and West Bengal, and the adjoining Bangladesh districts, would promote development of all these regions.
Source: Massum (2008).
A second and related vulnerability is the access to water for irrigation and transport. An estimated 400 million people, many of whom are poor, directly or indirectly depend on the water flows of the three mighty rivers of Indus-Ganges-Brahmaputra for their livelihood. Frequent water shortages (and floods) create serious challenges to maintaining the income level of these large numbers of poor.
A third vulnerability is exposure to conflict and violence. It is not accidental that border regions are more prone to conflict and violence than other parts of South Asian countries. Indeed cross-border conflicts in South Asia are both a cause and effect of lack of cooperation. The poor suffer most the consequences of these conflicts. The peace dividends from resolving these conflicts through regional cooperation can be a huge boost for poverty reduction in South Asia.
IV. Regional Cooperation for Supporting Development of South Asia’s Lagging Regions
Cooperation can be a powerful way of raising growth, reducing the gap between leading and lagging regions, and reducing vulnerabilities for the poor. By focusing on the income of the poor both through the growth mechanism and by reducing vulnerability, regional cooperation can be helpful in lowering income inequality.
Specifically, in the context of the framework developed in Section III, it can be argued
that South Asia has the potential to accelerate growth and reduce poverty by exploiting four underutilized spatial features of the region: geography, transportation, factor mobility, and scale economies. Regional cooperation can facilitate this process.
Figure 9. Percentage of National GDP Damaged by Select Natural Disasters
0.06 0.1 0.17 1.92 3.29 5.16
12.07 63.68
0.37
4.98
7.37
0 10 20 30 40 50 60 70
United States 2004, Jeanne (hurricane) United States 2005, Katrina (hurricane) Japan 2004, Tokage (typhoon) China P Rep 2003, (flood) Japan 1995, Kobe (earthquake) China P Rep 1998, (flood) Taiwan (China) 1999, Chi-Chi (earthquake) Pakistan 2005, Kashmir (earthquake) Sri Lanka 2004, (tsunami) Bangladesh 2004, (flood) Maldives 2004, (tsunami)
% GDP previous year
0 20,000 40,000 60,000 80,000 100,000 120,000 140,000
Damages in 2005 US$
Source: http://www.unisdr.org/disaster-statistics/top50.htm
•
First, as mentioned earlier, South Asia is densely populated, with a significant proportion of the population living close to the borders between countries. After Europe, South Asia has the largest concentration of people living close to the border. It has the maximum “city pairs” within 50 km with a population of more than 25000 people
9. Almost all the South Asian countries share a common border with the largest regional partner (India). Regional integration initiatives will unlock the growth benefit of geography and support income convergence across regions and countries. Regional trade is more sensitive to transport costs, scale economies and factor mobility than global trade.
•
Second, South Asia suffers from high trade and transportation costs compared to other regions because of border restrictions and poor transport. The cost of trading across borders is nearly double for India and Bangladesh compared to China. It is more than three times higher for Afghanistan, Bhutan and Nepal. The quality of transport infrastructure, especially the highway networks, in South Asia is poor.
Truck operating speeds are low, delays at state/provincial check posts are frequent and can be long, and delivery times are consequently subject to significant
9 We are grateful to Souleymane Coulibaly for the data on city pairs.
variation. The regions away from the main trade corridors have the poorest infrastructure and face the greatest constraints. Raising the level of the infrastructure and reducing regulatory barriers to trade, whether international or national, will help integrate the lagging regions into both the national and global economies, reducing the relative advantages of the coastal states.
•
Third, factor mobility, and in particular migration rate, is low in South Asia. At the official level the restrictions on labor mobility between countries is huge.
Within countries, labor mobility is also limited. For example, only 2 million people migrate every year in India from rural to urban areas, compared to nearly 20 million people in China. Increased agricultural productivity will help to reallocate labor and capital from low value activities (agriculture) to high value activities (manufacturing and services sectors) and support growth.
•
Fourth, South Asian firms are disproportionately small. They are unable to reap the benefits of scale economies because of labor and regulatory restrictions which prevents them from growing. The policy changes aimed at taking advantage of the interactions between geography, transportation, factor mobility, and scale economies will lift growth not only in the lagging regions but also support higher growth rates at the country level and in South Asia.
In summary, regional cooperation will support higher growth, especially in the lagging regions, by reducing trade and transport barriers thereby promoting trade, facilitating factor mobility, reducing transport cost, and supporting agglomeration benefits. These ideas are developed in greater detail below.
A. Regional Cooperation for Supporting Growth in the Lagging Regions
In terms of policy focus, the two main ways by which regional cooperation can foster higher growth in South Asia and especially in the lagging regions is by promoting market integration and by improving infrastructure.
Market Integration: Market integration allows economic agents to interact across spatial scales: local, regional, and international. The extent to which economic agents take advantage of market integration is impacted positively by density, but negatively by both distance and division.
10A high level of economic density implies “thick markets” in the exchange of goods and services, as well as in the informal exchange of ideas. This creates productivity advantages for firms and welfare advantages for workers. By contrast, a high level of distance to density denies economic agents the opportunity to access these markets with consequent negative impacts on poverty and well-being.
1110 See Fujita, M., P. Krugman, and A. J. Veneables, 1999, The Spatial Economy: Cities, Regions, and International Trade, Cambridge, Mass: MIT Press.
11 Distance here is to be interpreted as an economic and social concept, rather than a purely physical concept. As such, a location which is physically close to a region of high density can, in principle, still be economically distant. This will be the case, for example, if the quality of spatially connective infrastructure linking the two areas is poor or there are economic, social and institutional barriers to commuting and the free flow of labor between the areas.
Likewise, divisions, created by conflict, transport costs and both formal and informal barriers to trade, separate economic agents in one country from the advantages of density in other countries. By reducing distance and division, market integration, both within and between countries, brings economic agents in lagging regions closer to the density of leading regions, promoting positive spillover effects which enhance spatial multipliers.
12Given that South Asia is the most densely populated region in the world, it is well placed to bring areas close to the market and bolster the value of the spatial multiplier. Market integration (global, regional, and within country) can ignite growth, as countries benefit from increased demand, agglomeration and scale economies, improved factor mobility, and the free flow of ideas and technology. Market integration can pull weak countries towards income levels that they would be unable to achieve in isolation. Land locked countries, in particular, (Afghanistan, Nepal) can benefit from cross-country growth spillovers and neighborhood effects. Neighboring countries can provide mutually beneficial economic linkages, spillovers, and complementarities that allow groups of countries to increase their incomes.
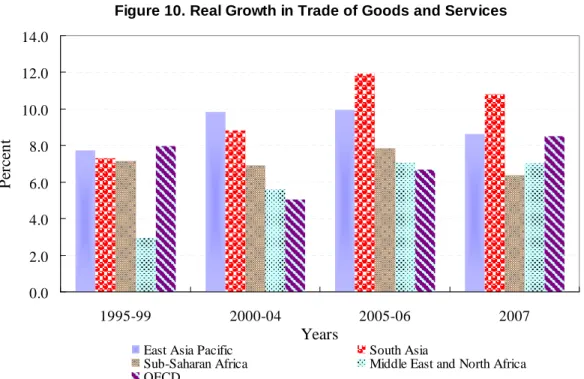
The region has significantly more room to benefit from market integration globally, across countries within South Asia, and within country. Globally, South Asia’s rapid GDP growth benefited from rapid expansion in trade. It has experienced one of the fastest growth rates in trade (figure 10) averaging 10.8 percent in 2007, following growth of almost 12 percent during 2005-06, which was the highest among all regions. Yet, the region has more room to benefit from trade. Despite recent reforms, South Asia continues to have the most restrictive tariff policies compared to other regions (figure 11). Among developing countries, South Asia has the most protective agricultural trade policies.
South Asia’s global integration, measured by trade as a ratio of GDP, was 49 percent in 2007, which although higher than its late 1990s ratio of 20 percent, is the lowest among developing countries.
13Within South Asia, market integration is the lowest in the world as reflected by intraregional trade between countries being less than 2 percent of GDP for South Asia compared to 40 percent for East Asia
.Border barriers to trade and services have mostly disappeared in the rest of the world but not in South Asia. Divisions across countries in South Asia have increased dramatically over the last four decades.
14In 1948, South Asia’s share of intra-regional trade as a share of total trade was 18 percent. In 2000-2007, it fell to 5 percent of total trade. Cost of trading across borders in South Asia is high. At the Petrapole-Benapole, one of the main borders between Bangladesh and India, trucks wait for more than 100 hours to cross the border. It takes 200 signatures in Nepal to trade goods with India, and some 140 signatures in India to trade goods with Nepal. It is estimated that trade between India and Pakistan, currently at US$1 billion,
15could jump to US$6 to 10 billion, if divisions were removed. Divisions in South Asia have been aggravated by conflict.
12 A spatial multiplier is a concept which captures the additional beneficial effects which result from a policy change as a result of the feedback from spillovers between neighboring regions.
13 See World Bank, 2008a.
14 Borders and divisions are not the same thing. Borders define a nation state whereas divisions influence the flow of people, goods, services, capital, ideas and technology across borders.
15 Includes both formal and informal trade.
Figure 10. Real Growth in Trade of Goods and Services
0.0 2.0 4.0 6.0 8.0 10.0 12.0 14.0
1995-99 2000-04 2005-06 2007
Years
Percent
East Asia Pacific South Asia
Sub-Saharan Africa Middle East and North Africa OECD
Source: World Bank's World Trade Indicators 2008.
Note: Data for 1995-99, 2000-04, and 2005-06 are averages.
The geographical configurations of South Asia contain huge agglomeration potential to propel growth
16. East Asia is an example of a region with a high level of intra-regional trade and intra-industry trade that enabled firms to internalize externalities arising from agglomeration. Firms exporting to the regional markets in South Asia are more constrained by the quality of connectivity and productivity enhancing infrastructure
17. It is the seamless interaction of improved trade, better connectivity, and converging institutions that can accelerate growth in the lagging regions, and benefit the slower growing and smaller land locked regions and countries. In Latin America, Brazil’s growth creates export opportunities for Bolivia. In Africa, resource landlocked countries piggy-backed on the growth of Kenya. In East Asia, Thailand is an important market for Laos and Cambodia.
16 For example, given the large economies of scale in services industries (e.g., telecoms), incentives to invest are greater if the markets are not segmented from other the neighboring countries
17 Based on data from S. Coulibaly.
Figure 11. Trade Tariff Restrictiveness Index
0.0 5.0 10.0 15.0 20.0
2000-04 2005-06 2007
Years
MFN applied tariffs
East Asia Pacific South Asia
Sub-Saharan Africa Middle East and North Africa OECD
Source: World Bank's World Trade Indicators 2008.
Note: Data for 2000-04, and 2005-06 are averages.
Growth benefits of market integration are likely to be large but unequal. India, a
large country, with a big home market, can get by with more restrictive borders, since the
size of its economy and population provides the incentive to importers and exporters to
overcome these barriers. It is the small, land locked countries, like Afghanistan, Bhutan,
and Nepal, which will benefit most from improved access to the markets of others. Small
countries depend more on openness to overcome the disadvantage of size: small
population, small markets, and inability to take advantage of agglomeration and scale
economies. Even within India, the peculiar geography that isolates the seven North-
Eastern states (the so-called 7 sisters) from mainland India with the location of
Bangladesh in-between suggests that market integration requires trade and transit
arrangements with neighbors to benefit all regions that are lagging and isolated from the
growth centers. Tradable economic activities are inherently scalable in the sense that
small economies can expand output without running into diminishing returns (unlike
domestic services). Rapid economic growth, associated with modern sector export
growth, can be ‘lumpy’ (Venables, 2006). Spatially, it can be uneven, with production
being concentrated in some countries, regions or cities. In product space, specialization is
likely to increase, with regions specializing in a few tasks rather than production of
integrated products. Examples of specialization from South Asia include ICT service
export from Bangalore in India; shirts, trousers and hats exported from Bangladesh; and
exports of bed linen and soccer balls from Pakistan. Temporally, rapid growth will
happen only once some threshold level of capabilities has been reached. Some countries
may experience growth before others, resulting in sequential rather than parallel growth.
The benefits of market integration, however, can not be achieved without improving the infrastructure.
Infrastructure: Infrastructure is like second-nature geography, which can reduce
the time and monetary costs to reach markets and thus overcome the limitations of physical geography.
18Improved infrastructure that enhances connectivity and contributes to market integration is the best solution to promoting growth as well addressing rising inequality between regions. The Ganga Bridge in Bihar in India is a good example of second-nature geography. The bridge has reduced the time and monetary costs of farmers in the rural areas in north Bihar to reach markets in Patna, the largest city in Bihar. The Jamuna Bridge in Bangladesh is another good example of spatially connective infrastructure. The bridge has opened market access for producers in the lagging Northwest areas around the Rajshahi division. Better market access has helped farmers diversify into high value crops and reduced input prices.
So far, South Asia has achieved impressive growth rates despite poor infrastructure. This may be difficult to sustain in the future. Poor infrastructure and restrictive labor laws (to be discussed later) are among the major factors that have restrained the growth of manufacturing sector and prevented firms from growing.
19Table 2 shows that the manufacturing share of value added in India is smaller than that share in other large developing economies, though it is similar to that share in smaller countries with GDP per capita similar to that of India (such as Vietnam). However as table 3 shows, the growth of value added in manufacturing in India is noticeably lower than that in these smaller similar income countries. Indeed the sectoral growth comparisons in table 3 are rather striking. The growth of value added in services in India is comparable to that in China, and about 10 percentage points higher than that in other countries. In rather stark contrast the growth of value added in manufacturing in India is only about half that in China and Vietnam.
The service sector in India has done well because it relies less on transportation and is less energy intensive than manufacturing. South Asia has the highest share of services in its exports at 31 percent, which is higher than OECD high income countries.
ICT exports and global outsourcing have benefited from the use of the internet which has reduced information transmission costs dramatically. While other countries can emulate India’s successful efforts to boost services export, sustained high growth will require a substantial effort to raise manufacturing growth in all South Asian countries. In general, poor infrastructure has constrained the growth of labor intensive manufacturing firms in South Asia and prevented the region from making use of its most important asset, its people.
18 See Kanbur and Venables, 2005a.
19 See Fernandez and Pakes, 2008.
Table 2: Industry and Manufacturing Share of Employment and GDP Across Countries
Employment in industry as %
total employment in
2000
Value added in industry as %
of GDP in 2000
Value added in manufacturing as % of GDP
in 2000
2002 GDP per capita (in 2000
USD)
India 18.2 26.3 15.6 480
Brazil 19.3 28 17.1 3473
China 23 45.9 34.7 1106
Indonesia 17.3 45.9 27.7 844
Pakistan 18 22.6 14.8 532
Vietnam 12.4 36.7 18.6 444
Low-income countries 12.3 26.6 14.1
Lower-middle income
countries 18.5 38.3 24.2
Source: World Development Indicators 2005.
Notes: Industry includes manufacturing, but also mining and quarrying (including oil production), construction, and public utilities (electricity, gas, and water). Lower-income countries and lower-middle income countries are defined based on the World Bank classification.
Table 3: Growth in Sectoral Value-Added Across Countries Growth in value added in
manufacturing
Growth in value added in agriculture
Growth in value added in services 1995-00 2000-05 1995-00 2000-05 1995-00 2000-05
India 28.1% 38.4% 13.7% 14.9% 48.4% 50.3%
Brazil 5.7% 5.6% 17.3% 23.7% 26.5% 31.8%
China 57.6% 67.4% 18.5% 21.2% 57.3% 61.2%
Indonesia 14.6% 27.5% 7.0% 17.3% -2.4% 35.7%
Pakistan 17.1% 56.6% 26.5% 12.0% 20.9% 29.9%
Vietnam 70.3% 73.8% 24.2% 20.7% 31.9% 40.0%
Source: World Development Indicators 2005.
Note: The table shows grow rates for each sector in total value added (in constant local currency units) between year t and year t+5.