Policy Research Working Paper 7341
How Much Could South Asia Benefit
from Regional Electricity Cooperation and Trade?
Govinda R. Timilsina Michael Toman Jorge Karacsonyi Luca de Tena Diego Authors
Development Research Group Environment and Energy Team June 2015
WPS7341
Public Disclosure AuthorizedPublic Disclosure AuthorizedPublic Disclosure AuthorizedPublic Disclosure Authorized
Abstract
The Policy Research Working Paper Series disseminates the findings of work in progress to encourage the exchange of ideas about development issues. An objective of the series is to get the findings out quickly, even if the presentations are less than fully polished. The papers carry the names of the authors and should be cited accordingly. The findings, interpretations, and conclusions expressed in this paper are entirely those of the authors. They do not necessarily represent the views of the International Bank for Reconstruction and Development/World Bank and its affiliated organizations, or those of the Executive Directors of the World Bank or the governments they represent.
Policy Research Working Paper 7341
This paper is a product of the Environment and Energy Team, Development Research Group. It is part of a larger effort by the World Bank to provide open access to its research and make a contribution to development policy discussions around the world. Policy Research Working Papers are also posted on the Web at http://econ.worldbank.org. The authors may be contacted at gtimilsina@worldbank.org.
The South Asia region is lagging behind many regions in the world in regional electricity cooperation and trading, despite the huge anticipated benefits. This study uses an electricity planning model that produces optimal expansion of electricity generation capacities and transmission inter- connections in the long-term to quantify the benefits of unrestricted cross-border electricity trade in the South Asia during 2015–40. The study finds that the unrestricted elec- tricity trade provision would save US$226 billion (US$9 billion per year) of electricity supply costs over the period.
The ratio of the present value of benefits, in the form of reduction of fuel costs, to the present value of increased costs due to generation and interconnection would be 5.3.
The provision would reduce regional power sector carbon
dioxide emissions by 8 percent, mainly because of substitu-
tion of coal-based generation with hydro-based generation,
although regional emissions would be well above current
levels absent other policy interventions. To achieve these
benefits, the region is estimated to add 95,000 megawatts
of new cross-border transmission interconnection capacity.
How Much Could South Asia Benefit from Regional Electricity Cooperation and Trade?
1Govinda R. Timilsina, Michael Toman, Jorge Karacsonyi and Luca de Tena Diego
2Key Words: South Asia, Regional electricity cooperation, Cross-border electricity trade, Regional electricity market
JEL Classification: Q27, Q41
1 The study has benefitted enormously from input provided by a number of colleagues at the World Bank, including
Anjum Ahmad, Julia Bucknall, Debabrata Chattopadhyay, Vivien Foster, M. Iqbal, Ashish Khanna, Richard Spencer, Rabin Shrestha, Jie Tang, and Salman Zaheer. We are also grateful to Fouzul Khan, K Ramanathan and other colleagues at TERI, Shankar Sharma, and Ashfaq Mahmood for their expert advice, and to numerous participants in various national level workshops in the region for their comments. The authors are grateful to AusAid for financial support.
2 Timilsina and Toman are, respectively, Senior and Lead Economist, Development Research Group, World Bank; and
Karacsonyi and de Tena Diego, are respectively, Principal Director and Senior Consultant, Mercados. Timilsina is the corresponding author (e‐mail: gtimilsina@worldbank.org).
How Much Could South Asia Benefit from Regional Electricity Cooperation and Trade?
1. Introduction
The South Asia region (SAR) has for some time confronted several challenges affecting its national electricity systems.
3Electricity supplies have not kept pace with demand growth, leading to long daily outages as well as frequent unplanned interruptions. These conditions impose hardships on households and businesses, and discourage new business investment in the economy (World Bank 2014). For example, Nepal faces load shedding up to 16 hours a day during the dry season. Although Nepal’s current grid connected installed generation capacity stands around 700 MW, available capacity in the dry season decreases to one-third of installed capacity. In Pakistan, load shedding can stretch up to 8-10 hours a day. In India, the total electricity demand in fiscal year 2014-15 is expected to be 1,049 TWh against the projected supply of 995 TWh, which represents a shortage of 5 percent (CEA, 2015). Electricity demand also is growing rapidly, and the pace of growth will continue in the future. This implies a need for a rapid expansion of electricity supply systems in the region, both to mitigate current shortages and meet future demands.
Against this backdrop, one important question is the potential cost savings within the sector, and other benefits, from strengthening cross-border electricity cooperation and trade in the region. A number of studies (e.g. Rogers and Rowse, 1989; Bowen et al. 1999; Yu, 2003; Pineau et al. 2004 and Gnansounou et al. 2007) have reported several benefits of expanded cross-border electricity cooperation and trade, including establishment of regional electricity grids. In the context of South Asia, the potential benefits include, among others, (i) lower costs of electricity supply from better utilization of the region’s primary energy endowments, especially the region’s huge hydro resources; (ii) lower costs through economies of scale for new generation capacity through larger projects to serve more integrated systems; (iii) reduction of reliability costs through the provision of multiple links between system loads and cross-country generating resources, and through shared generation reserve margins; and (iv) reduction of environmental costs by increasing availability of cleaner sources of supply (hydro, solar, wind, natural gas), and reducing system balancing challenges with increased use of intermittent renewables (wind, solar). Lower electricity costs in turn would have positive economy-wide impacts (essentially, a positive productivity shock), but we do not attempt to assess that benefit here.
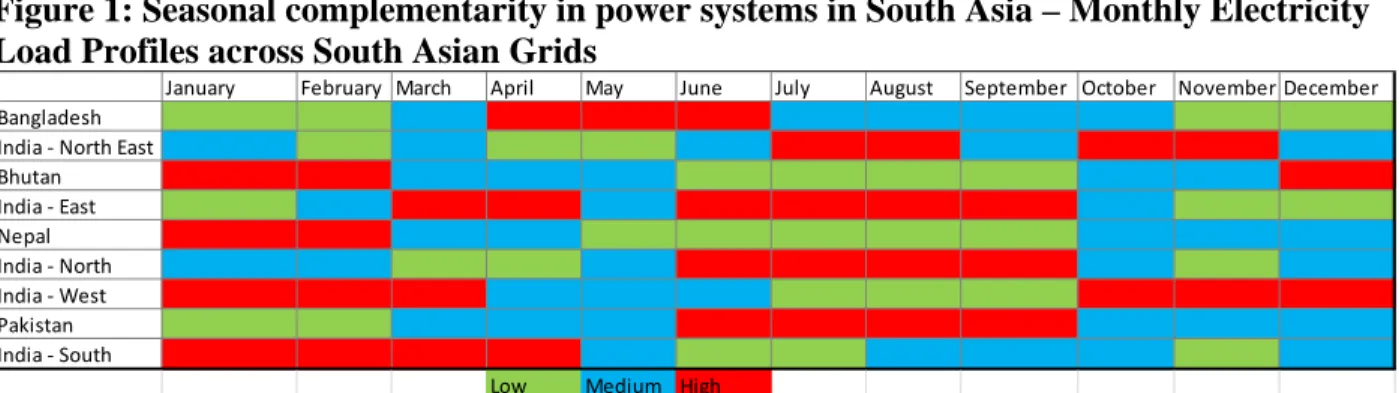
In terms of (i) and (ii) above, Nepal and Bhutan have massive hydropower potential that is only barely being utilized at present – especially in Nepal, where various estimates indicate a technically and economically feasible resource of over 40,000 MW. Northeast India also has huge hydro resources. Economic exploitation of these hydro resources requires access to larger regional markets for the electricity generated. With respect to (iii), Figure 1 illustrates how seasonal peaks in the different SAR countries do not coincide, implying a potential for cost-effectively meeting power demands across the year through cross-border trading of seasonal surpluses in different countries.
3
In this paper we are concerned about the following countries: Afghanistan, Bangladesh, Bhutan, India, Nepal,
Pakistan and Sri Lanka.
Figure 1: Seasonal complementarity in power systems in South Asia – Monthly Electricity Load Profiles across South Asian Grids
Sources: Authors’ calculation based on CEA (2014) (India); Ali, Iqbal and Sharif (2013) (Pakistan); Kunwar (2014) (Nepal); Bangladesh Power Development Board (2013) (Bangladesh).
Despite these potential benefits, the South Asia region is lagging behind other regions that have established expanded cross-border interconnections and regional power exchange. These include the Greater Mekong Regional electricity interconnection,
4the Southern African Power Pool (SAPP),
5and the Central American Electrical Interconnection System (SIEPAC).
6Major barriers in SAR have included limited cross-border transmission links; the presence of bottlenecks in the domestic energy infrastructure; poor operational efficiency, financial performance and creditworthiness of the utilities in the individual countries; and long standing political disputes (Singh et al, 2015). Regulatory reform and harmonization, reduction of trade-distorting inefficient national regulations, and cooperation to overcome domestic limits on institutional capacity are additional important components for more fully realizing the benefits of regionalizing electricity markets.
In this paper we assess the potential economic benefits of cross-border electricity cooperation and trade in South Asia over the longer-term, 2015 – 2040. We focus particularly on the possibilities with unlimited flow of power across borders in response to regional demands and investments in generation and transmission to cost-effectively meet those demands. To our knowledge, this is the first study that quantifies the benefits of full regional electricity trading in South Asia. Existing studies tend to qualitatively highlight the importance of regional electricity cooperation (Srivastava and Misra, 2007; SAARC, 2010; IRADe, 2013 and Rahman et al. 2013).
Rahman et al. (2013) presents some quantitative analysis, but it focusses on already committed cross-border transmission links at sub-regional levels (Bangladesh, Bhutan, India, Nepal and Sri Lanka) and the analysis has a short-term perspective (until 2017).
The study uses a mixed-integer-programming based optimization approach that simulates least-cost plant dispatching and least-cost investments in generation capacity and interconnections to meet projected load in the region while satisfying technical, resource and other constraints. We first use the model to simulate expansion plans for each country separately, incorporating only existing as well as currently committed transmission interconnections. We compare this base case
4 The Greater Mekong Sub-Region (GMS) was established in 1992 and its members include Cambodia, PDR Lao,
Myanmar, Thailand, Vietnam, and the Yunnan Province of China. GMS relies mostly on bilateral trade agreements.
5
Established in 1995, the members of SAPP include Angola, Botswana, Democratic Republic of the Congo, Lesotho, Mozambique, Malawi, Namibia, South Africa, Swaziland, Tanzania, Zambia and Zimbabwe. It manages energy trade within the umbrella of the Southern Africa Development Community (SADC).
6
SIEPAC was set up in 1987, and its members include Panama, Costa Rica, Honduras, Nicaragua, El Salvador, and Guatemala.
January February March April May June July August September October November December Bangladesh
India ‐ North East Bhutan India ‐ East Nepal India ‐ North India ‐ West Pakistan India ‐ South
Low Medium High
to the results of a generation and transmission expansion plan for the region as whole. We also carry out several additional scenarios to examine the sensitivity of our analysis to different assumptions.
One important context-setting result from the base case is that total generation capacity in the region needs to increase by almost 750 GW (more than three times the current installed capacity) to meet rising national-level demands. Thus, large and costly investments will be needed to reduce shortages and respond to demand growth with or without an increase in cross-border cooperation and trade. In comparison to the base case, full regional cooperation would reduce total undiscounted electricity supply costs in the region by an average of more than US$9 billion per year over the time period studied. The gain mainly comes through the savings in operational costs. We find that the ratio of the present value of reduction of fuel costs, to the present value of increased costs for expanded generation and interconnection under full regional cooperation, is 5.3. Total CO
2emissions for the entire region over the 2015-2040 period decline by 8% under full regional cooperation relative to the baseline, due mainly to substitution of coal based generation with hydro-based generation, although regional emissions in either case still would be well above current levels absent other policy interventions.
Section 2 of the paper briefly describes the modeling methodology we use, followed by the presentation of key parameter values and other assumptions in Section 3. Section 4 discusses key simulation results under full regional trading. This is followed by discussion of results from additional scenarios in Section 5. Key conclusions and implications are summarized in Section 6.
2. Methodology
The methodology used to assess the potential benefits of cross-border electricity cooperation and trade is based on a dynamic least-cost simulation model that identifies, for a given set of assumptions, the sequence of investments for expansion of generation and grid interconnection so that the power systems being studies meet a projected time profile of electricity demand with the lowest present value of cost. The costs included are for the new investments, fuel, and operation and maintenance. In addition, since we are concerned with the social cost of electricity system investment and operation, not just the direct financial cost, there is a representation in the model of the cost of unserved electricity demand while capacity investment
“catches up” to meet demands. The model takes into account resource characteristics (e.g., potentials of hydro, solar, wind), technological characteristics (e.g., capacity limits, ramping time, provision of spinning reserves, capacity availability), and costs for fuels, capacity investments, and O&M. It facilitates an optimal trade-off between capacity expansion (investment) and operational costs of the system (including the cost of not serving the load). The model also can be used to reflect various environmental objectives, as we show in Section 5.
Our application of the model over the study horizon of 2015-2040 incorporates the following information specific to SAR:
Electricity generation and grid-interconnection projects that are currently under
construction or are committed to be built in the near future (including the CASA
transmission line for bringing 1000 MW of power from Central Asia to Afghanistan and
Pakistan).
Potential additional transmission interconnections between national grids and the five regional grids in India.
Existing policies, particularly related to renewable energy targets (though we do not include the Government of India’s latest 2020 target of renewable energy).
Unit costs in the region of various types of electricity generation technologies including coal/lignite, natural gas combined cycle and simple cycle gas turbine, diesel or other oil firing internal combustion engine, run of river and storage type hydro power, wind power, solar, biomass and nuclear power.
Costs of electricity dispatching – fuel costs and variable operation and maintenance O&M) costs.
Costs of maintaining electricity supply reliability standards (through an implicit target margin for capacity planning).
To represent the load duration curves (LDCs) for electricity demand, the model divides the year into six “seasons” and then looks within each season at seven different demand “blocks”
corresponding to different degrees of capacity utilization (from low to peak, for that season). In meeting electricity demand, each country faces zonal “reliability constraints” which state that the firm capacity installed in the zone, plus firmly contracted imports minus firmly contracted exports, should be greater than the peak demand.
7Candidates for new generation and transmission can be considered as discrete or continuous investment. For example, wind generators are relatively small, so wind expansion can be considered as a continuous investment decision, while big hydro projects are project-specific discrete decisions. Capital expenditures are allocated uniformly across the construction period (or lead time). If the economic life of the asset exceeds the optimization horizon, capital expenditures are scaled down to take into account the residual value of the investment.
The model chooses cost-minimizing combinations of building new power plants and strengthening the transmission network to more fully exploit existing generation capacities. In order to allow increased cross-border electricity trade, the model configures both additional transmission capacity between “zones” (national grids or, for India, regional-sub-grids), and the location and type of generation capacity increments. Power flows with increased cross-border electricity cooperation and trade are not limited to adjacent grids in the model. For example, if it is cheaper to supply power to the East India grid by developing new hydro generation capacity in the Northeast India grid and then transmitting that power across Bangladesh, perhaps with power sales to Bangladesh as well, the model will utilize that option – just as would actual power companies and traders in a well-organized regional market. Similarly, hydropower from Nepal could in principle flow through India to meet demand in Pakistan.
8To assess the potential gains from increased cross-border cooperation and trade, we start with a baseline scenario in which we assume no increased interconnections across countries beyond what are currently in place or are already committed to build. In this baseline, each country independently makes its own capacity investments (including increased internal grid connections,
7
As noted, trade flows can move in different directions across seasons, with a particular area being an importer at one time and an exporter in another.
8 A detailed technical description of the model is available at
http://econ.worldbank.org/WBSITE/EXTERNAL/EXTDEC/EXTRESEARCH/EXTPROGRAMS/EXTEAER/0,,co ntentMDK:22205467~menuPK:6477885~pagePK:64168182~piPK:64168060~theSitePK:5991650,00.html.
especially in India) to satisfy its projected demand profile.
9We compare this baseline with a scenario that has a fully integrated regional system. In the model, we represent this as capacity investments and capacity utilization decisions made to minimize the present value of investment and operation costs across the region – as if the region were one power pool. While this is certainly not what one might expect right away with gradual increases in cross-border cooperation and trade in the near-to-medium term,
10it does illustrate the potential benefits of cross-border trade and investment. It also illustrates the kinds of investments in both generation and transmission, and the nature of power flows, that increased cross-border cooperation and trade could engender.
We run two other cooperation scenarios for different sub-regions of SAR. The first sub- regional cooperation scenario focuses on the eastern part of South Asia – Bangladesh, Bhutan, India and Nepal. The second sub-regional cooperation scenario focuses on Afghanistan and Pakistan. As described further in Section 5, we also have looked at the base and full cooperation scenario under several different assumptions about model parameters. In particular, we have checked what happens to the model results if we assume the capacity investments currently in project pipelines are slowed and unserved demand takes longer to be reduced.
3. Data and Assumptions
The volume of data needed by this type of study is substantial. The key data items needed in this analysis include physical characteristics of existing as well as candidate power plants, economic data, system reliability data and load forecasts. The description of data items, their sources and various assumptions we made under each data category are briefly discussed below.
3.1 Physical characteristics of power plants and transmission interconnections (existing and candidate)
For the existing thermal electricity generation plants, information needed includes plant capacity, utilization factor, plant vintage, heat rate (or thermal efficiency) and heat and pollutant contents of the fuel. For hydro power plants information needed are type of plant (e.g., storage, run of river or pumped storage), capacity utilization rate by month or season as water discharge varies every month, especially in the case of run of river type hydropower plants. Resource availability information, in terms of capacity utilization, is also needed for other renewable sources such as solar, wind and biomass. For transmission interconnection, information needed are power flow capacity, voltage level and distance between interconnecting points. All information mentioned above are needed for all power plants and transmission interconnections that can be candidates for new addition during the planning horizon (2015 to 2040).
In Afghanistan, the list of existing as well as candidate power plants and their physical characteristics are taken from the power sector master plan prepared by the Asian Development Bank (ADB, 2013a) and a study commissioned by the Special Inspector General for Afghanistan Reconstruction in 2010 (SIGAR, 2010). All candidate hydropower plants in Afghanistan are assumed to be run of river type. In Bangladesh, the list of power plants and their physical
9
This includes Nepal-India, Bangladesh-India, and Bhutan-India; it also includes the 1000MW for Afghanistan and Pakistan from Central Asia under the CASA project.
10
It is what would emerge eventually from successful implementation of the SAARC’s 2014 agreement on
coordinated development of a regional power market.
characteristics are obtained from the official website of Bangladesh’s national power utility, Bangladesh Power Development Board (BPDB, 2013), and the 2010 Power Sector Master Plan prepared by the Japan International Cooperation Agency and Tokyo Electric Power Company for the Ministry of Power, Energy and Mineral Resources (MPEMR, 2011). For Bhutan, physical characteristics of power plants are from the National Statistical Yearbook of Bhutan (NSB (2013) and Annual Reports of Druk Green Power Company Limited, Bhutan’s national power company (DGPCL, 2013).
For Pakistan, physical characteristics of power plants are from an existing Power Sector Master Plan prepared by the SNC-Lavalin International Inc. in association with National Engineering Services Pakistan Limited for the National Transmission and Despatch Company Limited, Pakistan (NTDCL, 2011). The data are supplemented with information from an integrated energy plan 2009-2022 prepared by an energy expert group for the Economic Advisory Council, Ministry of Finance (EAC, 2009). Information on candidate hydropower projects are from a survey report prepared by Pakistan’s Water and Power Development Authority (PWAPDA, 2011). Data for Sri Lanka are from the Central Electricity Boards’ Long Term Generation Expansion Planning 2013-2032 prepared by for Government of Sri Lanka (CEB 2012). We tried to use the data from the existing electricity master plan, where available, to be consistent with countries national electricity expansion plan in the baseline. However, we did not force all aspects of the baseline in the master plan to apply in our study, as the underlying assumptions in the master plan might be different from ours.
In India, the list of all existing plants and their installed capacities, year of commissioning and fuel type were taken from various documents (CEA 2012a, 2012b, 2012c and 2012d) published by the Central Electricity Authority (CEA), a statutory organization under the Central Government that advises on matters relating to national electricity policy and plans. Supplemental information is taken from Energy Statistics published by India’s Central Statistics Office (e.g., CSO, 2012).
In Nepal, information related to existing and planned plants is from annual reports of Nepal Electricity Authority, (e.g., NEA, 2013). Information related to candidate hydro power projects is critical for Nepal, as it is the main supplier of hydropower under the regional electricity trading scenario. Individual plant level information was obtained from various sources (MOE, 2010;
detailed feasibility and pre-feasibility study reports of various hydropower projects). The aggregate capacity of these plants exceeds 31,000 MW. Another 2,000 MW, including large and small hydropower projects is under construction. Thus, existing, under construction and candidate power plants for which information is available at individual plant level add up to about 33,000 MW, 76% of the total potential identified as economically feasible in the country. We model the rest of the potential hydro capacity (run of the river and storage) as aggregated power plants with characteristics similar to the most expensive individually identified plants.
Since no information is available on the retirement of power plants, we assume no power plant already in operation will retire during the study period. If an existing power plant is too old to operate throughout the study horizon, it will be renovated. This is an optimistic assumption, but no alternative to this assumption is available in the absence of committed retirement dates for existing power plants.
Technology specific standard data are used for some aspects of candidate power plants for
new capacity investment. For example, construction times of 4 years for coal, 3 years for CCGT,
2 years for GT, 6 years for nuclear, 1.5 for wind and PV and 4 years for hydro are assumed.
Thermal efficiencies of power plants are assumed to be 37 to 40% for diesel engines, 38 to 39%
for gas turbines, 36 to 40% for steam turbines, 54 to 56% for CCGT and 33% for nuclear. Plant availability factors are 90% for CCGT, diesel and gas turbine, 40 to 60% for hydro, 80% for biomass, 18 to 20% for solar, 27 to 30% for wind and 87 to 90% for nuclear.
3.2 Economic costs of generation capacity
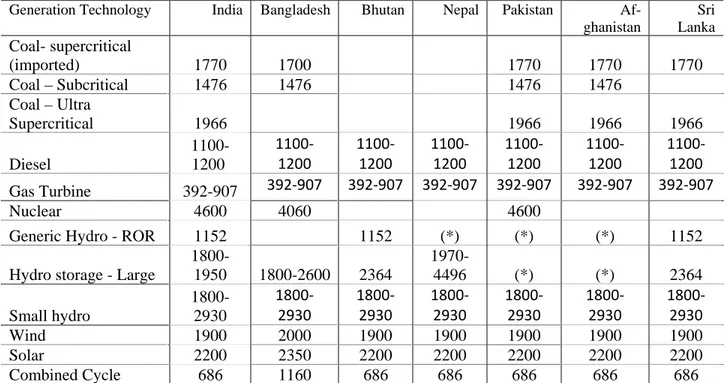
Economic cost information for generation plants includes capital costs ($/kW) of each type of candidate power plants, non-fuel O&M costs, and economic lives of plant investments. While this type information ideally should be plant-specific, especially for large scale plants such as large hydropower projects, generalized information based on averages for a technology (e.g., capacity cost of combined cycle gas turbine) is used here. The summary of plant cost data is presented in Table 1. Differences across countries in these costs result in part from detailed consultations with technical experts in Bangladesh, India, Nepal, and Pakistan. For non-hydro renewable energy (i.e., solar and wind), we have carried out sensitivity analysis reducing their future capital costs. The economic life of a plant is assumed to be 30 years for steam turbine technology fired with coal or biomass; 20 years for solar, wind, gas turbine technologies and diesel fired internal combustion engines; 25 years for combined cycle gas turbine technology; 40 years for nuclear technology; and 50 years for hydropower plants.
3.3 Fuel prices
Projections of fuel prices were determined using various sources of information. For coal, we collected domestic coal prices in India and Pakistan and assumed that they would increase at the same rate the imported coal price increases. International price projections are available from International Energy Agency’s 2013 World Energy Outlook (IEA, 2013), which we used to set the trend for imported coal prices in South Asian countries.
11One important factor, often neglected in regional power system generation expansion planning, is the cost of transporting coal over a long distance from the mine or port. We account for transportation costs for all power plants considered in the study, albeit roughly. This is extremely important in a large country like India where some electricity grids (e.g., Eastern Electricity Grid of India) are endowed with fossil fuel reserves whereas others are not.
11
The World Energy Outlook incorporates different scenarios. We have taken all of our fuel price projections from
the current policy scenario, which reflects continuation of existing technology trends but no fundamental technological
or policy transformation.
Table 1. Key economic data: capital and O&M costs power generation technology by type Capital costs (US$/kW)
Generation Technology India Bangladesh Bhutan Nepal Pakistan Af- ghanistan
Sri Lanka Coal- supercritical
(imported) 1770 1700 1770 1770 1770 Coal – Subcritical 1476 1476 1476 1476 Coal – Ultra
Supercritical 1966 1966 1966 1966 Diesel
1100- 1200
1100‐
1200
1100‐
1200
1100‐
1200
1100‐
1200
1100‐
1200
1100‐
1200 Gas Turbine 392-907 392‐907 392‐907 392‐907 392‐907 392‐907 392‐907
Nuclear 4600 4060 4600
Generic Hydro - ROR 1152 1152 (*) (*) (*) 1152 Hydro storage - Large
1800-
1950 1800-2600 2364 1970-
4496 (*) (*) 2364 Small hydro
1800- 2930
1800‐
2930
1800‐
2930
1800‐
2930
1800‐
2930
1800‐
2930
1800‐
2930
Wind 1900 2000 1900 1900 1900 1900 1900
Solar 2200 2350 2200 2200 2200 2200 2200
Combined Cycle 686 1160 686 686 686 686 686 The capital costs of biomass technology to be available by 2020 is $2800/kW; the cost is assumed to drop to
$2600/kW by 2050. (*) No generic projects, all identified Fixed O&M Costs (US$/kW)
Generation Technology India Bangladesh Bhutan Nepal Pakistan Afghanistan Sri Lanka Coal- supercritical
(domestic) 22 39 22 22 22 22 22
Coal- supercritical
(imported) 22 39 22 22 22 22 22
Coal – Subcritical 22 39 22 22 22 22 22 Coal – Ultra Supercritical 22 39 22 22 22 22 22
Diesel 30 13.7 13.7 13.7 13.7
Gas Turbine 17.6 17.6 17.6 17.6 17.6 17.6 17.6
Nuclear 116 40 116
Generic Hydro ROR 29 40 23 38 26 62 55 Hydro storage large 29 40 23 38 26 62 55
Small hydro 29 40 23 38 26 62 55
Wind 21.5 21.5 23.5 21.5 21.5 21.5
Solar 19.6 24 19.6 19.6 19.6 19.6 19.6
Combined Cycle 14.7 30 14.7 14.7 14.7 14.7 14.7 The fixed O&M costs of biomass technology to be available by 2020 is $71.5/kW; the cost is assumed to drop to
$69.6/kW by 2050. Note and Source: These costs are compiled from various sources available in the region.
Hydropower costs are based on available feasibility or pre-feasibility studies. Costs of wind and solar energy technologies are from International Energy Agency (IEA) and International Renewable Energy Agency (IRENA).
Costs of thermal power technologies are based on latest bids of similar projects in a given country. In India, for
example, they are either as per norms mentioned in different Regulations of CERC or on the basis recently built plants
of the similar kind. Fixed O&M costs for all committed and candidate power plants are assumed as per the norms
specified by national electricity authorities. In India, for example, they are compiled based on norms specified by the
Central Electricity Regulatory Authority (CERC, 2009 and CERC, 2012).
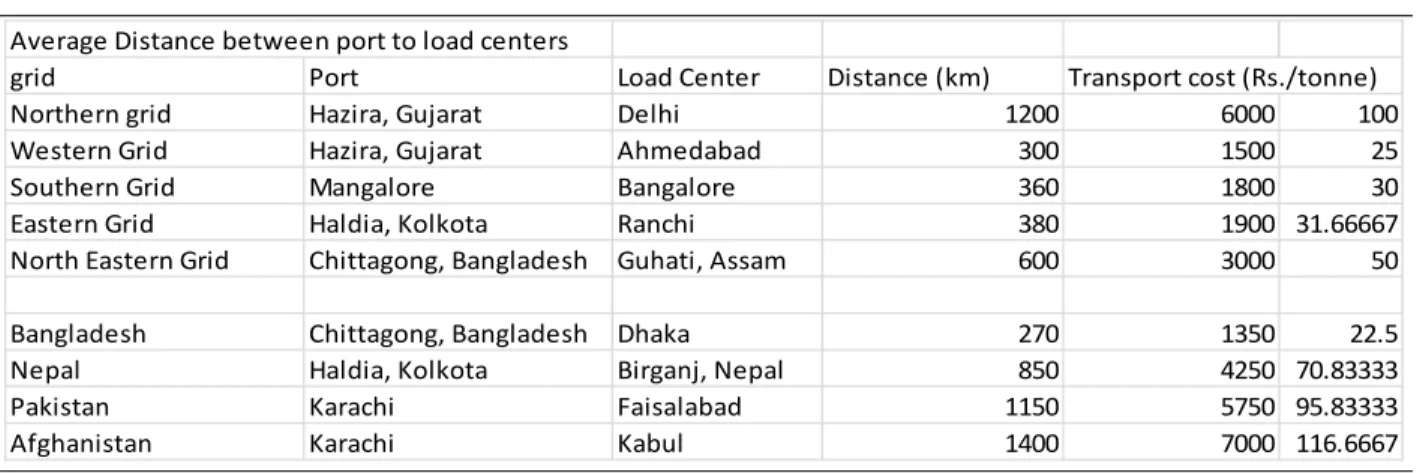
In order to incorporate transportation costs for fuels, we first find the distance through which imported coal needs to be transported once it is landed in a port. Table 2 presents the estimation of transportation costs a power plant would need to pay, on average, if it uses imported coal in Afghanistan, Bangladesh, India and Pakistan. According to Coal India Limited, the current transportation costs of coal using railway is Indian Rs. 5/per ton-per km. Using this figure in Table 2, we find that the price of imported coal varies from IRs. 22.5/tonne in Bangladesh to Irs.
100/tonne in Northern Grid of India to 117/tonne in Afghanistan. It would cost Irs. 71/tonne in Nepal and Irs. 96/tonne in Pakistan. As power plants using domestic coal tend to be sited near mines, we assume an average distance between mine to power plant 20 km; therefore we add Rs.100/tonne for transportation cost.
Table 2: Price of imported coal after transportation cost adjustments US$/Tonne)
For natural gas, we assumed that the regulated prices of domestic gas would increase gradually in order to fully converge with the price of LNG imports by 2040. For example, the average price of natural gas in Bangladesh is set at $4.20/mmbtu in 2015, we assume that it would increase gradually and reach $12.40/mmbtu in 2040 to be equal to the price of LNG imported by the country in that year. The projection of international LNG prices also comes from IEA (2013).
The price of natural gas for electricity generation is a weighted average price of domestic gas and imported LNG. The share of imported LNG in Bangladesh would be very small, 2% of the total supply in 2020, but it would reach 70% by 2040 (Petrobangla, 2012). In Pakistan, prices of domestic gas and imported LNG are expected to be, respectively US$10/mmbtu and US$13.2/mmbtu in 2015. They will converge to US$12.40/mmbtu by 2040. The share of LNG in total gas supply is 42% in 2015, but it is projected to be 80% by 2040 (EAC, 2010). In India, the price evolution of domestic and gas and imported LNG are similar to those in Pakistan; the share of imported LNG is already 60% in India, which is expected to remain stable until 2040.
We have also incorporated the costs of LNG port facilities and transportation costs while delivering imported natural gas to the site of power plants. Based on the Gas Authority India Limited (GAIL) asking price of Rs. 73.5/MMBTU for 1400 km transmission line, gas transportation cost is estimated to be Rs. 0.0525 per Km per MMBTU. For petroleum products we have made use of projections from World Energy Outlook 2013 (IEA, 2013).
Average Distance between port to load centers
grid Port Load Center Distance (km) Transport cost (Rs./tonne)
Northern grid Hazira, Gujarat Delhi 1200 6000 100
Western Grid Hazira, Gujarat Ahmedabad 300 1500 25
Southern Grid Mangalore Bangalore 360 1800 30
Eastern Grid Haldia, Kolkota Ranchi 380 1900 31.66667
North Eastern Grid Chittagong, Bangladesh Guhati, Assam 600 3000 50
Bangladesh Chittagong, Bangladesh Dhaka 270 1350 22.5
Nepal Haldia, Kolkota Birganj, Nepal 850 4250 70.83333
Pakistan Karachi Faisalabad 1150 5750 95.83333
Afghanistan Karachi Kabul 1400 7000 116.6667
Finally, we have assumed a uniform 5% real discount rate for all countries. As is often the case, the choice of discount rate in this research was subject to various arguments. We initially selected a real discount rate of 8%, but were then advised that this rate was higher than what was typically used to evaluate social benefits and costs (e.g. from public investment) in at least some of our countries of interest. Since it is social benefits and costs, not private benefits and costs, that are relevant to our analysis, we updated our assumption to the lower 5% rate.
123.4 Electricity Load Projections
Our electricity load projections are exogenously specified. While the price elasticity of demand for electricity certainly is not zero, assuming exogenously specified demands allowed us to utilize national load forecasts to the extent available. The electricity loads in 2013 were 5898MW for Afghanistan, 8,349MW for Bangladesh, 417MW for Bhutan, 159,177 MW for India, 1,185MW for Nepal, 24,989 MW for Pakistan and 2,451MW for Sri Lanka. National load forecasts are available in Bangladesh until 2030 (MPEMR, 2011), in Bhutan until 2020 (RGB, 2010), in India until 2022 (CEA, 2012e), in Nepal until 2027 (NEA, 2012) in Pakistan until 2030 (NTDCL, 2011) and in Sri Lanka until 2032 (CEB, 2012). The load forecast for Afghanistan is from ADB (2013a).
For the remaining period between the last year for which a national load forecast is available and 2040, we have projected the electricity load growth to be the same as the growth of per capita GDP. There is debate about the extent to which electricity demand growth will be faster than income growth for lower-income populations, or whether demand growth may start to slow down relative to income growth as incomes rise, especially in India. Our assumption is a simple compromise among these competing influences. One of our sensitivity analyses examines the implications of more rapid electricity demand growth.
13With these assumptions, loads are projected to grow annually at average rates of 4.6%, 6.6%, 1.7%, 5%, 6.2%, 6.1% and 4.5% in Afghanistan, Bangladesh, Bhutan, India, Nepal, Pakistan and Sri Lanka, respectively during the 2013-2040 period. Total electricity load for the region as a whole will grow at an average rate of 5.2% annually during the 2013-2040 period. We assume the differences across demand blocks in each country remain the same as they are now.
4. Key Results – Baseline and Full Regional Trading Scenarios
The full regional trading scenario assumes that there would be unrestricted flow of power from any part of the region to any other parts as determined by the markets. The scenario assumes the entire South Asia region has a system of fully interconnected grids. Below we present results under this scenario as compared to the baseline scenario. In the baseline scenario, each country optimizes its power systems individually incorporating all existing policies including cross-border interconnections already connected. For example, the 1000 MW Central Asia South Asia (CASA) transmission interconnection is part of the baseline. Renewable energy targets are also the part of the baseline.
12
The results with 8% were as might be expected: a decided switch in the mix of generation investments toward those with lower capital costs, including significantly less hydro investment.
13
Slower demand growth had very limited impacts on the general findings.
To set a context for the results under full regional trading, Tables 3a through 3d present key findings from the baseline analysis.
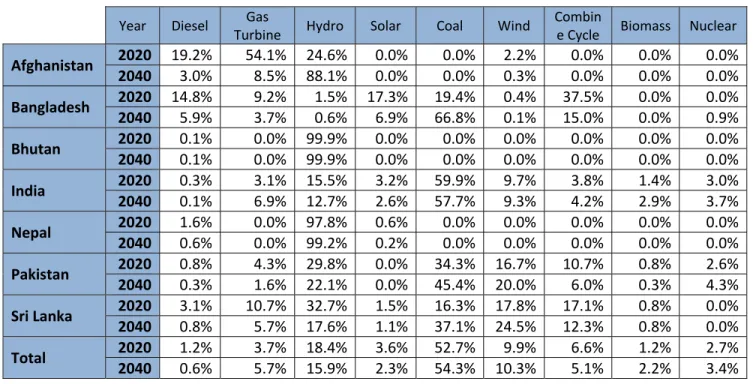
14Tables 3a and 3b show how generation capacity evolves out to 2040 without increased cross-border cooperation and trade. Total regional capacity would increase by 3.8 fold, from 276 GW in 2013 to 1,067 GW in 2040. More than 70% of the total regional capacity would be installed in India. Bangladesh, India, Pakistan and Sri Lanka would have large shares of coal in total electricity capacity. As of 2020, the share of coal-fired generation capacity in the total installed capacity would be 19%, 60%, 34% and 16%, respectively in those four countries. The corresponding shares in 2040 would be 67%, 58%, 45% and 37%. The systems in Afghanistan, Bhutan, and Nepal are dominated by expansion in hydro generation capacity.
Table 3a: Baseline Scenario Installed Capacity (GW)
2020 2030 2040
Afghanistan 1.1 6.0 7.0
Bangladesh 27.2 48.7 67.8
Bhutan 6.9 14.7 14.8
India 387.2 586.5 783.9
Nepal 3.4 7.9 9.3
Pakistan 57.5 108.7 173.0
Sri Lanka 5.8 9.1 11.7
Total 489 782 1067
Table 3b: Baseline Installed Capacity Mix in 2020 and 2040 (%)
Year Diesel Gas
Turbine Hydro Solar Coal Wind Combin
e Cycle Biomass Nuclear
Afghanistan 2020 19.2% 54.1% 24.6% 0.0% 0.0% 2.2% 0.0% 0.0% 0.0%
2040 3.0% 8.5% 88.1% 0.0% 0.0% 0.3% 0.0% 0.0% 0.0%
Bangladesh 2020 14.8% 9.2% 1.5% 17.3% 19.4% 0.4% 37.5% 0.0% 0.0%
2040 5.9% 3.7% 0.6% 6.9% 66.8% 0.1% 15.0% 0.0% 0.9%
Bhutan 2020 0.1% 0.0% 99.9% 0.0% 0.0% 0.0% 0.0% 0.0% 0.0%
2040 0.1% 0.0% 99.9% 0.0% 0.0% 0.0% 0.0% 0.0% 0.0%
India 2020 0.3% 3.1% 15.5% 3.2% 59.9% 9.7% 3.8% 1.4% 3.0%
2040 0.1% 6.9% 12.7% 2.6% 57.7% 9.3% 4.2% 2.9% 3.7%
Nepal 2020 1.6% 0.0% 97.8% 0.6% 0.0% 0.0% 0.0% 0.0% 0.0%
2040 0.6% 0.0% 99.2% 0.2% 0.0% 0.0% 0.0% 0.0% 0.0%
Pakistan 2020 0.8% 4.3% 29.8% 0.0% 34.3% 16.7% 10.7% 0.8% 2.6%
2040 0.3% 1.6% 22.1% 0.0% 45.4% 20.0% 6.0% 0.3% 4.3%
Sri Lanka 2020 3.1% 10.7% 32.7% 1.5% 16.3% 17.8% 17.1% 0.8% 0.0%
2040 0.8% 5.7% 17.6% 1.1% 37.1% 24.5% 12.3% 0.8% 0.0%
Total 2020 1.2% 3.7% 18.4% 3.6% 52.7% 9.9% 6.6% 1.2% 2.7%
2040 0.6% 5.7% 15.9% 2.3% 54.3% 10.3% 5.1% 2.2% 3.4%
14
All the baseline results are presented in Appendix A.
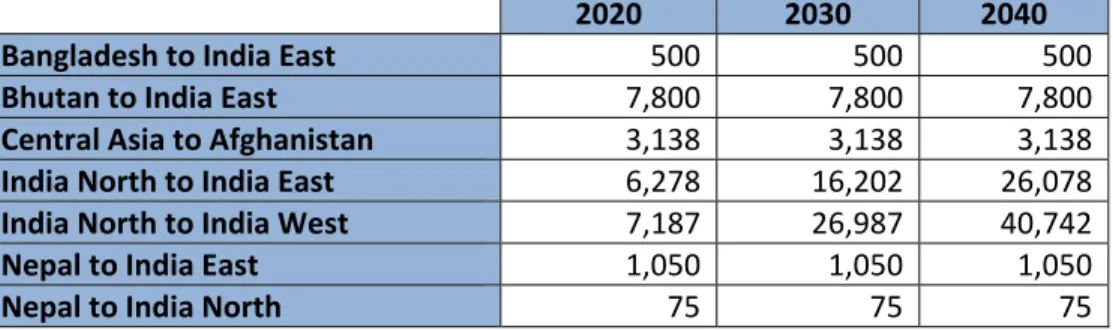
In the baseline, the expansion of grid interconnection mainly takes place within India.
Cross-border interconnections between India-Bhutan and India-Nepal that are under construction or committed are implemented. In India most regional inter-grid connections are built by 2020;
the connections that would expand in later periods of the study horizon are between northern and eastern grids and northern and western grids. These grids would be required to transmit coal fired generation from eastern and western grids to northern grids, where power demand is expected to increase the most and coal-fired generation is more expensive. This is because local coal resources there are limited, and imported coal carriers high transportation costs.
Table 3c: Baseline Scenario Changes in Grid Interconnection Capacity (MW)
2020 2030 2040
Bangladesh to India East 500 500 500
Bhutan to India East 7,800 7,800 7,800
Central Asia to Afghanistan 3,138 3,138 3,138 India North to India East 6,278 16,202 26,078 India North to India West 7,187 26,987 40,742
Nepal to India East 1,050 1,050 1,050
Nepal to India North 75 75 75
The model results indicate that in the baseline, South Asia would spend 1,390 billion US$ for expanding electricity generation expansion during the 2015-2040 period, to add approximately 750 GW of electricity generation capacity. Already committed and planned inter-grid connection, especially within India, would require around 29 billion US$.
Table 3d: Baseline Scenario Undiscounted Cumulative Investment for 2015-2040 (Billion US$)
Investment (Generation)
Investment
(Interconnection) Operation Total
Afghanistan 16.36 0.18 0.47 17
Bangladesh 105.12 0.63 226.20 332
Bhutan 32.08 0.54 0.00 33
India 929.67 27.93 2,160.03 3118
Nepal 10.75 0.00 0.00 11
Pakistan 276.96 0.00 292.39 569
Sri Lanka 18.67 0.00 27.69 46
Total 1,390 29 2,707 4126
In the balance of this section, we present the results under the full regional trading scenario.
4.1 Installed Generation Capacity
The impacts of full regional interconnection on total installed capacity as compared to that
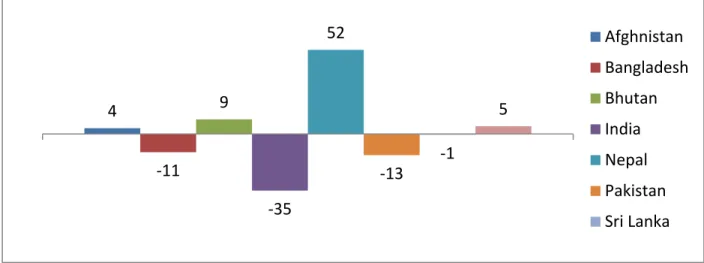
under the baseline are presented in Figure 2. As can be seen from Figure 2a, Bangladesh and India
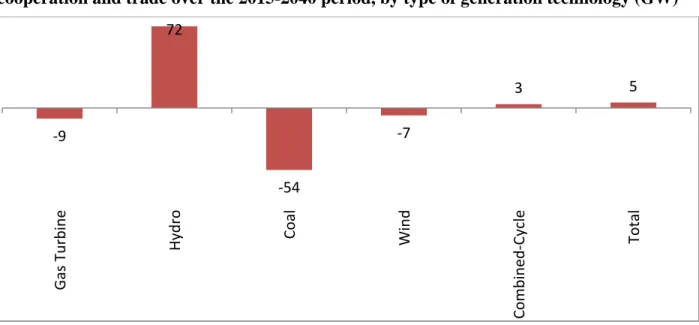
will lower expansion of their installed capacity by 11 GW and 35 GW respectively from their
baselines during the 2015-2040 period. Installed capacity of coal falls by 54 GW, wind by 7 GW,
and gas turbine by 9 GW (see Figure 2b). These reductions in capacity are offset by hydro (52 GW from Nepal, 11 GW from India, 9 GW from Bhutan and 1.5 GW from Afghanistan) and combined cycle gas turbine from India (9 GW).
The primary reason for the expansion of hydro power capacity in Nepal is low cost hydro projects that allow replacing coal fired generation in the Northern Grid of India. This grid has the highest total electricity demand in India, and electricity demand in this grid increases by more than three times between 2015 and 2040. On the other hand, this grid has only limited supply of coal, the cheapest source for electricity generation. Utilization of imported coal would be expensive due mainly to coal transportation costs from the nearest port, which is 1200km away from the load center (Delhi). Therefore, Nepal’s hydro, which is located within 400 km distance and relatively cheaper compared to other generation resources would be an attractive option to meet electricity demand in the Northern electricity grid of India.
Under regional cooperation and trade, total regional installed capacity would be modestly higher compared to the baseline – by about 5 GW. This is because the capacity factors of increased hydropower in Bhutan and Nepal would be lower compared to that of thermal power replaced in India and Bangladesh.
Figure 2a: Cumulative change in total installed capacity relative to regional cooperation and trade over the 2015-2040 period, by country (GW)
4
‐11 9
‐35
52
‐13
‐1
5
Afghnistan
Bangladesh
Bhutan
India
Nepal
Pakistan
Sri Lanka
Figure 2b: Cumulative change in total installed capacity relative to baseline with regional cooperation and trade over the 2015-2040 period, by type of generation technology (GW)
Note: Electricity generation technologies not showing any change in their installed capacity as compared to that in the baseline scenario are not included in this graph.
4.2 Electricity Generation for 2015-2040 Period
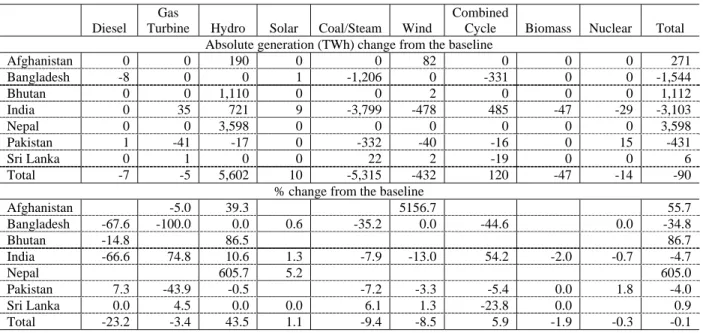
Table 4 presents change in cumulative electricity generation from various types of power plants during the 2015-2040 period under regional electricity cooperation and trade. Also presented in the table are the changes expressed as percentages of corresponding generation in the baseline. Under full regional cooperation and trade, electricity generation from hydropower plants in Nepal and Bhutan substitutes for coal based generation in India and Bangladesh. Regional electricity trade would increase total electricity generation in Nepal and Bhutan during the 2015- 2040 period by 7 and 2 times, respectively. Electricity generation in Afghanistan during the same period increases by 56%. These increases would replace 35%, 5% and 4% of the total electricity generation in Bangladesh, India and Pakistan, respectively. As with installed capacity, generation from coal fired plants would be substituted with mainly hydro and to some extent with gas combined cycle. Total coal based generation during the 2015-2040 period, which would be 56,648 TWh, drops by 9.4%. Electricity generation from hydropower plants that accounted for 12,865 TWh during the 2015-2040 in the baseline increases by 44% under the full regional trading scenario. Electricity generation from combined cycle power plants increases by 6%. Other generation that also gets replaced by hydro and combined cycle based generation incude diesel, wind and gas turbine based power plants. Note that to meet the domestic demand in the absence of regional trade, there was a huge expansion of wind power in India and Pakistan. In the baseline, wind generation increased by about 4 fold in India and about 34 fold in Pakistan between 2015 and 2040. Under regional trade, part of that wind power generation is replaced by hydro. In the region as a whole, wind power generation during the 2015-2040 period drops by 8.5% relative to the baseline.
‐9
72
‐54
‐7
3 5
Gas Turbine Hydro Co al Wind Co mbined ‐ Cycle Total
Table 4: Changes in cumulative electricity generation for the 2015-2040 period from the baseline
Diesel Gas
Turbine Hydro Solar Coal/Steam Wind
Combined
Cycle Biomass Nuclear Total Absolute generation (TWh) change from the baseline
Afghanistan 0 0 190 0 0 82 0 0 0 271 Bangladesh -8 0 0 1 -1,206 0 -331 0 0 -1,544 Bhutan 0 0 1,110 0 0 2 0 0 0 1,112 India 0 35 721 9 -3,799 -478 485 -47 -29 -3,103 Nepal 0 0 3,598 0 0 0 0 0 0 3,598 Pakistan 1 -41 -17 0 -332 -40 -16 0 15 -431 Sri Lanka 0 1 0 0 22 2 -19 0 0 6 Total -7 -5 5,602 10 -5,315 -432 120 -47 -14 -90
% change from the baseline
Afghanistan -5.0 39.3 5156.7 55.7 Bangladesh -67.6 -100.0 0.0 0.6 -35.2 0.0 -44.6 0.0 -34.8 Bhutan -14.8 86.5 86.7 India -66.6 74.8 10.6 1.3 -7.9 -13.0 54.2 -2.0 -0.7 -4.7 Nepal 605.7 5.2 605.0 Pakistan 7.3 -43.9 -0.5 -7.2 -3.3 -5.4 0.0 1.8 -4.0 Sri Lanka 0.0 4.5 0.0 0.0 6.1 1.3 -23.8 0.0 0.9 Total -23.2 -3.4 43.5 1.1 -9.4 -8.5 5.9 -1.9 -0.3 -0.1
4.3 Electricity Supply Costs
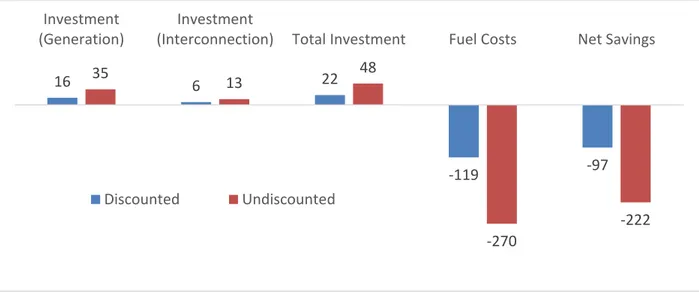
The changes in cumulative electricity supply costs over 2015-2040 due to the full regional electricity cooperation and trade, relative to the baseline, are illustrated in Figure 3. As illustrated in the figure, regional trade in the power sector would lead to $222 billion in undiscounted net savings of power supply costs in the region during the 2015-2040 period. When discounted at the assumed 5% real discount rate, this net savings would be $97 billion in 2015 dollars. This is about 5% of the total electricity supply costs during the 2015-2040 period. The cost savings mainly come through the savings in operational costs, which fall by $270 billion US$, undiscounted, and $119 billion when discounted. At the same time, there would be a net increase in investment and fixed O&M costs for both expansion of generation capacity and transmission interconnections. The total regional investment (including fixed O&M costs) would be $48 billion, undiscounted and $22 billion, discounted. The ratio between the discounted benefits and costs stands at 5.34. This indicates the extent to which regional electricity cooperation is beneficial for the South Asia region as a whole.
1515
In principle, it would be possible with the model to assess net benefits for individual countries using the shadow
prices generated by the model’s cost-minimization as representing competitive market prices. In practice, however,
this turned out to be difficult to do, even if one accepted a competitive power market as the benchmark for calculating
different countries’ net benefits. This was due in part to the presence of congestion rents in a number of
interconnections and demand blocks in the optimization. Further work is needed to assess different potential country-
level distributions of regional benefits from trade. However, it seems clear that there are (infinitely) many distributions
of generation and congestion rents such that all participants are better off than in the baseline. Which distributions
might emerge will depend on the relative degree of market power of different supply sources, among other factors.
Figure 3: Change in cumulative costs from the baseline due to regional trade over the 2015- 2040 period (Billion US$)
4.4 Cross-Border, Inter-Grid Transmission Links
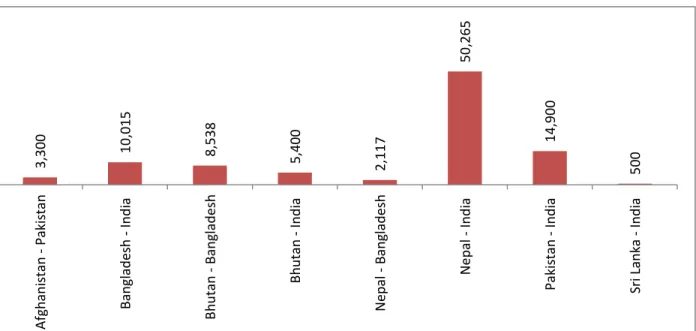
The full regional cooperation that allows unrestricted flow of electric power would require 95 GW
16of net additional transmission interconnection between the countries by 2040 (see Table 5 and Figure 4). The increased cross-border transmission interconnection capacities would however avoid 37 GW of interconnection that would have been built in the baseline to expand the interconnection of Northern India electricity grid with Eastern and Western India electricity grids.
This is because it would be more economical for the Northern Electricity Grid of India to import hydropower from Nepal than coal based power from the Eastern and Western electricity girds of India. When this is accounted for, the net expansion of cross-grid interconnection would be around 59 GW.
1716
Note that this number is different from the total number presented in Table 1, as this number does not account for the reduction in grid interconnections within India that would be avoided due to expanded cross-border electricity trading.
17
Note the difference between ‘cross-border’ and ‘cross-grid’ interconnections. The former refers to the interconnection between countries, while the latter refers to the interconnections between grids, including regional electricity grids within India.
16 6 22
‐119 ‐97
35 13 48
‐270
‐222 Investment
(Generation)
Investment
(Interconnection) Total Investment Fuel Costs Net Savings
Discounted Undiscounted
Table 5: Grid Interconnection Capacity by 2040 (Grid Level)
Grid- Interconnection Capacity (MW)
Change in capacity from the baseline (MW) Baseline Regional Grid Regional Grid Afghanistan - Pakistan 2,300 5,600 3,300 Bangladesh - India North East 0 9,115 9,115 Bangladesh - India East 500 1,400 900 Bhutan - India North East 0 3,600 3,600
Bhutan - Bangladesh 0 8,538 8,538
Bhutan - India East 7,800 9,600 1,800 India East - India South 5,238 5,238 0 India East - India North East 1,636 1,636 0 India East - India North 26,078 7,178 -18,900 India West - India North 41,656 23,304 -18,352 India West - India East 7,810 7,810 0 India South - India West 9,777 10,677 900
Nepal - Bangladesh 0 2,117 2,117
Nepal - India East 1,050 2,850 1,800
Nepal - India North 75 48,540 48,465
Pakistan - India North 0 10,100 10,100
Pakistan - India West 0 4,800 4,800
Sri Lanka - India South 0 500 500
Total 103,920 162,603 58,683
Figure 4: Change in cross-border transmission interconnection capacity from the baseline in 2040 (MW) due to the full regional trading
3,300 10,015 8,538 5,400 2,117 50,265 14,900 500
Afghanistan ‐ Pakistan Bangladesh ‐ India Bhutan ‐ Bangladesh Bhutan ‐ India Nepal ‐ Bangladesh Nepal ‐ India Pakistan ‐ India Sri Lanka ‐ India
4.5 Inter-grid Power Flows
Table 6 presents changes from the baseline in cumulative flows of electric power across electricity grids and across country borders during the 2015-2040 period. The largest amount of electricity flow (3,566 TWh) goes from Nepal to the Northern Electricity Grid of India. As noted, this region is projected to have one of the fastest demand growth rates and is currently facing a huge shortage of electricity supply. The Northern Electricity Grid of India will import power from Nepal under the unrestricted cross-border trading scenario instead of from Eastern and Western grids of India, which would be case in the baseline.
More than 500 TWh of electricity (additional to that in the baseline) will flow from Bhutan to India (mostly to Eastern Electricity Grid) during the 2015-2040 period. Bangladesh imports around 1,800 TWh of electricity mostly from North East India and Bhutan. Pakistan imports from Western Grid of India and it exports to Northern Grid of India. Pakistan imports 348 TWh from Afghanistan during the 2015-2040 period.
Table 6: Change in the cumulative power flows between grids (countries) during the 2015- 2040 period (TWh)
Transmission Interconnection Flow of Electricity
Exports Imports Net Export
Afghanistan to Pakistan 348 -1 349
Bangladesh to India 126 1,124 -997
India North East 4 1,145 -1,141
India East 122 -21 144
Bhutan to Bangladesh 557 3 554
Bhutan to India 548 7 541
India North East 344 7 337
India East 204 0 204
India East to India South 200 -19 219
India North East to India East -87 -23 -64
India North to India East 0 -1,641 1,641
India North to India West 0 -2,117 2,117
India West to India East -7 7 -14
India West to India South 322 2 321
Nepal to Bangladesh 66 46 20
Nepal to India 3,528 28 3,500
India East 53 28 25
India North 3,475 0 3,475
Pakistan to India 300 397 -97
India North 282 67 214
India West 18 330 -312
Sri Lanka to India South 34 28 6
Regional coordination also would cause a huge change in inter-grid power flow within
India relative to what would have happened in the baseline. While the flow of power from Eastern
and Western grids to the Southern Grid increases, the flow from Eastern and Western Grids to
Northern Grid drops by about a half. Note that the direction of flow could change hourly, daily or
seasonally depending upon the difference in marginal costs of electricity production between any two neighboring grids.
184.6 Power Sector CO
2Emissions and Other Environmental Impacts
Since the regional trade allows a massive substitution away from coal based power generation in India, Pakistan and Bangladesh toward hydro power from Nepal, Bhutan and Afghanistan, regional CO
2emissions from the power sector during the 2015-2040 period drop by 8% relative to the baseline. Figure 5 presents total CO
2emissions from the power sector in the region. Although India accounts for two-thirds of the total power sector CO
2emissions in the region, its percentage reduction accounts for 6.5%. In terms of percentage reduction, Bangladesh has the highest percentage, 32.8%. CO
2reductions in Afghanistan and Bhutan come mainly through the substitution of their diesel based electricity generation with that produced from renewable sources.
The replacement of more than 50GW of coal-fired investment with hydro capacity under regional cooperation and trade also suggests substantial potential improvements in local air quality, since coal plants are major sources of fine particulates and other pollutants that cause damages to human health and the environment. How much air quality would improve depends not only on where the capacity substitution takes place (e.g. Northern India grid area versus elsewhere), but also on the pollution characteristics of the coal capacity avoided (e.g. modern supercritical new plants, repowered subcritical plants). Assessment of the magnitudes of air quality improvements is a topic for further research. Nevertheless, given the urgency of air quality problems in much of South Asia, the significant reductions in local pollutants from expanded regional trade is an important benefit to recognize.
Figure 5: Change in total CO
2emissions due to the full regional trading over the 2015-2040 period, expressed in million tons and percentage
18