July 31, 2014
Note on Green Growth for Bhutan
Document of the World Bank
Public Disclosure AuthorizedPublic Disclosure AuthorizedPublic Disclosure AuthorizedPublic Disclosure Authorized
90413
1
Table of Contents
Introduction: What is the role for “green growth” in Bhutan? ... 5
Hydropower ... 9
Forestry ... 14
Agriculture ... 18
Mining and Manufacturing ... 22
Tourism ... 27
Urbanization, Transportation and Environmental Challenges ... 29
Conclusions ... 32
Bibliography ... 35
Annex 1 –Funding for Climate Change and Environment ... i
List of Boxes
Box 1: Bhutan’s Macroeconomic Background ... 7Box 2: Promoting Environmentally and Social Responsible Hydropower Development in Himachal Pradesh ... 11
Box 3: Forest Accounts: Why should countries compile these?... 16
Box 4: Forest accounts Guatemala ... 17
Box 5: Kegg Farms – A Better Backyard Chicken in India: innovation is key to green growth outcomes ... 20
Box 6: Conservation Agriculture ... 20
Box 7: China’s Sloping Lands Conversion Program ... 21
Box 8: Calculating Adjusted Net Savings ... 24
Box 9: Nature-based Tourism at Addo Elephant National Park in Eastern Cape Province of South Africa ... 28
Box 10: Greener Way – waste management and recycling company in Bhutan. ... 31
Box 11: Gross National Happiness ... 34
List of Figures
Figure 1: GDP by Sector ... 8Figure 2: Contribution of Electricity & Water Supply in Total GDP ... 9
Figure 3: Share of Hydropower in Total Export Earnings ... 9
Figure 4: Adjusted Net Savings: Resource-rich Countries by Income Group ... 23
Figure 5: Adjusted Net Savings: Bhutan and Other Lower Middle Income Countries ... 24
2 Figure 6: Calculating Adjusted Net Savings ... 24 Figure 7: Mean Happiness by Dzongkhag ... 34
3 Glossary
ANS Adjusted net savings
BRT Bus-Rapid-Transit
CPS Country partnership strategy DOA Department of Agriculture DPL Development policy loans
FAO Food and agriculture organization
FDI Foreign investment
FYP Five Year Plan
GHG Greenhouse gas
GLOF Glacier lake outburst floods
GoI Government of India
HP Himachal Pradesh
MICE Meeting, incentive, convention and event RGoB Royal Government of Bhutan
RNR Renewable Natural Resources
RSTA Road Safety and Transport Authority of Bhutan SLCP Sloping Land Conversion Program
SYB Statistical Yearbook
4 Acknowledgements
This report was written by a lead team comprising of Urvashi Narain, Michael Toman, and Zhiyun Jiang, with sectoral inputs from Winston Dawes (Agriculture), William B. Magrath (Forestry), Martin Lokanc (Mining), Rohit Mittal and Pyush Dogra (Hydropower), Shenhua Wang (Urban), Poonam Pillai, Abedalrazq Khalil, and Pravin Karki (climate change). Herbert Acquay and Marinela Dado provided strategic guidance and the report builds on an earlier Note on Green Growth in Bhutan by Aziz Bouzaher. The report also benefitted from comments from Genevieve Boyreau and stakeholders at a consultation workshop held in Thimphu on May 26, 2014, and from three peer reviewers – Richard Damania, Christian Peters, and Cary Anne Cadman.
5 Introduction: What is the role for “green growth” in Bhutan?
Bhutan has recently made significant progress in sustaining economic growth and reducing poverty. In 2012, average per capita household income was somewhat under USD 2,400/year (Living Standards Measurement Surveys 2012). Growth has averaged around 9% per annum over the past decade and is expected to be on the order of 8% per annum over the next five years. According to the 2012 Bhutan Poverty Analysis, 12% of the population are what is known as “consumption poor”, half the number as compared to 2007. Furthermore, extreme poverty – defined as less than $1.25/day in PPP terms – has fallen to only 2% of the total population. Bhutan has virtually eliminated extreme poverty within the living memory of one generation.
Bhutan’s population remains rural to a significant extent. According to a 2005 population census, 69% of the population lived in rural areas. And there remain significant income differences between urban and rural areas; average per capita household income in rural areas is estimated to be 28,000 Nu against 80,000 Nu in urban areas. There is, though, significant ongoing migration to population centers in search of increased opportunities. The 2005 urban population share of 31% of total population represents a substantial increase from only 5% in 1995.
Natural resource-dependent sectors play an important role in Bhutan’s GDP. Agriculture, livestock & forestry1 account for 13.4% of GDP. The importance of agriculture in GDP is
consistent with the continued high level of rural population, and it continues to be the sector that employs the majority of Bhutanese. However, annual growth in agricultural net output has been fairly low. It has been estimated that activity in hydropower directly contributes 12.5% of GDP, and up to 30% if one includes indirect impacts including construction. The contribution of hydropower to the economy is expected to grow over time as Bhutan faces increasing demands for hydropower exports to other countries in the region, and Bhutan still has significant uptapped potential. However, employment generation in the hydropower sector inherently is low. Bhutan also has valuable deposits of primary materials including dolomite, lime stone, gypsum,
quartzite, stone, and marble, which are useful for fabrication of other materials. However, its manufacturing sector is very small, consisting mainly of ferro-silicon processing using inexpensive energy. Finally, the tourism sector, much of the demand for which comes from Bhutan’s pristine natural environment, is becoming a more important contributor to export revenues in recent years. Thus, a significant part of Bhutan’s current and prospective economic gains come from use of natural resources – that is to say, “green” sectors.
Moreover, it can be said that green growth is at the heart of Bhutan’s development philosophy. Under its Constitution, at least 60% of the land area of the country must remain forested. In 2010, about 70.5% of the land was defined as under forest cover. The country’s Constitution (Article 5) and development plans over the years, including the recent 11th Five Year Plan, for example, also commit the Government to “… secure ecologically-balanced sustainable development.” Moreover, the country’s current Economic Development Policy incorporates several aspects of a green growth agenda, including:
1 Together these sectors are called the Renewable Natural Resources sector.
6
A continued focus on hydroelectricity, forestry, high-end/low-impact tourism, and agriculture as strategic sectors.
A move towards banning agro-chemicals, and promoting export-oriented organic agricultural products.
The promotion of environmentally friendly businesses and foreign investment (FDI) through green incentives (e.g., rebates in taxes and custom duties), and support for services in the areas of health, education, financial services, and tourism.
A decision to make Bhutan carbon neutral, whereby the country’s total emissions would not exceed the sink capacity provided by the policy-mandated 60% forest cover.
However, Bhutan also faces several ongoing development challenges. These include:
Large macroeconomic imbalances created by hydro-power-led development as well as risks from dependence on a single buyer, India.
Raising youth unemployment in part because the hydropower sector does not generate jobs commensurate to its revenue generating potential, but also other constraints to diversifying the economy, including limited transport and other infrastructure,
complications in maintaining supply chains given its topography, skilled labor shortage, lack of financial capital, institutional barriers to new business development and small market scale.
Fragmentation of agricultural land and stagnant or declining productivity.
Increasing vulnerability to climate change particularly in the hydropower sector, the sector that is driving and will continue to drive economic growth.
Persistence of human-wildlife conflicts, but also increasing tensions between siting infrastructure while maintaining Bhutan’s forest cover.
Rapid urbanization, which is straining municipal service provision and resulting in increased pollution with negative impacts on health, and raising concerns with the environmental performance of the mining sector.
The basic message in this Note is that Bhutan starts from a solid base in terms of green growth, with additional opportunities for meeting its development goals and overcoming the abovementioned challenges on the basis of its natural resource endowment. 2 However, realizing those opportunities and meeting those challenges will require focusing on the economic
contribution from sustainable use of those natural resources, in addition to conservation of the environment. It will also require complementary measures, using the economic surplus (or as
2 Note that we are not claiming that green growth, as we have sketched it here, is necessarily “optimal” in a conventional sense of maximizing the present value of physical consumption. It is however an important point of departure for discussing how Bhutan can make good use of its resource endowments within the framework set by its development philosophy.
7 economists refer to it, “rent”) from sustainable natural resource use to help diversify economic activity and address institutional and other constraints.
A traditional macroeconomic growth narrative sees green growth as a general call for increasing productivity, based on comparative advantages in natural resource use, and expanding different forms of capital investment to support economic growth, while maintaining safeguards to manage and reduce risks to the natural environment. A more comprehensive view of green growth emphasizes sustainable use of “natural capital,”3 along with managing environmental risks cost-effectively and in an institutionally sound manner to limit risks to human health and of irreversible degradation of the natural environment. In this context, green growth needs to balance conservation with sustainable economic use of all resources to meet the needs of the present, and maintain opportunities for the future. The need is to balance economic growth opportunities with quality of life goals, including environmental norms.
Building on these general observations regarding green growth, the Note takes stock of potential green growth opportunities in several sectors in the economy of Bhutan, as well as some cross-cutting environmental issues. Our discussions of the various sectors do not reflect detailed sector diagnostics, which are beyond our scope; nor do they provide specific prescriptive statements on policies Bhutan should adopt. Nor does the content of the Note reflect an in-depth analysis of how particular green growth possibilities would contribute to inclusive growth and poverty reduction; such a macro-level is also beyond our scope. The note touches upon issues of inclusion where possible but not in a systematic and comprehensive manner. Instead, the
purpose of the Note is to provide food for thought in ongoing discussion of growth strategies for Bhutan, and how green growth ideas may contribute to that discussion. The sector discussions include examples of successful efforts in other places for sustainably increasing the economic return from natural capital and efficient management of environmental risks, as experiences from other countries for Bhutan to consider in its deliberations of options and challenges. At the end of each section we provide suggestions for next steps, drawing on the discussions at the
stakeholder consultations in Thimphu in May 2014, to inform the on-going dialogue between the Royal Government of Bhutan and the World Bank on these issues.
3 Natural capital refers to the stock of natural resources that provide flows of valuable goods and services. Major types of natural capital include agricultural lands; subsoil assets (oil, gas, coal, and minerals); forests; water;
fisheries; and the atmosphere.
Box 1: Bhutan’s Macroeconomic Background
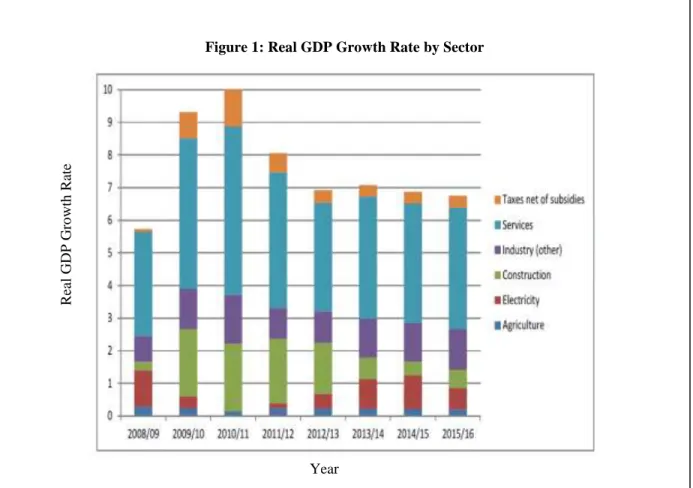
The figure below shows the breakdown of GDP growth rate by sector over the past five years and the same breakdown projected into the near-term future. Agriculture, manufacturing and mining sectors have grown at consistent rates over time: agriculture at a low 2 percent, manufacturing and mining maintained growth close to 12 percent.
With 75 percent of Bhutan’s imports coming from India and an exchange rate at par with the Indian rupee, Bhutan’s consumer inflation is intimately linked to India’s inflation. Food and beverages have the heaviest weighting in Bhutan's consumer price index, at 36.9 percentage points, and since most are imported from India, they will continue to have the strongest impact on overall inflation.
8
Figure 1: Real GDP Growth Rate by Sector
Bhutan’s current account deficit stands at about 25 percent of GDP, of which 10 percent are imports related to the hydro sector. Exports of minerals and mineral-based products account for more than half of total exports, with hydropower exports comprising a further 45 percent, and manufactured products a tiny 5 percent. India purchases almost 90 percent of Bhutanese electricity production. The tourism sector is becoming a more important contributor to export revenues in recent years. Tourism revenues are 20 percent of non-hydro exports.
International reserves amounted US$920.8 million by end-November 2013, 88 percent of which was in convertible foreign exchange, with the rest in Indian rupees (or 13 months of merchandise imports). External debt is denominated in Indian rupees and is related to hydropower sector debt, which accounts for 61 percent of total external debt, with convertible currency debt accounting for 29 percent of GDP.
Donor grants and loans finance about 40% of the annual budget. Bhutan’s public and publicly guaranteed external debt was 85 percent of GDP by end-FY12/13, up from 71 percent of GDP the previous year. The rise in the external public debt was driven in large part by hydro sector-related external borrowing (52 percent of GDP).
While total unemployment remains low at 2.9% (2013), youth unemployment was 9.6% in 2013 and is on the rise. In addition, there is evidence that underemployment is large, especially in rural areas. Hydropower directly contributes to 2 percent of total employment, whereas the majority of the population is still in agriculture, mostly subsistence, and the rest in services.
Source: Bhutan National Statistical Bureau
Real GDP Growth Rate
Year
9 Hydropower
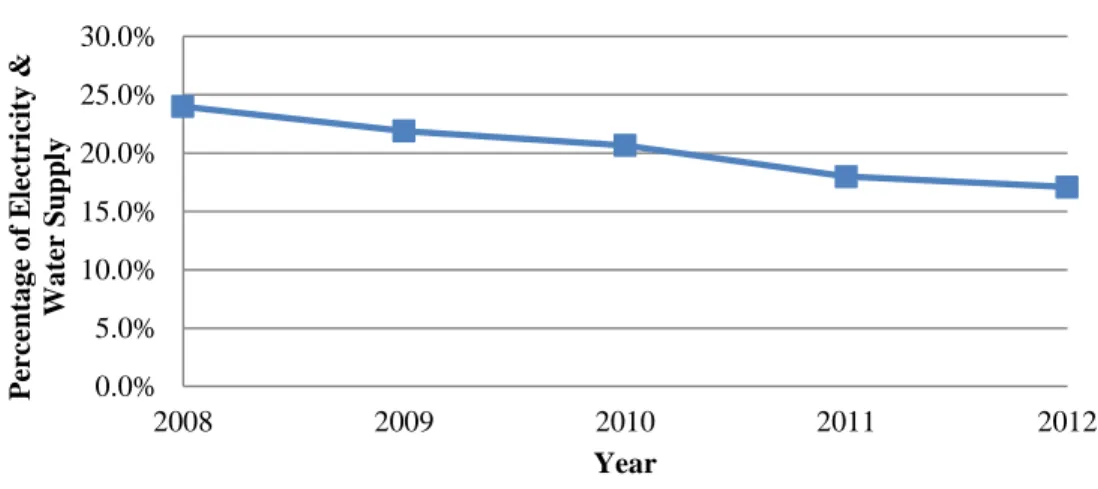
Hydropower is one of the most important economic sectors in Bhutan, both as the main supplier of electricity4 and as a major contributor to GDP (see figure 1). In 2012, the electricity
& water supply sector contributed 17.1% of total GDP. Moreover, due to the commissioning of the Tala hydropower plant in 2006-07, the biggest in the country with an installed capacity of 1020 MW, real GDP growth increased to 21.4% in 2007 from 8.5% in 2006, with 17.2% of the 21.4% coming from the electricity sub-sector alone (Economic Development Policy, 2010). The sector is also an important foreign exchange earner for the country (see figure 2). In 2012, Bhutan exported 4924 MU of electricity to India and imported 36.75 MU (SYB, 2013).5
Figure 2: Contribution of Electricity & Water Supply in Total GDP
Source: Statistical Yearbook of Bhutan, 2013 Note: GDP is expressed in constant prices.
Figure 3: Share of Hydropower in Total Export Earnings
Source: Statistical Year Book of Bhutan, 2013
Note: The share is likely underestimated as the hydropower export only includes Chhukha, Tala and Kurichu hydropower facilities.
4 Diesel is also used to generate electricity but its share in the total is negligible.
5 Hydropower facilities are run-of-the-river and therefore subject to high seasonal variability. This gives rise to the need for Bhutan to import power from India in the dry season.
0.0%
5.0%
10.0%
15.0%
20.0%
25.0%
30.0%
2008 2009 2010 2011 2012
Percentage of Electricity & Water Supply
Year
0.0%
10.0%
20.0%
30.0%
40.0%
50.0%
60.0%
2008 2009 2010 2011 2012
Percentage of Hydropower Export
Year
10 In 2012, the installed hydropower capacity in the country was 1,488 MW, about 5% of the total potential (11th FYP) of 23,760 MW. Bhutan plans to increase hydropower capacity to 4,546 MW and small hydropower plants capacity from 8,000 kw to 20,000 kw under the 11th FYP, and to reach 10,000 MW hydropower capacity by 2020.
Expansion of the hydropower sector will help contribute to revenue generation and economic growth. Expansion of this sector also promotes green growth in its broader sense as it allows Bhutan to increase the economic contribution of natural capital, in this case water and forests, sustainably while helping to displace dirtier forms of energy.
To realize its potential though the sector will have to overcome the challenges it faces.
Because of high upfront investment costs, it is a challenge to raise financing for these projects.
The Umbrella Agreement of 2006 and Protocol to the 2006 agreement with the Government of India helps to reduce this challenge. Meeting growing demand by households and industries, balancing domestic consumption and export earnings, and electricity cost and tariff levels are also other challenges, which will be relieved when new hydropower projects are commissioned.
Large macroeconomic imbalances created by the sector also call for strong fiscal policy measures.
Furthermore, though the sector has reduced its environmental footprint and social
disruptions with run-of-the-river facilities, further efforts to address the social and environmental challenges of large-scale hydropower expansion will help increase the efficacy of the
hydropower facilities, as well as making growth in this sector greener and more inclusive.
Managing watersheds in the catchment of hydropower facilities to maximize soil retention and water regulation services of forests, for example, will help increase the productivity of the hydropower facilities.
The hydropower sector also faces challenges due to climate change that are likely to be exacerbated in the future. Climate change assessments suggest that there is an increasing trend of precipitation-related climatic extremes in the region and Bhutan is projected to receive higher monsoon and post-monsoon precipitation. Between 1990 and 2009, glacial lakes in the
Bhutanese Himalayas grew at 25-45 Ha/yr (Gardelle et al, 2010) and are likely to grow further due to temperature increases caused by climate change, leading to a threat of glacial lake
outburst floods (GLOF). These findings lay risk to the hydropower sector. The projected increase in monsoon rainfall and rainfall extremes is expected to lead to additional sediment flow in already high-sediment rivers and thus to reduce live storage and turbine life of hydropower plants. GLOFs could damage or wash away small hydropower plants, and affect long-term viability of hydropower projects that are on rivers fed by glacial lakes.
Countries with similar potential for hydropower generation, but that face the threat of climate change, are starting to realize it through a combination of innovative policies and tools, including (also see Box 2: Promoting Environmentally and Socially Responsible Hydropower Development in Himachal Pradesh).
Basin-wide scientific studies (also known as sectoral environmental assessments) to assess the cumulative impact of the development of hydropower projects in a cascade along the same river basin, to assess the efficacy of the different projects, the need for environmental flows downstream of the diversion structure to sustain ecosystem services
11 particularly during the lean season, and to assess environmental impacts to prepare and implement catchment area treatment plans at the basin level to manage soil erosion and ensure water regulation.
Tools to assess the value of soil retention and water regulation services of forests in the catchment of hydropower facilities, to enable more efficient watershed conservation investment design to improve sediment management and design of payment for ecosystem service schemes. Implementation of new planning processes and incentive schemes based on these assessments.
Adoption and implementation of national policies on environmental flow to ensure adequate river flows, based on the basin-wide assessments.
Strengthening the capacity of the regulatory agencies to assess and monitor the environmental impacts (including monitoring e-flows) of hydropower projects and to ensure compliance of the rules and regulations by the developers. The regulatory agencies also need to be able to look at whether suitable planning and monitoring mechanism are available to ensure safe disposal of construction debris (i.e. muck).
Development and adoption of benefit sharing mechanisms (such as annuity benefit sharing, making power available in the project zone) to ensure that communities
negatively impacted by the hydropower facilities are adequately compensated, but also to ensure that the revenues generated support shared prosperity goals, economic
diversification, and sustainable growth.
Assessments of the potential impact of climate change on the hydropower sector and based on these, adjustments to the design of hydropower facilities to make them more climate resilient.
Box 2: Promoting Environmentally and Social Responsible Hydropower Development in Himachal Pradesh
Background: Himachal Pradesh (HP) is richly endowed with natural resources that provide economically valuable environmental services for much of the country. The state is home to three major river basins, and serves as a watershed that is critical to the livelihoods of more than 200 million people in Haryana, Punjab, Uttar Pradesh, and Rajasthan. It has one of the main sources of clean energy – hydropower - for the country that can help address both the energy and peak shortages of the Northern Region.
Government of India (GoI) sought a program of two DPLs to implement enabling policies, institutional actions and piloting of innovative practices to achieve inclusive green growth in the state of Himachal Pradesh:
Adoption of environmentally sustainable and socially responsible hydropower development in the ongoing hydro development program;
Integration of climate change adaptation and mitigation actions in policies and programs;
Empowering local communities to promote watershed management;
Promotion of an environmentally sustainable industrial development;
Implement an environmentally sustainable tourism program;
Instituting mechanisms for integration of spatial GIS based information in informed decision making.
Hydro Power Development Goal of DPL: In one of the pillar of the DPL operation, efforts have been
12 Given the low population density in Bhutan, and the migration out of rural areas, areas where hydropower plants are likely to be located, expansion of the hydropower sector is not likely to result in as large social or environmental impacts as would be felt in areas with higher population densities. Nonetheless, silt management in the upper catchment and ensuring
sufficient e-flows downstream of the facility will still be important concerns, as will be concerns about the efficacy of individual projects. Furthermore, silt management will become more and more important as the country addresses its infrastructure deficit and builds roads to improve connectivity, given that road construction is one of the major contributors to increased sediment flow in rivers. A portion of the hydropower payments that Bhutan receives are earmarked for ecosystem protection, but recently those funds have been diverted to use for increasing “lifeline”
electricity subsidies. This shift has implications for the environment. There may also be other environmental and social concerns, but identifying these would require further analysis.
Additionally, sector-specific policies may also be needed to make the hydropower sector more climate-resilient. To ensure reliable supply of water, there is likely be a need to increase reservoir storage to combat increased hydrologic variability from climate change. Shifting to reservoir based facilities rather than run-of-the-river will however increase the potential environmental impacts and these will then have to be managed. Sedimentation management technologies will also need to be implemented, both in the catchment of the hydropower facility and within the facility to manage the impacts of climate change. These efforts will ensure that the hydropower sector contributes to economic growth today and in the future.
Given that Bhutan will continue to receive substantial and even growing revenues from hydropower in the future, it is important to consider how the country will manage these
revenues, particularly to promote shared prosperity, and long-term development. Bhutan needs to carefully consider how far to go with “lifeline” electricity subsidies, since these leave less
available for investments in growth-enhancing activities (or, as noted above, to reduction in expenditures for ecosystem protection). More generally, Bhutan needs to consider how to use its hydropower revenues for advancing economic diversification and employment enhancement activities. The more that is spent on privately or publicly provided (nontradable) services, or
made to increase adoption of environmental and social parameters in hydropower development. Various important initiatives adopted in hydro sector are:
GoHP has designed, adopted and implemented a web-based real-time monitoring system for project milestones, including those relating to environment and social parameters and environmental flows.
GoHP has (i) carried out a cumulative environmental impact assessment study of the Satluj river basin; and (ii) developed a concurrent action plan. It has also initiated cumulative impact assessments across all rivers of the state.
A basin –wide catchment area plan has been developed for Satluj basin and similar plans are in progress along all river basins.
GoHP has adopted and implemented a benefit sharing scheme to complement the Local Area Development Fund, by initiating the payment of cash transfers to eligible beneficiaries.
A communication strategy to disseminate hydro power development road map amongst the stakeholders has been developed.
Technical studies on (a) institutional management of in stream flow, (b) InVEST Model to monitor performance management of catchments are also in progress to support the decision making and planning policy reforms.
Source: World Bank Staff
13 imported goods, the lower is the volume of savings for increasing various forms of durable capital (and the costlier is labor in other potential export-oriented sectors). There is thus a degree of tradeoff in how Bhutan wants to see its economy further develop in terms of growth in labor- absorbing services and other sectors like manufacturing. While further hydro development will generate resource rents, the extent to which these rents stimulate further growth will depend on the policies for their use.
To summarize, the hydropower sector is and will continue to be one of the most important economic sectors in Bhutan. To support this sector and deal with the challenges it faces, there is a need to articulate and adopt a policy on hydropower revenue use and revenue sharing to ensure that revenues are used to promote growth and shared prosperity in a manner that is sustainable. Furthermore, development of capacity to use tools to manage watersheds to maximize the flow of ecosystem services, in particular soil retention and water regulation services, such as ecosystem accounting, watershed investment prioritization tools, etc., will also be important. This will help manage the current issues with silt as well as potential issues that will arise due to infrastructure development and climate change. Finally, it will be useful to examine the potential role of payment for ecosystem schemes to meet both revenue sharing objectives and to deliver ecosystem services.
14 Forestry
Forests are an important natural resource in Bhutan. The Constitution of Bhutan
stipulates that the country maintain a “minimum of 60% of the total land under forest cover for all times to come”. In 2010, in fact, forests accounted for 70.5% of the total land area, and an additional 10.4% was under shrubs (SYB, 2013). Broadleaf and mixed conifer forests are the major forest types. However, only about 14% the forest lands are economically accessible and available for production of commercial timber (National Forest Policy of Bhutan, 2010).
As a share of GDP the forestry and logging sector accounted for only 3.1% in 2012, however. This figure though does not represent the importance of the sector in the livelihoods of the poor: rural people strongly rely on forests for subsistence goods, including fuel wood, non- wood forest products (NWFP), construction timber, etc. In Bhutan, firewood constitutes about 57% of total energy consumption. Households account for 95 % of total fuelwood consumption, while the government, commercial sector and industry consume the balance (Uddin et al. 2006).
Between July 2008 and June 2011, about 160,000 cubic meters of firewood have been supplied at subsidized rate to rural communities. During the same period, the entire commercial firewood production of the country stood at about 100,000 cubic meters. Apart from firewood, data from 2007/08 show that stones and sand are the most important NWFPs followed woodchips, bamboo, resin, and cordycep. And many of these uses of the forests are often not fully reflected in the national account estimates.
Though deforestation is not considered to be a major problem in Bhutan, urban expansion and the establishment of new infrastructures such as roads and hydropower projects have had an effect on forests. Over 8,900 ha of Government Reserve Forests (GRFs) land was allotted for such activities by the Department of Forest and Park Services (DoFPS) between FY 08/09 and FY 10/11, with an increasing trend. Forest fires also contribute to deforestation. Records show about 62 forest fire incidences annually in the last 15 years, leading to damage of approximately 18,188.23 acres of forest lands per year. Another potential challenge, and one that is particularly relevant for promoting green growth in this sector, is low productivity. Surprisingly, wood charcoal was one of the top ten commodities imported into the country from 2008 to 2012, despite the large areas under forests in the country. Aside from productivity differences, this appears in part to reflect reluctance to accept the nearby presence of charcoal kilns.
Under the 11th FYP, Bhutan hopes to overcome some of these challenges and manage its forest resources for supplying economic goods and services through the establishment of Forest Management Units (FMU), Working Schemes (WS), Community Forests (CF), plantations and NWFP user groups. The numbers of CFs in particular are to be increased to help empower rural communities to manage forests sustainably and achieve poverty reduction (Royal Government of Bhutan, 2010a). The 11th FYP also emphasizes biodiversity conservation and the maintenance of ecosystem services through protected area management, watershed management and wildlife management. Bhutan is also conducting REDD+ readiness activities, and hopes to be ready for implementing REDD+ activities by the end of the 11th FYP by which time it is hoped that there will be clarity on the availability of global funds to support these activities.
As with other sectors, these policies will help make growth green and inclusive. Another crucial element of promoting green growth in renewable resource sectors such as forests is to
15 ensure that the resource is managed to enhance productivity and prevent resource rent
dissipation, given its common property nature. A package of measures is often needed to realize green growth outcomes: to reap higher and sustainable economic returns from natural forests, for example, requires aligning policies, incentives, capacity, and governance. Enforcing access rights to avoid over-exploitation given the open access nature of forests, for example, will be as important as developing markets for forest products.
Another issue to consider is access to and pricing of extracted wood. As noted above, substantial quantities of firewood are provided with subsidies. Firewood is regulated by Forest and Nature Conservation Rules of Bhutan 2006. The Rule specifies that households are allowed 16 m3 of fuelwood per year if they lack electricity or 8 m3/year if they have electricity,
irrespective of household size, need, forest type, availability. Households also have entitlements to certain amount of timber for construction. The free provision of wood to individuals arguably holds back the development of more specialized and efficient sources of building materials.
At the same time there is strong need for more accurate economic valuation of the services provided by forests (such as water regulation, soil retention) to improve decision making. For instance, market prices do not accurately reflect the value of ecosystem services because of their public good characteristic: they are often one or both of the “non-excludable and non-rival” pair. Market prices are often missing for many services because these services are invisible. Improving the understanding of the economic value of ecosystem services, particularly non-provisioning services, and making these values explicit in measures of economic growth can inform policies to increase the economic contribution of forests to economic growth sustainably.
Countries rich in forest resources are relying on a number of policies and tools to achieve inclusive green growth in this sector, including,
To support sustainable forest management, a number of countries are strengthening their capacity to collect, compile, and analyze forest-related data, including forest inventories, forest cover maps, and forest accounts. Forest accounts (see Box: Forest Accounts: Why should countries compile these?) in particular allow policymakers to understand the current contribution that forests are making to the economy, accounting for the full range of goods and services generated by forests, and how this contribution can be increased sustainably.
Countries are also strengthening capacity for management, developing working plans, and for governance by strengthening the role of local communities to ensure that access to forest resources is regulated.
Finally, countries are increasing sustainable value added from a range of goods and services from the sector, not only timber, by supporting value chains for important NWFPs, designing and implementing payment for ecosystem services schemes to
monetize what are otherwise non-marketed regulating services and providing an incentive for their provision, etc. Moving up the value chain, shifting from extraction alone to downstream processing, can help provide additional, more productive jobs, though such
“industrial” policies may not always be in the country’s comparative advantage and would need to be justified on a case by case basis.
16 To summarize, given the extent of forests in Bhutan, it is important to understand how this natural asset can contribute to the country’s economic growth without compromising Bhutan’s commitment to maintaining 60% of its land permanently under forest cover. Forest accounts can help make clear the contribution that forests make to the economy, including the contribution to the hydropower power sector through the provision of ecosystem services such as water regulation and soil retention, the contribution to the tourism sector, and to rural
livelihoods. Building on data provided by forest accounts, but based on in-depth assessment of institutions, policies, regulations, etc., targeted analytical studies can help assess how the
contribution of the forestry sector to the economy can be increased in a sustainable manner. This should include an analysis of issues such as (i) the economics of wood charcoal: Should a
Box 3: Forest Accounts: Why should countries compile these?
Forests are an important natural asset for a number of countries, and provide a range of critical goods and services that are important to the economy. Goods and services range from provisioning services such as timber, firewood, and a variety of non-timber forest products, to cultural services such as recreation and tourism, to regulating services such as water regulation, soil protection, biodiversity protection, and carbon storage. These goods and services benefit the economy directly but also by supporting other economic sectors such as hydropower (through water regulating and soil retention services), and tourism (by supporting eco-tourism).
Yet, policymakers do not have the information they need to manage this important economic asset. This includes information not only about the extent of forest resources and how it is changing, but equally importantly information about the economic contribution of forests and impacts of non-forestry policies on forest resources and services.
Countries rely on the System of National Accounts (SNA) to provide detailed information about the economy to help policymakers assess economic performance, support policy analysis, and inform decision-making. The SNA, however, has a number of shortcomings when it comes to the environment in general and forest in particular, limiting its usefulness as a source of information for forest management. For one, the SNA treats cultivated and natural forests differently. For cultivated forests it records production and changes in the stock while for natural forests it only records production. The value of forest degradation and depletion is not recorded as a cost against the income earned by enterprises (be it state or private) extracting forest resources. More importantly, a number of non- market goods and services provided by both cultivated and natural forests are often not included in national
accounts. Or many non-market services are wrongly attributed to other sectors of the economy.
Because existing state accounts do not fully capture the economic contribution of forests, total benefits from sustainable forestry are underestimated and other sectors are not fully aware of their dependence on healthy forests.
These factors are likely to bias decisions away from sustainable management of forests and prevent policymakers from fully leveraging forest resources to realize their contribution to economic growth.
Forest Accounting, that is compilation of detailed statistics (using a framework like the System of National Accounts) to help monitor the interactions between the state of forest resources and the state of the economy, can help fill this information gap. Applications of these accounts can help inform policies on how the economic contribution of forests to the state economy can be maximized. Forest accounts linked with tourism accounts, for example, can help inform government policy on nature-based tourism, and ecosystem accounts for watersheds can help design payment for ecosystem services schemes.
Source: World Bank Staff
Source: World Bank Staff
17 country as rich in forest cover as Bhutan import wood charcoal? What trade-offs are inherent in such a policy? Can this policy be justified on economic grounds within the current policy
framework? (ii) the potential impacts of the current timber allocation policy on development of a furniture industry in Bhutan: Under the prevailing forest management practices, households in rural areas are allocated a certain amount of timber for house construction at subsidized rates.
Does this allocation system lead to market fragmentation and through it to a lack of development of the furniture industry in the country?
Box 4: Forest accounts Guatemala
Guatemala is a small, culturally-rich Central American country that houses a tremendous quantity of biodiversity and abundant forest resources. Like many resource-rich developing countries, Guatemala is faced with the challenge of managing its resources in a sustainable manner. A crucial step in managing resources and designing effective policies has been to accurately measure assets particularly forests.
Prior to the compilation of the forest accounts, the National Forest Policy of Guatemala incentivized the
development of a plantation silviculture industry and attempted to protect strategic forest ecosystems. As a result of the development of forest accounts, researchers have been able to model the impacts of the national incentive program, PINFOR, and have concluded that large-scale timber industries does not provide the most value-added to the Guatemalan economy. As such, the accounts have informed the policy dialogue of how to continue PINFOR in a sustainable way after it is scheduled to end in 2016.
In addition, data from the accounts allowed researchers to conduct a study on fuel wood consumption. As a result of the study, a strategy for the production and efficient use of fuel wood is currently being developed. Although this strategy is in the initial phases, the accounts have informed the debate and are being used to develop initial drafts of the strategy. The development of strategies to efficiently use fuel wood and stop illegal logging will help Guatemala manageforest resources to contribute to the economic growth of the country while maintaining forest productivity and other environmental and community services that forests provide.
Source: World Bank Staff
18 Agriculture
Agriculture is an important economic sector in Bhutan, particularly as a source of livelihood for the rural poor. Even though only 2.9% of the land area in Bhutan is classified as agricultural (SYB 2013), the share of the sector in GDP stood at 6.4% in 2012 and it provided employment to over 60% of the total population (NLFS, 2011). Paddy, maize, apple, oranges, and potatoes are the major crops and cattle and poultry the major livestock. Moreover, agricultural commodities --- cardamom, potatoes, orange, apple and wheat/barley --- accounted for 4.3% of exports (RNR Sector 11th Plan) in 2011. Given the limited availability of land for cultivation but also predominance of subsistence farming, 60% of cereal, vegetables and animal products and 95% of fruits and nuts are domestically produced while 97% of fish, 80% of beef, 77% of pork, and 90% of oils and fats demands are met from imports (Labor Force Survey, 2012). Meeting a greater share of the demand through local production, increasing self- sufficiency in food production, is an important goal for the country under the 11th FYP.
The sector grew from 2009 to 2012, though slowly, and faces a number of challenges.
Studies indicate that yield per hectare has been on the decline at a compound annual rate of 1.84% over the last 27 years (11th Five Year Plan). Inadequate farmer labor is considered a constraint because of out-migration in rural areas. This is compounded by inadequate access to markets due to limited number of farm road linkages. Lack of irrigation is another constraint:
agriculture is still dominated by rain-fed dryland farming. With 31% of the agricultural land located on slopes more than 50°, soil erosion rate is high and estimated to be approximately 3.5 t/acres (DOA, 2011). Moreover, there are various pest and diseases and it is estimated that annually crop loss to wild animal invasion accounts from 0.3 to 18% of total household income (RNR Sector 11th Plan).
The RGoB is developing strategies to meet a number of these challenges, especially through the 11th Five Year Plan. Bhutan aims to shift from subsistence to commercial farming, and develop agri-business enterprises to increase rural livelihoods and facilitate economic growth. Mechanization will be promoted to help address labor shortages, and large scale irrigation schemes will be developed and watershed management plans implemented to make water resource available. A comprehensive strategy to address human-wildlife conflict is also being developed and the country hopes to work towards ensuring sustainability when improving productivity, through soil and water conservation, natural resources restoration and appropriate farming systems.
These policies will support inclusive green growth in the sector, that is, help to increase productivity across land holdings of different sizes while addressing concerns of land degradation. Global experience on inclusive green growth in this sector though shows frequent tradeoffs between increases in productivity and greener outcomes (be it cleaner air, cleaner water, less solid waste, and more biodiversity), and often between increases in productivity and more equitable growth (with larger farms or production facilities sometimes seen as necessary for productivity increases). However, these tradeoffs are often not inevitable and can also be minimized: innovation, which can in part be supported through smart subsidies, can for example help to overcome these tradeoffs. A good understanding of the tradeoffs at play is essential.
Some examples of green growth strategies in the agricultural sector are as follows:
19
Watershed management programs have been implemented in a number of countries in rainfed areas to increase agricultural productivity by controlling soil erosion, preventing siltation of water bodies, and improving the reliability of water resources. In effect, therefore, increasing agricultural productivity while promoting greener outcomes.
Experience from these programs shows the need for increasing efficiency in targeting investments and overcoming challenges such as weak delivery systems and capacities and inadequate monitoring systems. These challenges require strengthening institutions and human resources for more effective planning, implementation, monitoring and evaluation, and reporting of watershed management programs. The challenges also require the application of innovative, science-based knowledge, tools, and approaches to underpin improvements around watershed planning and implementation, agricultural intensification, rural livelihoods, and hydrology.
Promoting sustainable intensification of agriculture through increased use of fertilizers and pesticides and management of potential environmental impacts through regulations, have similarly allowed countries to increase productivity while managing tradeoffs with environmental outcomes. Intensification (with complementary policies to prevent extensification) can protect biodiversity, reduce deforestation, save water and reduce GHG emissions through “producing more with less”. Rice yields world over increased from 1.8 tons per ha to nearly 4.5 tons per ha from 1960 to 2010 for example, while the area planted with rice increased from 125 million ha to 150 million ha. To attain the same production increase with no growth in yields, the area planted with rice would have needed to increase to 300 million ha. However, intensification also contributes to both water and air pollution, including from runoff from excess nitrates and agrochemicals leading to the pollution of water bodies and soils. These impacts need to be managed.
Technological innovation plays a key role in green growth strategies for agriculture including development of varieties which include many improved characteristics, are drought resistant, require less fertilizer and are resistant to common pests and diseases, reducing requirements for pesticides. Technological innovation also allows for increasing productivity in the livestock sector, without trading-off equity or environmental outcomes (see Box on Kegg Farms – A Better Backyard Chicken in India: innovation is key to green growth outcomes).
Implementing payment for ecosystem services schemes to provide households the incentive to switch from crops to trees on sloping lands as was done in China under its Sloping Land Conversion Program (see Box on China’s Sloping Land Conversion Program) can help to reduce soil erosion. PES may not always achieve additionality, that is, result in environmental outcomes that would not otherwise have been achieved without the scheme, and this will require careful design. Schemes that provide payments to all landowners that are providing environmental services irrespective of whether these are additional are likely to have greater poverty reduction impacts and lower environmental outcomes, for example.
20
Conservation agriculture6 is another example of a green growth strategy applied to agricultural production. This agricultural practice simultaneously (i) yields environmental benefits (decreased nutrients pollution of waterways, increased carbon sequestration in soils), (ii) increases the efficiency of production (through a lower use of energy inputs) as well as its byproducts (such as biogas), (iii) increases resilience (through frequent rotations between crops), and (iv) increases agricultural productivity in the long run (through decreased erosion and enhanced soil structure). Hence, agricultural productivity and environmental quality appear to have a high degree of complementarity in conservation agriculture.7
Box 5: Kegg Farms – A Better Backyard Chicken in India: innovation is key to green growth outcomes Kegg Farms in India have bred a robust and improved dual purpose backyard chicken, called a Kuroiler, which lays 100 – 150 eggs per year (as opposed to around 40 for a Desi Chicken) and grows to 2 1/2 kilos in about half the time for a Desi chicken to reach one kilo. The company produces around 16 million day-old chicks. These are sold to 1,500 mother units who grow on the chicks for about two weeks before inoculating them and selling them to approximately 6,500 bicycle salesmen (pheriwallas) who on sell them to individual villagers mainly to women.
Sales are made to some 800,000 farmers, often located in some of the remotest part of the country. The turnover in sales of chicks is some $5 million a year with another $5 million turnover for the thousands of small rurally based businesses that grow on and sell the chicks.8
Independent assessment indicates that the average output generated per Kuroiler chick is $3.1 both as eggs and as meat, of which the cash generated amounts to about $2/chick. At some 16 million chicks distributed this would be an aggregate output of about $50 million, some $30 million cash generated and a cash profit of about $10 million.
Profits are significantly higher than raising desi bird. The Kuroiler birds bring more market orientation, contribute to significantly household cash flow, and as the enterprise has become more commercial, women have maintained control over the enterprises. Additionally, Kegg chickens typically obtain a premium over the typical broiler chickens as the meat is darker and more flavorsome (i.e. about Rs 60/kg). Kegg farms birds are spurring the development of a second small-scale poultry based business. About 25% of the birds are being sold to Peri-Urban farms concentrating on meat production. This proportion of the market is likely to increases.
The success of the system is built on the package of the superior performing birds – which are both robust and better able to scavenge food and have improved food conversion ratios coupled with the company’s business mode, with its devolved, rural based distribution system with in-built incentives.
Source: D. Isenberg. “Kegg farms: which came first? The Kegg or the Broiler?” Harvard Business Review Harvard Business Review 2006, and updated from World Poultry news 2008
6 The three main principles underpinning conservation agriculture are: (i) continuous minimum mechanical soil disturbance; (ii) permanent organic soil cover; and (iii) diversification of crop species grown in sequences and/or associations (Food and Agriculture Organization).
7 For a discussion on the implications of the degree of complementarity between agricultural productivity and environmental quality in production and consumption, see Lichtenberg, 2002.
8 D. Isenberg. “Kegg farms: which came first? The Kegg or the Broiler?” Harvard Business Review Harvard Business Review 2006, and updated from World Poultry news 2008
Box 6: Conservation Agriculture
Southern Province, Zambia: Conservation Agriculture (CA) approaches foster natural ecological processes to increase agricultural yields and sustainability. In Zambia, these involves six basic conservation farming technologies: retaining crop residues, concentrating tillage and fertilizer application in a permanent grid of planting basins or series of planting rows, completing land preparation in the dry season, weeding aggressively to reduce plant competition, and inter-cropping or rotating nitrogen fixing legumes on up to 30% of the cultivated area. Many farmers also incorporate nitrogen-fixing trees that also provide fodder and fuelwood. The area restored to date is 300,000 ha with over 160,000 participating households. Yields on farms using CA practices doubled in maize plots and were 60% higher for cotton, as compared to conventional plowing systems. An FAO (2010) budget analysis in Zambia found that returns under CA are significantly higher than under conventional systems: US$104/ha under CA and US$19/ha under conventional tillage.
Brazil has also adopted the approach, with technologies adapted to different regions. One approach supports a mixed livestock and crop system, rotating pastures with crops. The zero tillage system supplies residual nutrients for cheap pasture and the pasture phase reduces pests, weeds and diseases. . The most common rotations are a combination of soybeans, cotton and maize followed by one to three years of pasture. These practices have enabled higher pasture stocking rates and reduction of soil degradation and water runoff
Source: Scherr et al., (2011).
21 To summarize, to support Bhutan’s goal of increasing food security and to also help increase rural livelihoods, it will be important to reverse the trend of declining agricultural productivity. For this, in turn, a first step would be to support targeted analytical studies to understand how the productivity of the agricultural sector can be increased while promoting shared prosperity and green outcomes. This will include understanding the role of farm consolidation and contract farming as well as commodity exchange markets, but also better understanding the potential trade-offs between higher productivity and more equitable and greener outcomes and how these tradeoffs can best be managed. Given the topography, impact on land quality (erosion, pollution, etc.) of a transition from subsistence to commercial
agriculture would be important to understand.
Box 7: China’s Sloping Lands Conversion Program
In China, 2-4 billion tons of silt is estimated to go to Yangtze and middle and upper reaches of the Yellow River every year and 65% of this was estimated to come from sloping croplands. China’s Sloping Land Conversion Program (SLCP) was developed to deal with this challenge. Its environmental goal is to reduce water and soil erosion as well as increase forest cover through retiring steeply sloping and marginal lands in agriculture production. The program also aims for poverty alleviation and helping farmers to transfer to sustainable production. The program was budget of RMB 337 billion (over US$40 billion). It set a target of converting 14.67 million hectares of cropland to forests by 2010, among which, 4.4 million are steep land with more than 25 degrees of slope. Afforesting an equal area of wastelands was an additional “soft” goal. The program was expected to increase forest area by 10-20% helping to increase domestic timber supply.
The basic approach of the program was to provide compensation to farmers who transferred degraded and highly sloping cropland to timber-producing forests, which are considered as “ecological forests”, or plantations including trees with medical value, or orchards, which are considered as economic forests. The subsidies took three forms, annual in-kind subsidy of grain, subsidy in cash and providing farmers free seedlings. The subsidies varied based on different regions. The grain subsidy was between 2250 kg/ha – 1500 kg/ha and the cash subsidy RMB 300/ha/yr (USD 36/ha/yr). Both were provided for 8 years based on meeting the requirement of planting forests for 5 years or grass for 2 years. Furthermore, income from forests and grasslands was to be exempt from tax.
The SLCP has helped increase carbon sequestration, ecosystem services and timber supply. More than 7.2 million hectares of cropland had been retired by the end of 2003 under spending of RMB 50 billion.
Source: Michael, T.B. and Xu, J. “China’s Sloping Land Conversion Program:
Institutional Innovation or Business as Usual?”, Workshop on “Payments for Environmental Services (PES) – Methods and Design in Developing and Developed Countries.”
22 Mining and Manufacturing
Bhutan has large deposits of a number of industrial minerals and is a prospective source for base and possibly precious metals. The main types of mineral currently being developed in the country include dolomite, limestone, gypsum, coal, quartzite, and marble. In 2012, though the mining and quarrying sector in Bhutan contributed only 1.9% of GDP, it was the second largest foreign exchange earner, second only to energy, and the sector thus plays an important role in the balance of payments. Dolomite, gypsum, coal, cement, copper wire, ferrosilicon, and manganese are the main exports (The Mineral Industries of Bhutan and Nepal, 2013).
In the 11th Five Year Plan, the mining sector has been highlighted as a key sector to support economic development and enhanced exports. Only about 39% of the country has been geologically mapped and further discovery of mineral deposits is expected in the rest of the country. Currently most activity is in the western part of the country, where infrastructure also is concentrated.
Bhutan’s mining sector faces a number of challenges of management, allocation, and monitoring, in part due to the absence of a clear mineral development policy.9 The sector is also constrained by lack of human resource capacity in the public and private sector. Moreover, although Bhutan has been cautious of the environmental consequences of mining, limiting the land area accessible to the sector, in 2013 about 42% of the commercial extraction operations were found not to comply with environmental requirements. The concern especially is with the impacts on communities near the mining sites.
Bhutan aims to promote environmentally and socially responsible mineral development by increasing number of mines revegetated, promoting value addition of minerals10 to limit the area mined and support quality mines, and ensuring that mineral royalties benefit local
communities through sub-national mineral revenue allocation mechanisms such as the proposed community development fund. Technical and human capacity of the government and private sector also is to be strengthened. A potentially useful complement to these measures could be fines for pollution damages caused by lack of diligence in following environmentally sound mining practices, and for failure to adequately restore sites.
Improving the environmental performance of the sector will make growth greener, and the proposed allocation of royalties towards a community development fund will also make growth in the sector more inclusive. But because minerals are an exhaustible natural resource, promoting inclusive green growth also involves how the economic rents from mineral extraction are managed. To ensure that the potential of these natural assets to contribute to growth in the future is not lost, (given that national income is a return on national assets), it is critical that a share of resource rents from mineral extraction are reinvested in other assets that can continue to produce an economic return long after the mineral resources have been exhausted. Such
9 The Mineral Development Policy has been drafted and is expected to be approved within the first year of the Eleventh Plan.
10 Due to the abundance of hydro power and cheap energy, Bhutan has an advantage in energy intensive mineral beneficiation industries. However, this benefit may be eroded over time if the value added from use of electricity in domestic beneficiation is less than what it could obtain from power sales to India.
23 reinvestment can include “soft” assets such as additional financing for enhancing worker skills in other sectors, and for improvement of institutional capacities to promote manufacturing
expansion in other sectors (e.g., food and forest products processing).
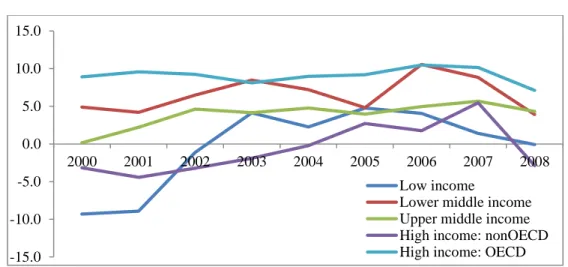
The World Bank’s comprehensive wealth accounts (World Bank, 2006 and 2011), and in particular its Adjusted Net Savings (ANS) indicator, provide an assessment of whether countries rich in sub-soil assets are using this natural capital to support sustainable development through rent capture and reinvestment. Because national accounts measure gross savings and
depreciation of produced capital, but do not record changes in the stocks of human and natural capital, the World Bank developed the ANS as a more complete measure of savings. ANS measures the change in a country’s national wealth: a negative ANS suggests that the country is running down its capital stocks and a positive ANS that the country is adding to its wealth (see Box on Calculating Adjusted Net Savings). As shown in the figure below, ANS for low-income resource-rich countries was negative for a number of years and relatively low even when
positive, suggesting that these countries are failing to leverage their natural assets for broader development gains and may be running down their total wealth. Surprisingly, so too are the high-income non-OECD countries.
Figure 4: Adjusted Net Savings: Resource-rich Countries by Income Group
Source: World Bank, (2011)
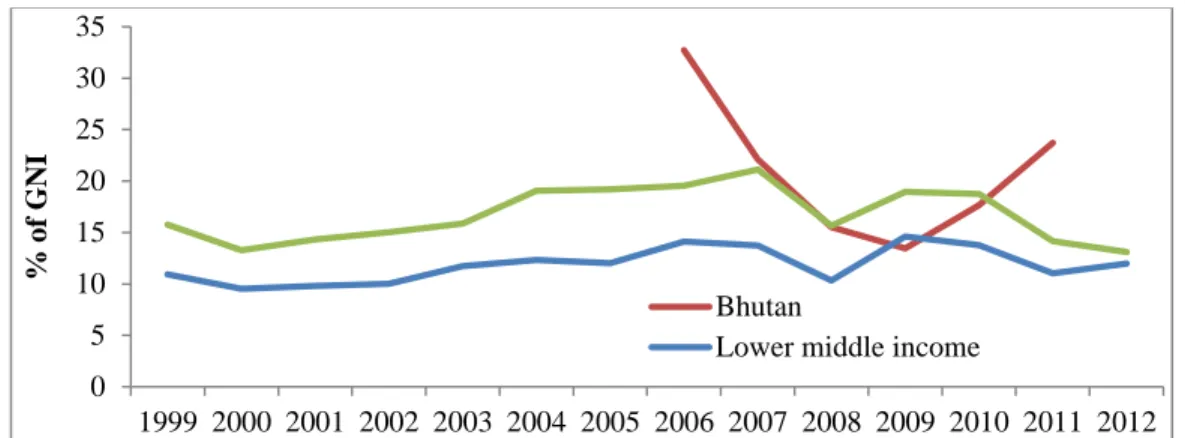
The lack of readily available data on national gross savings for Bhutan has limited the construction of a time series on ANS for Bhutan. Data available for 2006 to 2011 though shows that ANS is positive for this period and Bhutan is on a sustainable path. These data, however, do not provide an indication of the extent of rent recovery – how much of the resource rent
generated by the sector is recovered by the state and available for public finance. Construction of mineral accounts as part of the System of Environmental and Economic Accounts would provide Bhutan better indicators and detail statistics to manage this sector, and help to inform a broader policy on public revenue management.
-15.0 -10.0 -5.0 0.0 5.0 10.0 15.0
2000 2001 2002 2003 2004 2005 2006 2007 2008
Low income
Lower middle income Upper middle income High income: nonOECD High income: OECD
24 Figure 5: Adjusted Net Savings: Bhutan and Other Lower Middle Income Countries
Source: World Bank, (2014). World Development Indicators 0
5 10 15 20 25 30 35
1999 2000 2001 2002 2003 2004 2005 2006 2007 2008 2009 2010 2011 2012
% of GNI
Bhutan
Lower middle income
Box 8: Calculating Adjusted Net Savings
Figure 6: Calculating Adjusted Net Savings
Savings lay the basis for building wealth and future growth. Adjusted Net Saving (ANS) measures the real difference between production and consumption, taking into account depreciation of fixed capital, investments in human capital, depletion of natural resources, and damages caused by pollution.
Adjusted Net Saving is derived from the standard national accounting measure of Gross Saving by