Research Collection
Journal Article
Who uses shared micro-mobility services?
Empirical evidence from Zurich, Switzerland
Author(s):
Reck, Daniel Jan; Axhausen, Kay W.
Publication Date:
2021-05
Permanent Link:
https://doi.org/10.3929/ethz-b-000477544
Originally published in:
Transportation Research Part D: Transport and Environment 94, http://doi.org/10.1016/
j.trd.2021.102803
Rights / License:
Creative Commons Attribution 4.0 International
This page was generated automatically upon download from the ETH Zurich Research Collection. For more
information please consult the Terms of use.
Transportation Research Part D 94 (2021) 102803
Available online 4 April 2021
1361-9209/© 2021 The Author(s). Published by Elsevier Ltd. This is an open access article under the CC BY license
(http://creativecommons.org/licenses/by/4.0/).
Who uses shared micro-mobility services? Empirical evidence from Zurich, Switzerland
Daniel J. Reck
*, Kay W. Axhausen
ETH Zürich, Institute for Transport Planning and Systems, Stefano-Franscini-Platz 5, 8093 Zürich, Switzerland
A R T I C L E I N F O Keywords:
Shared mobility Transportation equity Multivariate probit Bike-sharing Shared e-scooters
A B S T R A C T
Shared micro-mobility services have rapidly gained popularity yet challenged city administra- tions to develop adequate policies while scientific insight is largely missing. From a transportation equity perspective, it is particularly important to understand user correlates, as they are the beneficiaries from public investment and reallocation of public space. This paper provides an up- to-date account of shared micro-mobility adoption and user characteristics in Zurich, Switzerland.
Our results suggest that shared micro-mobility users tend to be young, university-educated males with full-time employment living in affluent households without children or cars. Shared e- scooter users, in particular, are younger, yet more representative of the general population in terms of education, full-time employment, income and gender than bike-sharing users. This suggests that shared e-scooters may contribute to transportation equity, yet their promotion should be handled with care as life-cycle emissions exceed those of bike-sharing and equity contributions might be skewed as many users are students.
1. Introduction
Shared micro-mobility services (e.g., shared e-scooters, shared bikes, shared e-bikes) have rapidly gained popularity in major cities around the world. Recently, NACTO (2020) reported 136 M rides in 2019 in the US alone – a 62% increase from 2018, mostly due to the rise of shared e-scooters. Their sudden appearance and rapid expansion has challenged city administrations and raised many regulatory and planning questions: Where should they be allowed to be ridden and parked? Which infrastructure (e.g., bike lanes, recharging points, bike racks) should be adapted and newly created on redistributed public space? Should their usage be subsidized for certain social groups? To answer these questions, it is particularly important to understand who uses these new services and whether there are any equity1 concerns (i.e., overrepresentation of certain social groups) as public investments and reallocations of public space will directly benefit them.
Scientific evidence on who uses shared micro-mobility services, however, strongly varies by mode. While there exists a substantial body of research on docked bike-sharing users (for recent reviews, see Eren and Uz, 2020, and Fishman, 2016), research on docked / dockless e-bike-sharing users is already much more limited (e.g., He et al., 2019, and Hess and Schubert, 2019) and research on shared
* Corresponding author.
E-mail addresses: daniel.reck@ivt.baug.ethz.ch (D.J. Reck), axhausen@ivt.baug.ethz.ch (K.W. Axhausen).
1 Equity is typically defined as the equivalence of input and output ratios (Adams, 1965; Cook and Hegtvedt, 1983; Walster et al., 1973). Equity concerns over public investment in transportation services arise when certain social groups (i.e., higher income) are overrepresented and thus benefit more from these investments in these services than others. For example, Banister (2018) has shown that higher income groups travel more regularly in airplanes and long-distance trains and thus overproportionately benefit from investments in airports and long-distance train networks.
Contents lists available at ScienceDirect
Transportation Research Part D
journal homepage: www.elsevier.com/locate/trd
https://doi.org/10.1016/j.trd.2021.102803
e-scooter users is very scarce (e.g., Sanders et al., 2020). Shaheen and Cohen (2019, p. 11) recently concluded a report on shared micro- mobility user characteristics by stating: “more research is needed to understand the user demographics of dockless bikesharing and scooter sharing.”
We contribute by conducting a large-scale survey among users of three shared micro-mobility services (docked bikes and e-bikes, dockless e-bikes, dockless e-scooters) in Zurich, Switzerland. We compare user characteristics in terms of person and household socio- demographics, travel priorities and access to shared micro-mobility services, and explain usage by estimating state of the art univariate and multivariate probit models.
This article is organized as follows. In Section 2, we review the literature on shared micro-mobility with a particular focus on user characteristics. In Section 3, we introduce our dataset. We then describe user characteristics of different shared micro-mobility ser- vices. In Section 5, we model shared micro-mobility usage and present the results. The last section discusses the results and concludes with recommendations for policy-making and future work.
2. Literature review
Research on shared micro-mobility can be broadly categorized into supply- and demand-side topics, of which the latter is more relevant to this paper. Demand-side research tends to focus on questions such as how and why specific services are used, and by whom.
Demand-side research can be further categorized by types of factors that influence demand such as internal (e.g., user socio- demographics, values, attitudes), external (e.g., built environment and land use, geography, weather) and trip-related (e.g., dis- tance, time of day, destinations). Internal factors are most relevant to the topic of this paper and thus the focus of this literature review.
We begin by reviewing the literature for station-based bike-sharing (which we refer to as “docked” in this paper to contrast the
“dockless” alternatives) as it is the largest and most complete compared to other shared micro-mobility modes. Most studies identify a common set of four factors to influence bike-sharing usage: age, gender, income and education. Younger individuals are generally more likely to be users of docked bike-sharing schemes than older individuals (e.g., Buck et al., 2013; Chen et al., 2020; Eren and Uz, 2020; Fishman et al., 2013; Fishman et al., 2015; Fishman, 2016; Fuller et al., 2011; Ge et al., 2020; Shaheen et al., 2014; Shaheen and Cohen, 2019). Males join docked bike-sharing schemes more often than females (e.g., Bachand-Marleau et al., 2012; Chen et al., 2020;
Fishman et al., 2013; Fishman et al., 2015; Fishman, 2016) though exceptions from this pattern have been reported (e.g., Buck et al., 2013) and it has been suggested that docked bike-sharing may indeed help to close the overall gender gap in cycling in North America (Goodyear, 2013). Income is mostly found to be positively correlated with docked bike-share usage (e.g., Bachand-Marleau et al., 2012; Eren and Uz, 2020; Fishman et al., 2013; Fishman et al., 2015; Fishman, 2016; Shaheen et al., 2014; Shaheen and Cohen, 2019) though the study conducted by Buck et al. (2013) in Washington, D.C., presents an exception here as well. This could be due to methodological differences, though, as income among bike-share users was found to be smaller than the mean, however larger than the median of the general population in Washington, D.C. Users of docked bike-sharing schemes often show higher levels of education (e.
g., Eren and Uz, 2020; Fishman et al., 2013; Fishman et al., 2015; Fishman, 2016; Fuller et al., 2011; Shaheen et al., 2014; Shaheen and Cohen, 2019). Some authors have additionally reported that docked bike-sharing users show higher employment rates (i.e., full-time or part-time work) than the general population (Fishman et al., 2013; Fishman, 2016; Fuller et al., 2011).
Several other factors have been reported incidentally (and/or controversially) to influence docked bike-sharing usage such as private mobility tool ownership (i.e., bike and car) and household structure. Chen et al. (2020) found a substantial share of car non- users in their sample of bike-sharing users while Shaheen et al. (2011) noted that car ownership was an attractive condition for the use of bike-sharing schemes (Eren and Uz, 2020). Buck et al. (2013) observed that households with bike-sharing users had fewer cars and bikes. Bachand-Marleau et al. (2012) found that those owning a bike were less frequent users of bike-sharing while Fishman et al.
(2013) and Shaheen et al. (2011) concluded that bike-sharing users are more likely to own private bikes. Hyland et al. (2018) further found a negative impact of driving license ownership on bike-sharing usage while Bachand-Marleau et al. (2012) found that those with a driver’s license had 1.5 times greater odds of using bike-sharing. Last but not least, Shaheen and Cohen (2019) found a higher share of childless households among docked bike-sharing users.
Up to date, only few academic studies have investigated user characteristics of shared micro-mobility schemes other than docked bike-sharing. Chen et al. (2020) compared station-based and free-floating bike-sharing user structures in Hangzhou, China. They concluded that user structures are indeed similar. However, different factors influence the usage intensity of both modes. He et al.
(2019) analyzed users of a shared e-bike system in Utah. They found that middle-aged population groups use e-bike-sharing frequently in addition to the usually reported younger population groups. Finally, Hess and Schubert (2019) analyzed socio-demographics of cargo e-bike-sharing in Switzerland. They found that users are predominantly young, cycling males.
To our knowledge, only one peer-reviewed academic study (Sanders et al., 2020) analyzed user characteristics of shared dockless e- scooters2. They conducted a survey in Tempe, AZ, and found that e-scooter users were mostly young (25–34) males and that income varied with riding patterns (i.e., most frequent riders had an annual household income between 50,000 USD and 99,000 USD). The latest edition of NACTO’s report on shared micro-mobility (NACTO, 2020) also offers first insights into user characteristics. Surveys conducted in five US cities suggest that users are younger than the general population and predominantly male. Income distributions appear to vary by city, twice matching area median income and once substantially exceeding it.
The gap in the academic literature on rigorous identification of socio-demographic characteristics for users of shared micro-
2 There have been studies analysing the intent to use e-scooters (e.g., Eccarius and Lu, 2020), however, these were disregarded in our literature review as we focus on correlates of real users as they are not subject to hypothetical bias (Hensher, 2010).
mobility schemes other than docked bike-sharing is apparent. In particular, very little is known about users of relatively new schemes (i.e., e-bike-sharing, e-scooter-sharing). In addition, the factors influencing real usage (as opposed to usage intention) across different schemes in a single location have not been analyzed yet. This is, however, important as external factors such as weather, geography and built environment influence demand substantially (e.g., Wang et al., 2018) and thus complicate cross-regional comparisons (c.f. the effect of income on dockless e-scooter usage as reported by NACTO, 2020). Closing this gap is urgent as policy-makers need to un- derstand who benefits from these schemes to develop suitable and equitable regulation and direct infrastructure investment and reallocations of public space. Researchers will benefit from sound evidence on user characteristics to improve multimodal choice models that are needed for transportation simulations and forecasts.
3. Data 3.1. Location
We collect data on users of shared micro-mobility services in Zurich, Switzerland. Zurich is the largest Swiss city with 434 K in- habitants (1.5 M in the metropolitan area) and one of Switzerland’s economic centers. Several shared micro-mobility providers operate in Zurich, making it a suitable place to analyze their users. The most established one is Publibike, which offers docked bikes and e-bikes at ~ 160 stations in Zurich. Bond Mobility offers dockless e-bikes that can travel up to a speed of 45 km/h. Multiple dockless e-scooter providers started operating since 2019, among them Lime, Bird, Tier and Voi.
3.2. Survey
We designed an online survey as the principal data source for the subsequent analyses. The survey (in German, available upon request) included a total of 71 questions structured into the following three blocks:
•Person-specific socio-demographic questions (e.g., year of birth, gender, educational attainment, current occupation)
•Household-specific socio-demographic questions (e.g., number of adults and children, monthly income, mobility tool ownership)
•Person-specific mobility questions (e.g., public season ticket ownership, travel priorities, knowledge of and membership in shared (micro-) mobility schemes, frequency of use, access to shared micro-mobility services at home and work).
All questions and answer categories were formulated to be equal to the latest available Swiss microcensus3 to enable direct comparison (see Section 3.4. below).
3.3. Recruitment
The survey was sent to 17,500 randomly selected inhabitants of Zurich municipality of age 18 to 65 by the cantonal statistical office as part of two larger studies. Respondents of study A were offered a reward of 50 CHF4 for participating in two surveys and two months of smartphone tracking. Respondents of study B were offered a reward of 90 CHF for participating in two surveys and three months of smartphone tracking. All participants consented to data collection and data processing methods in compliance with the EU General Data Protection Regulation. Here, we report on the results and participation rates of the first survey only, which was identical for both study groups.
A total of 1,958 (11%) people returned the survey between July and August 2020. Only completed questionnaires were considered for the analysis. Further, questionnaires missing information such as income or travel priorities were excluded from the analyses. In total, 1,454 (8%) valid questionnaires remained for further analysis.
3.4. Representativeness
We compare socio-demographic characteristics between survey respondents and census information for Zurich municipality to investigate the overall representativeness of our survey given a potential self-selection bias. The latest available censuses are the 2015 microcensus (“Mikrozensus Mobilit¨at und Verkehr”, MZMV), which contains all relevant socio-demographic and mobility-related information, and the more current yet limited in scope (i.e., no mobility-related information) 2018 census (“Strukturdatenerhe- bung”, SE).
Table 1 shows the resulting comparison. Respondents of our survey were slightly younger (mean: 38 years) than the respondents of the censuses (2015: 42 years, 2018: 41 years) and overrepresent the age groups between 21 and 30 and 31–40 years. Our sample further includes slightly fewer females (47%) than the censuses (2015: 50%, 2018: 51%). The three surveys (2015, 2018, 2020) show two general societal trends: an increasing share of inhabitants holding a university degree (2015: 49%, 2018: 58%, 2020: 73%) and
3 Documentation in English can be found here: https://www.are.admin.ch/are/en/home/mobility/data/mtmc.html. Questionnaires are available in German (https://www.bfs.admin.ch/bfs/de/home/statistiken/mobilitaet-verkehr/erhebungen/mzmv.assetdetail.5606052.html) and French (https://www.bfs.admin.ch/bfs/fr/home/statistiques/mobilite-transports/enquetes/mzmv.assetdetail.5606053.html).
4 1 CHF =1.09 USD at the time of writing (22 September 2020).
increasing full-time employment (2015: 63%, 2018: 68%, 2020: 80%). In line, mean monthly household income is found to be increasing from ~ 9,000 CHF to ~ 10,000 CHF. The household structure appears to be shifting to an increasing share of households with zero children (2015: 62%, 2018: 70%, 2020: 74%) and an increasing share of single or dual adult households (2015: 71%, 2018:
84%, 2020: 87%).
Swiss public transportation season tickets mainly fall into two categories: local and national. Local season ticket holders are slightly underrepresented in our survey (37% vs 43% in 2015) while national season ticket holders are slightly overrepresented (19% vs 16% in 2015). Households in our survey owned slightly fewer cars and slightly more bikes and e-bikes compared to the 2015 census.
4. Descriptive analysis of user characteristics of shared micro-mobility services
We proceed by comparing characteristics of users of different micro-mobility schemes descriptively, before modelling usage in the subsequent section.
4.1. Membership, ownership and usage frequency
We begin with an overview of membership, ownership and usage frequencies of shared micro-mobility schemes. Dockless e-scooter schemes had most members in our sample (28%), while docked (e-) bikes (16%) and dockless e-bikes (9%) were substantially less popular. Interestingly, while e-scooter ownership is (still?) uncommon (3%), e-bike ownership is substantially more common (14%).
Table 1
Comparison of socio-demographic characteristics between survey respondents and Zurich municipality censuses.
This survey Census (SE) Census (MZMV)
Year 2020 2018 2015
N (Zurich municipality only) 1454 7808 809
Filtered for age groups 18–65 18–65 18–65
Person-specific attributes Age
18–20 1 3 2
21–30 27 20 16
31–40 37 31 28
41–50 21 22 25
51–60 10 18 21
61–65 4 7 8
Female 47 50 51
Education (university degree) 73 58 49
Full-time employed 80 68 63
PT season ticket ownership
Country-wide, 100% off 19 n/a 16
Local (Zurich), 100% off 37 n/a 43
Household-specific attributes Monthly income
4,000 CHF and below 18 n/a 11
4,001 CHF – 8,000 CHF 21 n/a 35
8,001 CHF – 12,000 CHF 22 n/a 26
12,001 CHF – 16,000 CHF 26 n/a 14
16,000 CHF and above 14 n/a 14
Children
0 74 70 62
1 12 14 17
2 and above 15 15 20
Adults
1 27 28 15
2 60 56 56
3 and above 13 15 29
Cars
0 50 n/a 45
1 42 n/a 43
2 and above 8 n/a 11
Bikes
0 17 n/a 19
1 20 n/a 25
2 and above 63 n/a 56
E-bikes
0 86 n/a 95
1 10 n/a 4
2 and above 3 n/a 1
Most members of dockless e-scooter schemes (39%) were only member of one company, while 23% were member of two companies, 18% of three companies, and 20% of all four companies. The largest shared e-scooter company (in terms of membership) unites 78% of all members, while the smallest company only unites 27% of all members.
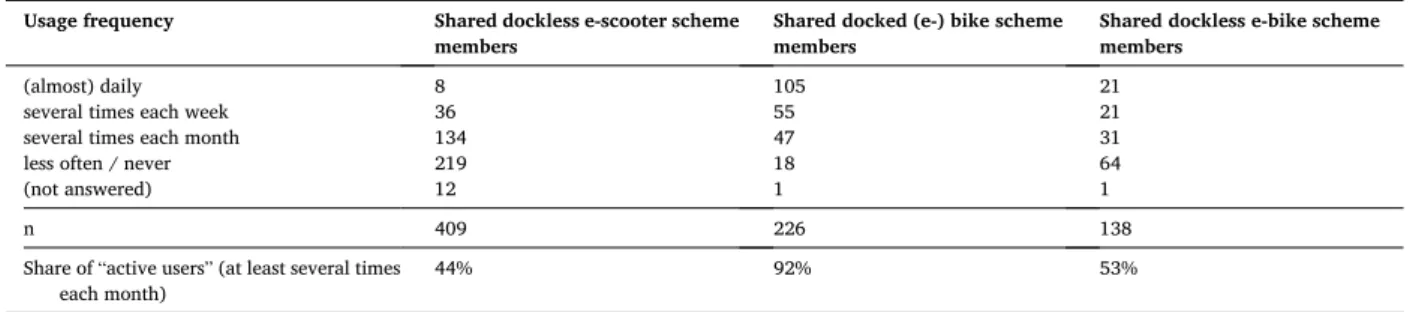
While the terms ‘member’ and ‘user’ are often used interchangeably, their connotations are different and thus should be distin- guished. The term ‘member’ has a static connotation and comprises both active and inactive or ‘dormant’ users. The term ‘user’ on the other hand has an active connotation that is linked to actual usage. For the purpose of this study, we define users as respondents who use a shared micro-mobility scheme at least ‘several times per month’. Table 2 differentiates members of shared micro-mobility services by usage frequency to illustrate and quantify this difference. We find that members in docked (e-) bike schemes are most active (92%) while members in dockless e-bike schemes (53%) and dockless e-scooter schemes (44%) and are substantially less active.
In other words, a substantial share of members in shared micro-mobility schemes is inactive or dormant. In line with our research question, we proceed our analysis with the subsample of active users only.
4.2. Socio-demographics
Table 3 shows person-specific and household-specific attributes and corresponding values of the three shared micro-mobility user groups (shared dockless e-scooters, shared docked (e-) bikes, shared dockless e-bikes). The last column shows the values for all re- spondents of our survey. Values in parentheses show differences in percentage points between each group and all respondents.
The side-by-side comparison of the different groups reveals several commonalities. Shared micro-mobility users in our sample tend to be young, university-educated males with full-time employment living in affluent households without children or cars. Exceptions from this general pattern reveal the differences between the groups. Users of shared dockless e-scooter schemes tend to be younger (mean: 33 years) than users of shared docked (e-) bike and dockless e-bike schemes (means: 36 and 39 years, respectively). They exhibit the “smallest” (yet substantial) gender disparity of all shared micro-mobility modes (32% females vs 29% and 18% for docked (e-) bikes and dockless e-bikes, respectively) and show a lower university education level (71%) and full-time employment level (79%) than all other shared micro-mobility modes (81% and 83% for docked (e-) bikes, 78% and 85% for dockless e-bikes). Their average monthly household income (10,200 CHF) is substantially lower than that of users of both other shared micro-mobility modes (11,200 CHF for dockless e-bikes, 11,000 CHF for docked (e-) bikes). Indeed, in these three socio-demographic categories (university edu- cation, full-time employment and household income), users of shared dockless e-scooter schemes are much more similar to the overall sample than to users of both bike-sharing schemes. Household structures differ mainly in that substantially more dockless e-scooter users live in households without children (87%) than the overall sample (74%) and that more households are single adult households than in the overall sample. These findings correspond with the slightly larger share of students among users of shared e-scooter schemes (15%) than in the overall sample (14%) or indeed any other shared micro-mobility scheme, as students in Zurich typically live alone or in shared flats, have lower (own) income, lower (completed) levels of education and are not (yet) full-time employed.
Users of the shared dockless e-bike schemes, in contrary, exhibit particularly strong differences in socio-demographics. 82% of all users of the shared dockless e-bike scheme in our sample are males, which compares to 53% in the overall sample. They are particularly well educated (78% hold a university degree) in comparison to the overall sample (73%). They also show the highest rate of full-time employment (85%) which compares to 80% in the overall sample. In line, their mean monthly household income is also substantially higher (11,200 CHF) than that of households in the overall sample (10,300 CHF).
Users of the shared docked (e-) bike scheme fall well within the general pattern in terms of age, gender, education and income. They are younger (mean: 36 years) than the overall population (mean: 38 years) but not as young as shared e-scooter users (mean: 33 years).
They are predominantly male (71%, +18 pp. in comparison to the overall sample) and live in more affluent households (mean monthly income: 11,000 CHF), yet this pattern is not as strong as for shared dockless e-bike users (82% and 11,400 CHF, respectively). Two characteristics, however, distinguish them from other shared micro-mobility users. First, they have substantially less access to private cars (44%) in comparison to shared e-scooter users (50%), dockless e-bike users (52%) and the overall sample (54%). Second, they hold substantially more frequently a countrywide public transportation season ticket (29%) in comparison to other shared micro-mobility users and the overall sample (19%).
Finally, we note that mobility tool ownership appears to coincide with scheme membership, i.e. respondents who own e-scooters/e- bikes are more likely to use shared e-scooters/e-bikes as well.
Table 2
Members or users? Shared micro-mobilty scheme members by usage frequency.
Usage frequency Shared dockless e-scooter scheme
members Shared docked (e-) bike scheme
members Shared dockless e-bike scheme
members
(almost) daily 8 105 21
several times each week 36 55 21
several times each month 134 47 31
less often / never 219 18 64
(not answered) 12 1 1
n 409 226 138
Share of “active users” (at least several times
each month) 44% 92% 53%
Table 3
Descriptive comparison of socio-demographic characteristics of users of different shared mobility services (in percentages of subsamples; parentheses indicate differences to total sample in percentage points).
Shared dockless e-scooter users Shared docked (e-) bike users Shared dockless e-bike users Total (Sub-) Sample size
N 178 207 73 1454
% of total 12 14 5 100
Person-specific attributes Age
18–20 3 (+2) 1 (−) 0 (−1) 1
21–30 42 (+15) 30 (+3) 16 (−11) 27
31–40 38 (+1) 41 (+4) 42 (+5) 37
41–50 13 (−8) 18 (−3) 26 (+5) 21
51–60 3 (−7) 8 (−2) 12 (+2) 10
61–65 1 (−3) 2 (−2) 3 (−1) 4
Female 32 (− 15) 29 (− 18) 18 (−29) 47
Driver’s license ownership 94 (−) 96 (+2) 100 (+6) 94
Access to car (frequent / always) 50 (−4) 44 (− 10) 52 (−2) 54
Education (university degree) 71 (−2) 81 (+8) 78 (+5) 73
Employment
In training 15 (+1) 13 (−1) 10 (−4) 14
Full-time employed 79 (−1) 83 (+3) 85 (+5) 80
PT season ticket ownership
Country-wide, 100% off 28 (+9) 29 (+10) 32 (+7) 19
Local (Zurich), 100% off 39 (+2) 37 (−) 34 (−3) 37
Travel priority: environment
Not important 8 (+5) 3 (−) 7 (+4) 3
Rather unimportant 20 (+5) 20 (+5) 16 (+1) 15
Rather important 35 (+1) 29 (−7) 27 (−9) 36
Important 37 (−9) 48 (+2) 49 (+3) 46
Travel priority: time
Not important 0 (−1) 1 (−) 0 (−1) 1
Rather unimportant 2 (−6) 6 (−2) 8 (− ) 8
Rather important 26 (−4) 32 (+2) 26 (−4) 30
Important 71 (+9) 61 (−1) 66 (+4) 62
Travel priority: flexibility
Not important 0 (−1) 1 (−) 0 (−1) 1
Rather unimportant 3 (−4) 8 (+1) 4 (−3) 7
Rather important 24 (−4) 29 (+1) 27 (−1) 28
Important 74 (+10) 62 (−2) 68 (+4) 64
Household-specific attributes Monthly income
4,000 CHF and below 16 (−2) 18 (−) 10 (−8) 18
4,001 CHF – 8,000 CHF 22 (+1) 22 (+1) 23 (+2) 21
8,001 CHF – 12,000 CHF 25 (+3) 25 (+3) 27 (+5) 22
12,001 CHF – 16,000 CHF 26 (−) 25 (−1) 27 (+1) 26
16,000 CHF and above 11 (−3) 11 (−3) 12 (−2) 14
Children
0 87 (+13) 81 (+7) 75 (+1) 74
1 6 (−6) 6 (−6) 11 (−1) 12
2 and above 7 (−8) 14 (−1) 14 (−1) 15
Adults
1 32 (+5) 28 (+1) 22 (−5) 27
2 55 (−5) 59 (−1) 66 (+6) 60
3 and above 13 (−) 14 (+1) 12 (−1) 13
Cars
0 56 (+6) 58 (+8) 55 (+5) 50
1 36 (−6) 35 (−7) 36 (−6) 42
2 and above 8 (−) 7 (−1) 10 (+2) 8
Bikes
0 24 (+7) 10 (−7) 19 (+2) 17
1 24 (+4) 20 (−) 25 (+5) 20
2 and above 52 (− 11) 70 (+7) 56 (−7) 63
E-bikes
0 88 (+2) 86 (−) 66 (−20) 86
1 8 (−2) 10 (−) 19 (+9) 10
2 and above 3 (−) 5 (+2) 15 (+12) 3
E-scooters
0 89 (−8) 97 (−) 100 (+3) 97
1 8 (+5) 2 (−1) 0 (−3) 3
2 and above 2 (+2) 0 (−) 0 (− ) 0
(continued on next page)
4.3. Travel priorities
We asked the respondents to assess the importance of travel priorities such as protecting the environment, travel time and flexibility on a 4-point scale from not important to important. Users of micro-mobility services, on average, assess travel time and flexibility to be more important and protecting the environment to be less important than the overall sample. Shared e-scooter users, in particular, responded substantially less often that protecting the environment was important to them (-9 pp. in comparison to the overall sample) while they responded substantially more often that travel time (+9 pp.) and flexibility (+10 pp.) was important to them.
4.4. Shared micro-mobility access
We further asked the respondents to evaluate their access to shared micro-mobility services at home and at work. Most respondents confirmed that shared e-scooters and shared (e-) bikes were available at home which came at no surprise as only residents of Zurich municipality were invited to participate in the survey. Within Zurich municipality, only few areas are excluded from most operator’s zones. At work, access to shared micro-mobility is less common, though. This difference can be explained with working locations.
While all 1454 respondents live in Zurich municipality, only 1060 stated that they also work in Zurich municipality. Within each shared micro-mobility user group, respondents naturally evaluated access to shared micro-mobility services higher than the overall sample., i.e. 90% of shared e-scooter users reported that shared e-scooters were available at home (+10 pp. in comparison to the overall sample).
5. Modelling shared micro-mobility usage
In the previous section, we explored characteristics of shared micro-mobility users descriptively. We proceed by modelling usage leveraging the previously discovered relationships to explore their relative size and significance.
5.1. Methodology
The dependent variable to model, shared micro-mobility usage, is binary here (i.e., each respondent qualifies as an active user or not as outlined in Section 4). We thus model usage using probit models (Greene, 2012). As usage of different schemes, i.e. dockless e- scooters and dockless e-bikes, might be correlated, we further model usage jointly using a multivariate probit model (MVP). The MVP approach allows error terms between individual choices to be correlated and is commonly used in transportation research to model mobility tool ownership, among others (e.g., Becker et al., 2017; Choo and Mokhtarian, 2008; Yamamoto, 2009).
Our univariate probit models (UVP) individually, and jointly as the multivariate probit model (MVP) for i mobility schemes, have the following form
Yi*=βiX+εi,i=1,2,3,4,5 (1)
where Yi *is an unobserved vector representing the latent utility or propensity to being user of each mobility scheme i, βi is a vector representing the coefficients to be estimated for each mobility scheme i, x is a vector representing the observed characteristics believed to be relevant to the decision (see previous section), and εi is the error term for each mobility scheme. The variance–covariance matrix of the error term is
∑
=
⎡
⎣1 ⋯ ρ1,5
⋮ ⋱ ⋮
⋯ 1
⎤
⎦ (2)
The observed binary variables Yi=1 if Yi*>0, 0 otherwise. The correlations in Σ are informative as positive correlations indicate mobility schemes to be complements, and negative correlations indicate mobility schemes to be substitutes. They further indicate whether decisions are indeed related and thus require joint modelling.
We estimate all parameters by maximum simulated likelihood (Cappellari and Jenkins, 2006) which have been shown to be consistent, asymptotically normal and efficient if the number of draws is chosen greater than the square root of the sample size (Cappellari and Jenkins; 2003; Train, 2003). Here, we use 100 draws, which is substantially higher than ̅̅̅̅̅̅̅̅̅̅̅
√1454
≈38.We use Stata 15 and the package mvprobit (Cappellari and Jenkins, 2003) for model estimation with robust standard errors.
Table 3 (continued)
Shared dockless e-scooter users Shared docked (e-) bike users Shared dockless e-bike users Total Shared micro-mobility access1
Bike-share at home 82 (+5) 90 (+13) 90 (+13) 77
Bike-share at work 58 (−) 68 (+10) 71 (+13) 58
Shared e-scooters at home 90 (+10) 85 (+5) 83 (+3) 80
Shared e-scooters at work 65 (+9) 61 (+5) 67 (+11) 56
1Read this section as follows. Example for line “Bike-share at home”: “82% of all users of shared dockless e-scooters stated to have access to bike- share at home. This is 5 percentage points more than in the overall sample.”
5.2. Results
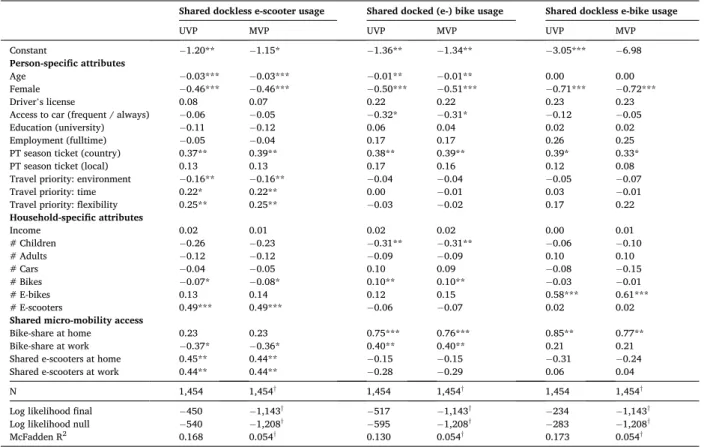
Table 4 summarizes the results of the three univariate probit models (UVP) for each shared micro-mobility scheme and the joint multivariate probit model (MVP). All coefficients were estimated for each model, but we only discuss the significant ones in the following paragraphs.
Though there is no established measure for the goodness of fit of such models, McFadden’s R2 calculated as R2=1− log[L(β)]
log[L0] (3)
where L(β)is the value of the unconstrained log likelihood function and L0 is the value of the log likelihood function where all regression coefficients are zero, is commonly used (Becker et al., 2017; Choo and Mokhtarian, 2008; Lansink et al., 2003).
McFadden’s R2 of the final UVP models range between 0.130 (shared docked (e-) bike usage) and 0.173 (shared dockless e-bike usage) which is well within the range of the goodness of fit of previously reported models (Becker et al., 2017; Choo and Mokhtarian, 2008). Table 5 shows that the correlations between all the error terms of the individual equations are positive and significant, con- firming that an MVP is efficient to use to estimate usage jointly. Interestingly, McFadden’s R2 is substantially lower for the MVP model (0.054) than for the UVP models indicating that it is substantially more difficult to explain joint usage of shared micro-mobility modes than to explain usage / non-usage separately. Overall, both the significance levels and the size of the coefficients between the UVP models and the MVP model are very similar and we thus continue to report the results of the MVP model.
Out of all variables tested, gender and the country-wide public transportation season ticket ownership are the only two universally significant and highly substantial binary variables to influence shared micro-mobility usage. Females are consistently and substantially less likely than men to become users of shared micro-mobility schemes, least so for shared dockless e-bikes. Ownership of a country- wide public transportation season ticket consistently and positively influences usage of all shared micro-mobility modes. Furthermore, private vehicle ownership correlates with shared vehicle usage, i.e. respondents owning e-scooters/e-bikes are also more likely to use shared e-scooters/e-bikes. Non-surprisingly, access to shared (e-) bikes and e-scooters also correlates with shared mobility usage within each respective scheme.
Usage of shared e-scooter schemes is further significantly and negatively influenced by age (most substantially of all analyzed
Table 4
Estimation results for univariate probit (UVP) models and multivariate probit (MVP) model.
Shared dockless e-scooter usage Shared docked (e-) bike usage Shared dockless e-bike usage
UVP MVP UVP MVP UVP MVP
Constant −1.20** − 1.15* −1.36** −1.34** −3.05*** −6.98
Person-specific attributes
Age −0.03*** − 0.03*** −0.01** −0.01** 0.00 0.00
Female −0.46*** − 0.46*** −0.50*** −0.51*** −0.71*** −0.72***
Driver’s license 0.08 0.07 0.22 0.22 0.23 0.23
Access to car (frequent / always) −0.06 − 0.05 −0.32* −0.31* −0.12 −0.05
Education (university) −0.11 − 0.12 0.06 0.04 0.02 0.02
Employment (fulltime) −0.05 − 0.04 0.17 0.17 0.26 0.25
PT season ticket (country) 0.37** 0.39** 0.38** 0.39** 0.39* 0.33*
PT season ticket (local) 0.13 0.13 0.17 0.16 0.12 0.08
Travel priority: environment −0.16** − 0.16** −0.04 −0.04 −0.05 −0.07
Travel priority: time 0.22* 0.22** 0.00 −0.01 0.03 −0.01
Travel priority: flexibility 0.25** 0.25** −0.03 −0.02 0.17 0.22
Household-specific attributes
Income 0.02 0.01 0.02 0.02 0.00 0.01
# Children −0.26 − 0.23 −0.31** −0.31** −0.06 −0.10
# Adults −0.12 − 0.12 −0.09 −0.09 0.10 0.10
# Cars −0.04 − 0.05 0.10 0.09 −0.08 −0.15
# Bikes −0.07* − 0.08* 0.10** 0.10** −0.03 −0.01
# E-bikes 0.13 0.14 0.12 0.15 0.58*** 0.61***
# E-scooters 0.49*** 0.49*** −0.06 −0.07 0.02 0.02
Shared micro-mobility access
Bike-share at home 0.23 0.23 0.75*** 0.76*** 0.85** 0.77**
Bike-share at work −0.37* − 0.36* 0.40** 0.40** 0.21 0.21
Shared e-scooters at home 0.45** 0.44** −0.15 −0.15 −0.31 −0.24
Shared e-scooters at work 0.44** 0.44** −0.28 −0.29 0.06 0.04
N 1,454 1,454† 1,454 1,454† 1,454 1,454†
Log likelihood final −450 − 1,143† −517 −1,143† −234 − 1,143†
Log likelihood null −540 − 1,208† −595 −1,208† −283 − 1,208†
McFadden R2 0.168 0.054† 0.130 0.054† 0.173 0.054†
* p <0.05; ** p <0.01; *** p <0.001.
†Estimated jointly (MVP).
mobility services), travel priorities in favor of flexibility and time, and against the environment. Usage of shared docked (e-) bike schemes, in turn, is negatively influenced by age (though not as much as for shared e-scooters), frequent access to cars and the number of children in the household.
6. Concluding discussion
How do our results compare with previous literature on shared micro-mobility users, and what can we learn from them?
Previous literature on docked bike-sharing largely agrees that users tend to be younger and more highly educated than the general population. They are further typically found to be predominantly male and to live in households that are more affluent. Anecdotal evidence points towards a positive correlation with full-time employment and a negative correlation with household size (in particular number of children), while it is disputed whether vehicle ownership (cars, bikes) has a positive or a negative correlation with docked bike-sharing usage. The small body of literature on shared, dockless e-bikes suggests their users could be similar to docked bike-sharing and potentially include a higher share of older age groups. First evidence suggests that users of shared e-scooter schemes are particularly young and predominantly male.
We find that users of shared micro-mobility services in Zurich indeed also tend to be young, university-educated males with full- time employment living in affluent households without children or cars (see Table 6 for a summary of the main results).
We further find that vehicle ownership correlates with scheme membership, i.e. those who own e-scooters/e-bikes are more likely to use shared e-scooters/e-bikes as well. For bike-sharing, this confirms previous findings of Fishman et al. (2013) and Shaheen et al.
(2011) and differs from previous findings of Bachand-Marleau et al. (2012) and Buck et al. (2013). We are the first to extend these findings from bike-sharing to e-bikes and e-scooters. Owners of country-wide public transportation season tickets are further consistently more likely to use shared micro-mobility.
Exceptions from these general patterns illustrate that previous findings for one mode cannot always be generalized to others. While users of shared e-scooter schemes are particularly young and males are still in the majority, more females use them than shared bikes.
In terms of educational attainment, full-time employment and mean household income, shared e-scooter users are also more similar to the general population than to their bike-sharing peers. This could, however, be due to a higher share of students among shared e- scooter users, who have lower (own) income, lower (completed) levels of education and who are not (yet) full-time employed. Equity contributions, in particular in comparison to shared e-bike users, could hence be skewed and short-lived. Shared e-scooter users being more representative of the overall population than bike-sharing users further appears counter-intuitive with respect to income as shared e-scooters in Zurich were the most expensive shared micro-mobility mode at the time the survey was conducted: a 10 min journey with a shared e-scooter, for example, cost between 4 and 5 CHF (depending on the operator), which compared to 2.9 CHF for docked bike-sharing, 4.9 CHF for docked e-bike-sharing and 2.5 CHF for dockless e-bike-sharing. It suggests, however, that disposable income might be different among the different shared micro-mobility groups (i.e., students might have a higher share of disposable income than other social groups) or that price might be less important for shared e-scooter mode choice than for other modes.
Our findings on the socio-demographic background of users of shared micro-mobility services relate well to the results of broader research on technology adoption. The ‘innovation diffusion’ model by Rogers (1995) is commonly employed to study socio- demographic profiles in five consecutive categories of technology adopters (innovators, early adopters, early majority, late major- ity, laggards). Previous studies in a variety of sectors conclude with very similar results to ours, i.e. innovators and early adopters of new technologies tend to be young, highly educated, relatively wealthy, male individuals (e.g., Black et al., 2001; Li et al., 2008;
Table 5
Correlations in the error terms of the individual equations of the multivariate probit model.
Shared dockless e-scooter usage Shared docked (e-) bike usage Share dockless e-bike usage
Shared dockless e-scooter usage n/a 0.37*** 0.48***
Shared docked (e-) bike usage n/a n/a 0.63***
Shared dockless e-bike usage n/a n/a n/a
* p <0.05; ** p <0.01; *** p <0.001.
Table 6
Key differences between shared micro-mobility user groups and overall Zurich population.
Shared dockless e-scooter
users Shared docked (e-) bike
users Share dockless e-bike
users Zurich (SE
2018)
Age (mean) 33 yrs 36 yrs 39 yrs 41 yrs
Gender (female) 32% 29% 18% 50%
University degree (share) 71% 81% 78% 58%
Full-time employment (share) 79% 83% 85% 68%
Household income (mean) 10,200 CHF 11,000 CHF 11,200 CHF 9,300 CHF †
Households without children
(share) 87% 81% 75% 70%
Households without cars (share) 56% 58% 55% 45% †
†Source: MZMV 2015 (not available in SE 2018).
Lockett and Littler, 1997; Polatoglu and Ekin, 2001; Reinen and Plomp, 1993; Sulaiman et al., 2007; Morris and Venkatesh, 2000;
Wood and Li, 2005), though there is some evidence that the gender gap may be narrowing at least in some contexts (e.g., DeBaillon and Rockwell, 2005, Li et al., 2008; Rainer et al., 2003; Ray et al., 1999).
Having identified these similarities in findings with previous studies, can we also learn from their suggestions to make transport (i.
e., shared micro-mobility in this particular case) more equitable? At its core, transport provides accessibility, and equity in accessibility has been a long established priority for transport policy. The efficacy of means to achieve equitable accessibility, however, is highly context-dependent and includes additional considerations such as costs and sustainability. In other words, while increasing the inclusiveness (and thereby the use) of shared micro-mobility would contribute to equity targets, would it also contribute to cost- efficiency and sustainability targets? At the moment, this seems questionable, at least, and research has only begun to establish the impact of shared micro-mobility on these topics. For example, shared e-scooters, mostly due to rebalancing, appear to have sub- stantially higher life-cycle greenhouse gas emissions than shared bikes or public transportation (de Bortoli and Christoforou, 2020;
Hollingsworth et al., 2019; Moreau et al., 2020).
Still, there might be ‘low-hanging fruits’, i.e. measures that require little or no public investment, yet have the potential to increase the accessibility, equity of access, sustainability and/or the efficiency of public transportation systems. Policy-makers can, for example, require shared micro-mobility service providers to reposition their vehicles evenly by a measure of population density to increase equity of access at zero public costs. First evidence further suggests that shared micro-mobility can fill gaps in the existing trans- portation system where other modes are not available (Reck et al., 2021). Thus, improving their availability when and where needed (e.g., at night in ‘transit deserts’) seems sensible. In general, by improving access at places where their use is wanted from a policy- perspective (i.e., public transportation stations to improve first/last mile access; at workplaces, to foster their use as alternative commuting modes; at accessibility voids) and prohibiting parking where their use is not wanted, policy-makers can guide their use and integration into the wider transportation system. The two providers of shared (e-) bikes in Zurich have taken first steps in this direction and explore partnerships with large employers in the region to foster their use for commutes. While results for dockless e-bikes are not yet measurable, previous analyses suggest that docked (e-) bikes are indeed more often being used for commutes than other shared micro-mobility modes (Reck et al., 2021). This analysis further shows that their users live in households with fewer private cars and less access to cars. While more work is needed to establish causation, this suggests that shared micro-mobility – if implemented and regulated sensibly - can contribute to more accessible, sustainable, and equitable cities.
We acknowledge that the number of respondents in our study varied by mode and that thus not all potentially relevant variables, in particular for the smallest subgroup of shared dockless e-bike users, were significant. Future studies could target larger samples of shared micro-mobility users to test our findings and extend them. Our results further call for mode choice studies that include shared micro-mobility to estimate the relevance of potentially new attributes (e.g., access, fun) and their impact on price.
CRediT authorship contribution statement
Daniel J. Reck: Conceptualization, Methodology, Data collection, Data analysis, Writing - original draft. Kay W. Axhausen:
Conceptualization, Methodology, Writing – review & editing.
Acknowledgements
We thank two anonymous reviewers for their constructive comments which substantially improved the clarity and focus of this paper. The data was collected as part of two larger studies with Verkehrsbetriebe Zürich and Swiss Federal Railways.
References
Adams, J.S., 1965. Inequity in social exchange. Adv. Exp. Soc. Psychol. 2, 267–299.
Bachand-Marleau, J., Lee, B.H.Y., El-Geneidy, A.M., 2012. Better Understanding of Factors Influencing Likelihood of Using Shared Bicycle Systems and Frequency of Use. Transport. Res. Rec.: J. Transport. Res. Board 2314, 66–71.
Banister, D., 2018. Inequality in Transport. Alexandrine Press, Oxon, UK.
Becker, H., Ciari, F., Axhausen, K.W., 2017. Comparing car-sharing schemes in Switzerland: User groups and usage patterns. Transport. Res. Part A: Policy Pract. 97, 17–29.
Black, N.J., Lockett, A., Winklhofer, H., Ennew, C., 2001. The adoption of Internet financial services: a qualitative study. Int. J. Retail Distribut. Manage. 29 (8), 390–398.
Buck, D., Buehler, R., Happ, P., Rawls, B., Chung, P., Borecki, N., 2013. Are Bikeshare Users Different from Regular Cyclists? A First Look at Short-Term Users, Annual Members, and Area Cyclists in the Washington, D.C., Region. Transport. Res. Rec.: J. Transport. Res. Board 2387, 112–119.
Cappellari, L., Jenkins, S.P., 2003. Multivariate probit regression using simulated maximum likelihood. Stata J. 3 (3), 278–294.
Cappellari, L., Jenkins, S.P., 2006. Calculation of multivariate normal probabilities by simulation, with applications to maximum simulated likelihood estimation.
Stata J. 6 (2), 156–189.
Chen, M., Wang, D., Sun, Y., Waygood, E.O.D., Yang, W., 2020. A comparison of users’ characteristics between station-based bikesharing system and free-floating bikesharing system: case study in Hangzhou, China. Transportation 47, 689–704.
Choo, S., Mokhtarian, P.L., 2008. How do people respond to congestion mitigation policies? A multivariate probit model of the individual consideration of three travel-related strategy bundles. Transportation 35, 145–163.
Cook, K.S., Hegtvedt, K.A., 1983. Distributive justice, equity, and equality. Ann. Rev. Sociol. 9 (1), 217–241.
de Bortoli, A., Christoforou, Z., 2020. Consequential LCA for territorial and multimodal transportation policies: method and application to the free-floating e-scooter disruption in Paris. J. Cleaner Prod. 273, 122898.
DeBaillon, L., Rockwell, P., 2005. Gender and student-status differences in cellular telephone use. Int. J. Mobile Commun. 3 (1), 82–98.
Eccarius, T., Lu, C.-C., 2020. Adoption intentions for micro-mobility - Insights from electric scooter sharing in Taiwan. Transportation Research Part D: Transport and Environment 84, 102327.