E2F1-mediated transcriptional regulation in vitro and in vivo
I n a u g u r a l - D i s s e r t a t i o n zur
Erlangung des Doktorgrades
der Mathematisch-Naturwissenschaftlichen Fakultät der Universität zu Köln
vorgelegt von Parisa Monfared .
aus Teheran/Iran
2007
Berichterstatter/in: Prof. Dr. Sigrun Korsching Prof. Dr. Frank Sprenger
Vorsitzender: Prof. Dr. Helmut W. Klein
Tag der letzten mündlichen Prüfung: 5. Juni 2007
1. Abbreviations ... 3
2. Introduction ... 5
2.1 Brain tumours ... 6
2.1.1 Classification and histology... 6
2.1.2 Etiology ... 7
2.1.3 Genetic abnormalities ... 7
2.1.4 Current therapeutic approaches ... 9
2.1.5 Animal models and in vivo imaging technologies... 10
2.2 Cell cycle overview... 12
2.2.1 Cell cycle regulation by cyclins and cyclin dependent kinases ... 14
2.2.2 The Retinoblastoma Family of Proteins ... 15
2.2.3 The E2F Family of Transcription Factors ... 18
2.2.4 Functional Roles of RB Regulated E2F Activity ... 23
2.2.5 Cell cycle deregulation and cancer ... 26
2.2.6 Dual properties of E2F-1: Oncogene and tumor suppressor... 26
2.2.7 DNA damage ... 27
2.2.8 E2F1 signaling ... 28
3. Thesis aims... 36
4. Results... 37
4.1 E2F-1 expression in U87dEGFR cells is altered in... 37
4.2 BCNU induces p53 and p21 expression in U87dEGFR cells ... 40
4.3 Characterization of E2F-1 regulated lucIREStkgfp ... 41
4.4 BCNU treatment leads an arrest in dose dependency manner ... 47
4.5 BCNU treatment induces apoptosis ... 49
4.6 Visualization of E2F-1 transcriptional activity in vivo ... 51
5. Discussion... 54
6. Abstracts... 61
6.1 Zusammenfasung ... 61
7. Material and Methods ... 64
7.1 Glioblastoma cells and culture conditions... 64
7.2 Chemotherapeutic agent ... 64
7.3 Immunoprecipitation ... 65
7.4 Western blot analyses ... 66
7.5 Generation of reporter vectors... 67
7.6 Packaging and transduction of tumor cell line ... 69
7.7 Selection of transduced tumor cell clones ... 69
7.8 Quantification of luciferase gene expression in cell culture ... 69
7.9 Immunocytostaining ... 70
7.10 Flow cytometry analysis ... 70
7.11 Caspase-3/7 Assay ... 71
7.12 Animal experiments... 71
7.13 Bioluminescence imaging in culture and in vivo ... 72
7. 14 Statistics ... 72
8. References... 73
9. Erklärung... 86
10. Lebenslauf ... 87
1. Abbreviations
ATM ataxia-telangiectasia mutated
Apaf-1 apoptosis protease-activating factor-1 BCNU Carmustine
BSA bovine serum albumin bp base pair
Cdk-4 cyclin-dependent kinase-4 Cip CDK inhibitor protein
CNS central nervous system DP dimerization protein
Da Dalton
DHFR dihydrofolate reductase DNA Deoxyribonucleic acid
DTT Dithiothreitol EDTA Ethylenediamine- tetraacetic acid EtOH Ethanol
EGFR Epidermanl growth factor receptor FBS Fetal bovine serum
GBM Glioblastoma mulitiforme GFP Green fluorescent protein IgG Immunoglobulin G INK4 inhibitor CDK4 IP immunoprecipitation
IRES internal ribosome entry site kDa Kilodalton
LTR long terminal repeat
LUC luciferase
M Molar
MRI Magnetic resonance imaging MDM2 murine double minute clone 2 MW molecular weight
min minute
mRNA messenger-RNA
NLS nuclear localization signal nM nanoMolar
nt nucleotide N-terminus Amino-terminius O.D Optical density ORF Open reading frame
PAGE polyacrylamide gel electrophoresis PBS Phosphate buffer saline
PCR Polymerase chain reaction PET Positron emission tomography RNA Ribonucleic acid
RT reverse transcription SDS soduim dodeyl sulfate siRNA small-interfering RNA ser serine amino acid TK thymidine kinase Ub ubiquitin
wt wild-type μ micro
WHO world health organization
2. Introduction
Of all cancer types, brain tumours probably represent the most
devastating and difficult-to-treat cancer. Although enormous advances in
treating other solid cancers, such as lung and breast cancers, highlighted the
last decade, median survival for glioblastoma muliforme (GBM; the most
common and aggressive primary brain tumour) stayed nearly the same over
the last 50 years, averaging ~ 1 year (Hoffman et al., 2006; Thuppal et al.,
2006). Regardless of advances in surgical and imaging techniques, we still
face multiple problems when treating brain tumours, some because of
extensive infiltration of tumour cells, their invasion into normal brain
parenchyma or other sites, and resistance to standard radiation and
chemotherapy. However, our paramount inability to successfully treat brain
cancer mostly stems from the lack of understanding of the underlying brain
tumour biology. Another problem common to diagnosing and thus treating the
disease results from difficulties in classifying brain tumours often defined by
histological rather than molecular criteria. For example, histological similar
primary GBMs arising de novo and secondary GBMs progressing from low- to
high-grade tumours will be classified and treated the same regardless of the
vast disparity in molecular characteristic (DeAngelis, 2001; Kleihues & Ohgaki,
1999) . Although curing brain cancer might be in the distant future, we have
gained some understanding of genetic and molecular characteristics of human
brain tumours (Louis et al., 2001). Recent advances in laboratory techniques
and successful development of brain tumour models faithfully recapitulating
the human disease shed further light on necessity and sufficiency of genetic
alterations for brain tumour initiation, progression, and maintenance; help
identify relevant therapeutic targets; and provide an amenable field for testing
novel therapeutic agents, translating into a better treatment for brain tumour
patients.
2.1 Brain tumours
2.1.1 Classification and histology
Normal brain is composed of a variety of cell types, including neurons, glia (astrocytes, oligodendrocytes, microglia, and ependymal cells), vascular epithelium, and meningeal cells. Primary brain tumours can be classified into gliomas, the most common adult brain tumours occurring in the brain parenchyma above the tentorium, and medulloblastomas, child or young adult cerebellar tumours occurring below the tentorium (Lassman, 2004).
Intracranial tumous arising from meninges (meningiomas) and tumour metastases from systemic cancers (lung, breast, colon) are not considered primary brain tumours and will not be discussed.
Depending on morphologic and histologic similarities to the normal cells, gliomas can be classified as astrocytic, oligodendrocytic, or mixed, and are proposed to arise from the respective cell type (Kleihues & Sobin, 2000;
Lassman, 2004). The WHO classification divides astrocytic tumours into grades 1 to 4, grade 4 GBM being the most aggressive and malignant primary glioma. Astrocytic tumours (including GBMs) are composed of glial fibrillary acidic protein (GFAP)-expressing cells with fibrillary cytoplasm and angular nuclei, whereas GFAP-negative oligodendroglial tumours present uniform cells with rounded nuclei. GBM features include microvasular proliferation, nuclear atypia, presenceof gliant cells, and pseudopalisading necrosis.
Histologically indistinguishable but molecularly/ genetically distinct primary
and secodary GBMs develop as primary de vovo tumours or progress from
the diffuse grade 2 to anaplastic grade 3 astrocytomas and to secondary
GBMs. Similar WHO classification subdivides oligodendrogliomas into grade 2
low-grade and grade 3 anaplastic oligodendrogliomas. Although patients
withlow-grade gliomas survive for 10 to 15 years, patients with grade 3
astrocytomas survive for only 2 to 3 years; the mean survival for patients with a GBM is ~ 1 year (DeAngelis, 2001; Kleihues & Sobin, 2000).
Medulloblastomas, “blue-cell tumours” composed of small cells with little cytoplasm, are locally invasive and express synaptophysin and NeuN.
These cerebellar tumous are classified as desmoplastic, if they contain large- cytoplasm cell islands in the field of more typical medulloblastomas cells, or as large cell, if they contain large pleiomorphic cells. Medulloblastomas show good prognosis with a 65% to 85% cure rate and a high possibility of complete resection; yet, CSF tumour cell spreading and severe neuroaxis irradiation effects still pose a problem (Kleihues & Sobin, 2000; Lassman, 2004).
2.1.2 Etiology
The eitology of malignant gliomas is largely unknown. However, there are some hereditary tumour syndromes associated with primary brain tumours such as neurofibromatoses 1and 2, Li-Fraumeni syndrome and Turcot ‘s syndrome (Louis & von Deimling, 1995). Also several occupations, environmental carcinogens, and dietary factors have been reported to be associated with an elevated glioma risk, but this data is controversial.
Exposure to therapeutic ionizing radiation has been associated with an increased brain tumour risk (Nygaard et al., 1991; Ohgaki & Kleihues, 2005).
2.1.3 Genetic abnormalities
Neoplastic transformation in the central nervous system is a process in
which the normal control of the cell proliferation and cell-cell interactions are
lost and a normal cell is transformed into a premalignant cell. This process
has been found to be involved in oncogenes, tumour suppressor genes, DNA repair genes, and cell death genes. The alterations of these genes are not specific in malignant glioma but the combination and accumulation are characteristic features (Aguzzi et al., 1995; Maher et al., 2001).
In low grade astrocytomas, overexpression of platelet-derived growth factor (PDGF) ligands and receptors is the earliest alteration in the genome suggesting that autocrine slimulation, cellular proliferation and migration are involved (Guha et al., 1995; Maher et al., 2001). PDGF-receptor overexpression is closely correlated with the mutations of tumour suppressor gene p53 on chromosome 17p (Hesselager et al., 2003). p53 alterations are present in nearly 50% of gr II astrocytomas (Stander et al., 2004). The p53 gene has an important role in cell cycle arrest, response to DNA damage, apoptosis, angiogenesis, and differentiation. Many other growth factors and their receptors are overexpressed in astrocytomas including epidermal growth factor (EGF), and vascular endothelial growth factor (VEGF) leading to microvascular proliferation, as well as an increased tendency to infiltrate and migrate (Maher et al., 2001; Plate et al., 1992).Epidermal growth factor receptor (EGFR) gene is overexpressed or its receptor is amplified in 50-60%
of all GBM especially in primary GBMs but in few AAS (Marquez et al., 2004;
Suzuki et al., 2004). These changes in EGFR facilitate mitogenesis and inhibit
apoptosis in tumour cells (Nagane et al., 1996). In secondary high grade
astrocytomas molecular abnormalities have been observed in cell-cycle
regulatory complex, which includes the p16, cyclin-dependent kinase-4 (cdk-
4), cdk-6, cyclin D1, and retinoblastoma (RB) proteins. Deletions of the
p16/cdkn2A gene, amplification of cdk-4, and mutations of RB gene lead to an
uncontrolled progression of the cell cycle from the G1 to the S phase (Maher
et al., 2001; Nakamura et al., 2001). This pathway is altered in 60% of
anaplastic astrocytomas and in the majority of GBM (Ichimura et al., 1996).
Loss of heterozygosity (LOH) on chromosome 10q is found in over 60%
of GBM (Ohgaki et al., 2004). The tumour suppressor locus is present in chromosome 10 and alterations of PTEN/MMAC-1/TEP-1 gene are found in 30% of GBMs (Fiano et al., 2004). The alterations in the PTEN gene may regulate cell migration, but there may be other tumour suppressor genes in the nearby region in chromosome 10 (Karlbom et al., 1993). The most characteristic genetics alteration is LOH 1p and 19q in oligodendrogliomas, which is evident in 80% of these tumour types. The anaplastic oligodendroglioma has usually a similar progression in the associated genetic changes as high grade astrocytoma (Reifenberger et al., 1994). Some oligoastrocytomas carry tumour suppressor gene p53 mutations related to astrocytoma and some have 1p and 19q deletions related to oligodendroglioma (Maintz et al., 1997).
2.1.4 Current therapeutic approaches
Glioma and medulloblastoma treatments normally include tumours resection, histologic examination, radiation therapy, and chemotherapy. The most common chemotherapeutic agents used for glioma treatment are DNA alkylating cytotoxic drugs such as carmustine [1,3-bis(2-chloroethyl-1- nitrosourea]; a triple combination of procaranzine, cisplatin, and vincristine; or the recently development temozolomide etopside, or lomustine, whereas those used for medulloblastoma treatment are cisplatin, cyclophosphamide, or vincristine.
Chemotherapy is a method of treatment where specific chemical
compounds are used to interfere with tumour cell growth and survival. These
compounds achieve their effectiveness from their ability to alter the cell cycle
or kill the cell. Both these rely on the fact that tumour derived cells are actively
dividing, whereas normal brain cells mostly are not. Therefore, non-dividing cells are usually unaffected by chemotherapy. However, the success of the treatment depends on dividing rate of cancer cells and thus, fraction of cells in this phase of the cell cycle.
However, drugs listed above present serious side effects and eventually fail as patients develop resistance, whereas radiation and chemotherapy adversely affect neurocognitive and physical development (Hu
& Holland, 2005; Weiss et al., 2003).
2.1.5 Animal models and in vivo imaging technologies
In vivo modeling provides essential tumour host interactions and is a more accurate means of modeling human cancer. Mouse models can be classified as Xenograft tumour models or models of spontaneous tumour formation in genetically engineered mice (GEM), and help address issues of utmost importance in drug development: toxicity and in vivo antitumour effectiveness. Although the Food and Drug Administration does not require the latter before proceeding to clinical trials, in vivo modeling of drug efficacy is a gold standard required by a majority of pharmaceutical companies (Benson et al., 2006; Sellers & Fisher, 1999).
Pharmacokinetic/pharmacodynamic models based on physiological and anatomic representation of bodily organs and drug biochemistry are likely to supplement in vivo modeling during future drug development (Andersen, 1995; Andersen & Krishnan, 1994).
Present imaging tools for living organisms are mostly based on
nonspecific physiological or metabolic changes rather than on specific
molecular events (Massoud & Gambhir, 2003). Several imaging technologies
are available for both humans and animals, including positron emission
computed tomography (PET), single-photon emission computed tomography (SPECT), magnetic resonance imaging (MRI), computed tomography (CT) and ultrasound (US). CT and US are currently used for visualizing anatomical structures such as organs or tumours. MRI has several advantages including high spacial resolution and the ability to gather a broad range of anatomical, molecular and functional information. For molecular imaging, although a reporter probe for a specific target can be used in conjunction with MRI, the sensitivity is relatively low. PET and SPECT generate low spacial resolution images that detect metabolic, molecular and pathological changes with high sensitivity, but both require the use of radioisotope tracers.
Bioluminescence imaging (BLI) and fluorescence imaging are not used clinically, but they have become established methods in animal experiments to monitor grafted tumours (Gross & Piwnica-Worms, 2005; Massoud &
Gambhir, 2003). Both of these optical techniques use charge-coupled device detectors to monitor the visible light emitted from the body of anesthetized animals. A reporter gene is engineered to express a protein such as luciferase or green fluorescent protein from a specific promoter. The levels of these proteins can be measured in vivo and correlated with the activity of the promoter in the transgene construct. BLI using luciferase has been widely used in cell assay, and is now being applied in living cells and animals. When live animals are provided with luciferin (the luciferase substrate) through injection, luciferase-expressing cells produce light. Fluorescence imaging is visualized using a reporter such as green fluorescence protein and thus requires an excitation light to illuminate the animals, but no injection is needed. Both techniques are highly sensitive and the background noise is minimal for grafted tumours. These reactions are rapid and essentially provide real-time imaging.
2.2 Cell cycle overview
The process of faithfully replicating the genetic information of a cell and
its subsequent division into two daughter cells is known as the cell cycle. The
cell cycle can be envisioned as alternating cycles of interphase, where the cell
grows in size, synthesizes RNA and proteins, and replicates its DNA, and
mitosis (M), where the newly replicated cell divides. At times, cells may exit
the cell cycle after M and remain quiescent in a resting phase (G
0). Once the
cell receives a mitogenic stimulus, cells reenter the cell cycle at gap phase 1
(G
1), a growth phase prior to replication, followed by entry into synthesis (S),
where the DNA of the cell is replicated, succeeded by gap phase 2 (G
2), a
growth phase preceding cell division in M (Figure 1). Progression through the
four stages of the cell cycle is ordered and tightly regulated to ensure that only
one round of DNA replication occurs per cell cycle and that cell division only
occurs after replication is complete. To combat stressors that cells may
encounter as they progress through the cell cycle, such as misaligned
chromosomes or damaged DNA, cells elicit checkpoints that halt cell cycle
progression and allow the cell to try and amend the problem. However, if the
damage is too severe or if repair is untimely, cells will either undergo
apoptosis, which is a programmed cell death, or become senescent, which is
a state of permanent arrest. Cell cycle arrest and elimination of damaged cells
by apoptosis are extremely important processes to an organism in preventing
the transmission of damaged or incompletely replicated DNA to new daughter
cells and thereby acts as a preventative measure against diseases like
cancer.
Figure 1: The cell cycle
The cell cycle is divided into four phases (G
1, S, G
2, and M) and G
0resting state. Progression through the cell cycle is promoted by
cyclin-dependent kinases (CDKs), which are regulated positively by
cyclins and negatively by CDK inhibitors (CDKIs). The restriction
point is the point at which cells progress through the cell cycle
independent of external stimuli (Schwartz & Shah, 2005) .
2.2.1 Cell cycle regulation by cyclins and cyclin dependent kinases
Normal cells need to decide when to divide (ie, enter the cell cycle) and when to stay in G
0. This is a tightly regulated and carefully balanced process. The entry into the cell cycle (G
1) is historically governed by the restriction point- a transition point beyond which cell progression through the cell cycle is independent of external stimuli such as exposure to nutrients or mitogen activation. This point of determination is thought to divide the early and late G
1phase of the cell cycle.
Progression of a cell through the cell cycle is promoted by a number of cyclin dependent kinases (CDKs). CDKs are a family of serine-threonine protein kinases that control progression of the cell cycle by phosphorylating target proteins at specific times (Morgan, 1995; Pines, 1995). Cdk protein levels remain constant during the cell cycle, so their activity is regulated by expression of the cyclin family of regulatory proteins (Murray, 2004; Pines, 1991; Pines, 1995). Timed expression and rapid ubiquitin mediated proteolysis limits cyclin expression to specific intervals of the cell cycle, limiting the activity of the Cdk to certain phases of the cell cycle (Evans et al., 1983; Glotzer et al., 1991; Murray, 2004; Murray et al., 1989; Reed, 2003).
During early G
1, the cyclin D family (consisting of cyclin D1, D2, and D3) forms
a complex with Cdk4 or Cdk6. The cyclin D-Cdk4/6 complex begins the cells
entry into S phase primarily by phosphorylation of the retinoblastoma (Rb)
family of proteins (Sherr, 1994). This is followed by cyclin E-Cdk2 activity and
additional Rb phosphorylation pushing the cell from G
1into S phase (Ohtsubo
et al., 1995). The complex of cyclin A and Cdk2 is required for cells to
progress through S phase (Girard et al., 1991; Walker & Maller, 1991). In the
G
2and M phases of the cell cycle cyclin A forms a complex with Cdk1, and
this complex is required for transition from G
2to M (Yam et al., 2002). Mitosis
is then further regulated by activity of the cyclin B-Cdk1 complex (Arellano &
Moreno, 1997; King et al., 1994) (Figure 1).
Regulation of these cyclin/cdk complexes is accomplished by a variety of mechanisms (Lee & Yang, 2001; Pei & Xiong, 2005; Pines, 1991; Pines, 1995; Sanchez & Dynlacht, 2005). For example, cyclin/cdk complexes are regulated by a class of proteins known as cyclin dependent kinase inhibitors (CDKi). Cyclin dependent kinase inhibitors play important roles in coordinating proliferation during normal development and differentiation, as well as during cellular stress (Coqueret, 2003; Lee & Yang, 2001).There are two broad classes of CDKi proteins, the INK4 and CIP families (Pei & Xiong, 2005;
Pines, 1995; Sherr & Roberts, 1999).The INK4 family, including pI6
INK4atarget Cdk4 and Cdk6 and prevent their association with cyclin D (Carnero &
Hannon, 1998). Without cyclin D association, Cdk4/6 remain inactive and the cell cycle is unable to progress through G
1(Quelle et al., 1995; Serrano et al., 1993). The Cip/Kip family of cyclin dependent kinase inhibitors, including p21 and p27, are able to inactivate multiple cyclin-Cdk complexes. They are able to block cell cycle progression in G
1and, to a lesser extent; S and M phases of the cell cycle and thereby help elicit a checkpoint (Harper et al., 1995;
Hengst & Reed, 1998; Lee et al., 1995; Polyak et al., 1994).
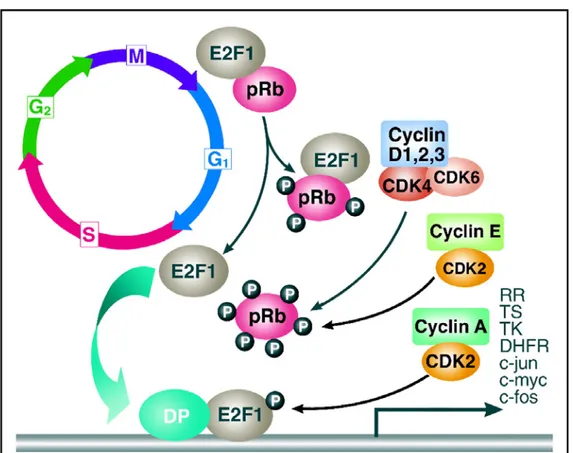
2.2.2 The Retinoblastoma Family of Proteins
The Rb protein is a tumour suppressor, which plays a pivotal role in the
negative control of the cell cycle and in tumour progression. It has been
shown that Rb protein (pRb) governs the G
1/S transition (Figure 2). In its
active state, Rb is hypophosphorylated and forms an inhibitory complex with a
group of transcription factors known as E2F-DP (E2F-1, -2,-3), thus controlling
the G /S transition. The activity of Rb is modulated by the sequential
phosphorylation by CDK4/6-Cyclin D and CDK2/Cyclin E (Malumbres &
Barbacid, 2001; Schwartz & Shah, 2005). When Rb is partially phosphorylated by CDK4/6-CDKs, Rb remains bound to E2F-DP, but this transcription factor is still able to transcribe some genes such as cyclin E. Cyclin E then binds to CDK2 and this active complex then completely hyperphosphorlates Rb, thus releasing the E2F-DP complex and fully activating the E2F transcription factors, resulting in transcriptional activation of numerous S- phase proteins, such as thymidylate synthase (TS) and dihydrofolate reductase (DHFR).
The mammalian RB “pocket” protein family consists of three members:
Rb, p107, and p130. Each of the RB members has a unique expression
pattern during the cell cycle. For example, Rb is present in quiescent cells and
then slightly accumulates in cycling cells (Shan et al., 1994). Structurally,
there are regions of amino acid similarity between all three RB members, but it
is clear that p107 and p130 are more closely related to each other than either
protein is related to Rb (Classon & Dyson, 2001).
Figure 2: Schematic of G
1-S phase regulation of the eukaryotic cell cycle.
Hypophosphorylated Rb complexes with the transcription factor
E2F. CDK2, CDK4, and CDK6 phosphorylate Rb. E2F is
released, binds to DNA with DP, resulting in E2F-dependent
transcription for the G
1to S transition (Schwartz & Shah, 2005).
2.2.3 The E2F Family of Transcription Factors
The E2F transcription factors are key regulators of cell cycle progression and the E2F field has made rapid advances since its advent in 1986. Yet, while our understanding of the roles and functions of the E2F family has made enormous progress, with each discovery new questions arise.
Traditionally, the perception of these proteins is that they control the transcription of gene products required for S phase. However, data generated from microarray and chromatin immunoprecipitation analyses have shown that E2F proteins actually regulate a diverse set of genes involved in, not only, cell cycle transitions, but also differentiation, apoptosis, DNA repair, and checkpoint signaling, as well as some unidentified genes (Ishida et al., 2001;
Ma et al., 2002; Muller et al., 2001; Polager et al., 2002; Ren et al., 2002).
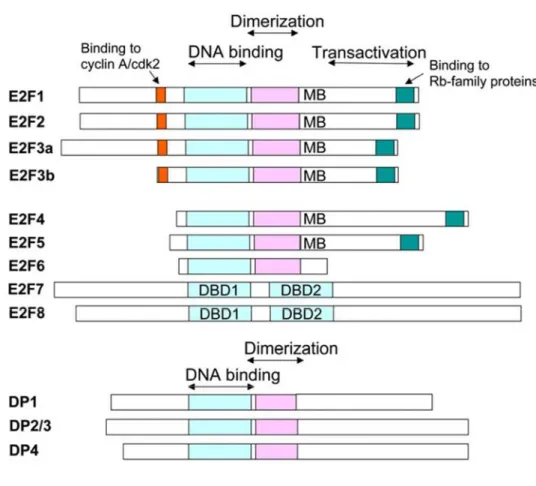
There are now known to be eight E2F family member genes, E2F1- E2F8 (Figure. 3). In addition, two E2F3 proteins, termed E2F3a and E2F3b, are produced from the E2F3 gene through the use of alternative promoters (He et al., 2000; Leone et al., 2000). The highest degree of homology among the E2F family members occurs in the DNA binding domain, which is consistent with the finding that each binds the E2F consensus sequence.
Nonetheless, there is accumulating evidence that different E2F family members bind and regulate distinct but overlapping sets of target genes.
E2F1 through E2F6 require dimerization with one of three DP proteins
(DP1, DP2/3 or DP4) to form functional transcription factors that bind DNA
with high affinity (Bandara et al., 1993; Milton et al., 2006; Ormondroyd et al.,
1995; Rogers et al., 1996; Wu et al., 1995; Zhang & Chellappan, 1995). The
function of the E2F-DP heterodimer is thought to be determined primarily by
the E2F subunit. The roles of the different DP subunits, including several
spliced variants of DP2/3 (Ormondroyd et al., 1995; Rogers et al., 1996), in
modulating E2F activity are not completely understood. The transcriptional activity of E2F1 through E2F5 is regulated through their association with RB or the related pocket proteins, p107 and p130. E2F1, E2F2 and E2F3 primarily associate with RB and do so when RB is in the hypophosphorylated state (Lees et al., 1993).
E2F4 and E2F5 can associate with each of the three pocket proteins and the abundance of these complexes changes with the proliferation state of the cells (Gaubatz et al., 2000; Moberg et al., 1996). Pocket protein binding blocks the transcriptional activity of E2F-DP heterodimers by masking the transcriptional activation domains located in the carboxy terminus of E2F1-5.
E2F family members have been divided into several subclasses based
on their transcriptional regulatory properties on model gene promoters. E2F1,
E2F2, and E2F3a are often referred to as “activator” E2Fs because they
transcriptionally activate E2F target genes such as cyclin E. This subclass of
E2Fs is expressed in a cell cycleregulated manner with maximum levels
observed in late G
1and early S phase. Another subclass, which includes
E2F3b, E2F4, and E2F5, are referred to as the "repressor" E2Fs because
their main function appears to be to repress the transcription of E2F target
genes when in association with RB family members (Figure 4).This subclass
is expressed constitutively but transcriptional repression by these factors
primarily occurs in quiescent and early G
1phase cells. E2F6, E2F7, and E2F8
also function as transcriptional repressors of E2F target genes but do so
independent of RB family members (Cartwright et al., 1998; Christensen et al.,
2005; Di Stefano et al., 2003; Logan et al., 2005; Maiti et al., 2005; Morkel et
al., 1997)
Figure 3: Diagrams of the E2F family of transcription factors.
The highly conserved winged-helix DNA binding domain (DBD) is
indicated in blue, and the hydrophobic heptad repeat domain required for
dimerization is shown in pink. The DBD also appears to contribute to
dimerization. Other domains required for associations with cyclin A/cdk2
and Rb family members are also indicated. E2F1-E2F6 all bind DNA as
heterodimers with DP family proteins, while E2F7 and E2F8 appear to
associate with DNA independent of DP proteins. Note also that mouse
homologs of human DP-2 are usually referred to as DP-3, and there are
several differentially spliced isoforms of DP2/DP3 (not shown). There are
also two known isoforms of E2F7 which differ in their Ctermini (data not
shown) (DeGregori & Johnson, 2006).
It is now becoming clear that this classification of E2Fs as either activators or repressors is overly simplistic and does not accurately reflect the dynamics of E2F-dependent transcriptional control. Microarray analysis has demonstrated that the overexpression of activator E2Fs, such as E2F1, leads to the decreased expression of almost as many genes as are induced (Ma et al., 2002; Muller et al., 2001; Polager et al., 2002). In at least some cases, transcriptional repression by E2F1 is direct and independent of RB (Croxton et al., 2002; Koziczak et al., 2000; Weinmann et al., 2001). On the other hand, E2F4 and E2F5 associate with several transcriptional co-activators and can transcriptionally stimulate E2F target gene promoters when overexpressed (Beijersbergen et al., 1994; Ginsberg et al., 1994; Lang et al., 2001; Morris et al., 2000). Moreover, recent findings demonstrate that endogenous E2F4 regulates the expression of some genes during the G1 phase of the cell cycle independent of RB family members (Balciunaite et al., 2005). Chromatin immunoprecipitation (ChIP) assays are revealing surprising complexity in the promoterspecific and context-dependent recruitment of individual E2Fs and E2F-associated co-factors. Some gene promoters conform to the widely accepted model of transcriptional repression correlating with the binding of E2F4/5-p130/p107 complexes in G
0and early G
1and then being replaced by E2F1, E2F2, and/or E2F3a in late G
1and S phase when transcription is induced (Takahashi et al., 2000). However, many other E2F target gene promoters do not fit this model (Balciunaite et al., 2005; Iwanaga et al., 2004;
Weinmann et al., 2001; Wells et al., 2003). In summary, several of the E2Fs can either activate or repress transcription through the promoter-specific recruitment of a variety of co-factors and this does not necessarily occur in a cell cycle-regulated manner.
Figure 4: Schematic representation of the E2F transcription factor subgroups, their physiological roles and specific binding partners:
The E2F family is divided into at least four subgroups defined by their
regulation by pocket proteins and chromatin modifiers, and by their
physiological function (i.e. activation or repression). 'DP' presents DP1 or
DP2, 'chromatin modifiers' refer to chromatin-modifying activities binding
to the pRB family members, such as HDAC. Recent results have shown
that also E2F7 recruits repressors to E2F-dependent promoters (Attwooll
et al., 2004).
2.2.4 Functional Roles of RB Regulated E2F Activity
E2F was originally discovered as a cellular binding factor at the promoter of the adenovirus E2 gene (Kovesdi et al., 1986; Kovesdi et al., 1987; Yee et al., 1987). E2F-mediated transcription was stimulated by the adenovirus E1A protein and these events correlated with two forms of E2F, a
"free" E2F and a "complexes" E2F (Bagchi et al., 1990). Soon after, Rb was found to be a part of the "complexes" E2F (Bagchi et al., 1991; Bandara & La Thangue, 1991; Chellappan et al., 1991; Chittenden et al., 1991) and E1A was found to bind (Whyte et al., 1988) and inhibit RB (Bagchi et al., 1991; Bandara
& La Thangue, 1991; Chellappan et al., 1991). These results led to a model where the complexes E2F was constituted by RB binding and repressing E2F function, and when RB was inactivated, the free E2F was derepressed and able to activate transcription. Although these observations held true for the activator class of E2Fs, the model needed to be rethought once it was observed that E2F/Rb complexes could actively repress transcription (Hamel et al., 1992; Weintraub et al., 1992).
Currently, there are three types of E2F complexes: activator complexes, inhibited complexes (actively repress), and repressor complexes (Figure 5) (Cobrinik, 2005; Dyson, 1998; Nevins, 1998). The activator complexes are E2F/DP heterodimers that actively transactivate promoters.
The inhibited complexes are formed when Rb is bound to the activator complex. When Rb binds, it blocks the E2F transactivation domain and makes the complex functionally inert. Finally, active repressor complexes are generated when RB family members are recruited to DNA and actively assemble a repressor activity.
The RB family members mediate repression of E2F fuction three ways.
One way they exert this function is by directly binding and blocking the
transactivation domain of E2F (Flemington et al., 1993; Helin et al., 1993).
Additionally, RB is known to bind many proteins involved in chromatin remodeling, such as DNA methyltransferases and histone deacetylases, which actively repress target gene transactivation (Brehm et al., 1998; Luo et al., 1998; Magnaghi-Jaulin et al., 1998; Meloni et al., 1999; Sellers et al., 1995). It has also been observed that RB can physically inhibit pre-initiation complexes from forming at promoters, thereby inhibiting adjacent transcription factor function (Ross et al., 1999).
There are four known mechanisms by which RB can be inactivated. RB inactivation occurs normally during regulated cell cycle progression, where the phosphorylation status of RB and activation of cyclin/cdk complexes is coordinated with the phase of the cell cycle, as described previously (Blagosklonny & Pardee, 2002). The other three mechanisms for RB inactivation result in cell cycle deregulation. One way Rb is inactivated is by genetic inactivation, as observed in most cancers (Nevins, 2001; Sellers &
Kaelin, 1997; Sherr, 1996; Sherr & McCormick, 2002). Additionally, viral oncoproteins from DNA tumor viruses target the RB proteins (Helt & Galloway, 2003). Finally, Rb is degraded by caspases following apoptotic stimuli (Dou &
An, 1998).
igure 5: Schematics of the three types of E2F complexes.
(A) Binding of Rb/E2F complexes to E2F regulated promoters
represses E2Fs transactivation function. (B) By recruiting chromatin
remodeling enzymes such as HDACs complexes to promoter
regions, Rb is able to actively repress transcription. (C) Dissociation
of Rb from E2F allows expression from E2F regulated promoters.
2.2.5 Cell cycle deregulation and cancer
Long before the mechanisms of cell cycle deregulation by the small DNA tumor viruses were known, these viruses were found to be associated with tumor formation. Adenovirus was the first human virus identified to induce tumors in an animal model (Trentin et al., 1962). In addition to virus- associated transformation, cancer often results from cellular mutations that result in loss of normal growth control and lead to unrestrained proliferation.
The high frequency of cell cycle regulators mutated in human cancers demonstrates the importance of proper cellular growth control for the prevention of cancer (Sherr, 1996). The cell cycle mutations most often observed in human cancers include overexpression of cellular cyclins, loss of cyclin dependent kinase inhibitors, and loss of Rb either by mutation, deletion, or inactivation (McDonald & El-Deiry, 2000).
It is interesting to note that although the overall effect of these mutations is to inactivate Rb and deregulate E2F, mutations in E2F have only recently been found in some rare gastric and colorectal tumors (Iwamoto et al., 2004; Suzuki et al., 1999), suggesting that mutation of E2F might be detrimental to emerging tumor cells.
2.2.6 Dual properties of E2F-1: Oncogene and tumor suppressor
Among the E2F family members, E2F-1 is unique in its ability to
regulate a number of key genes that participate in both cell cycle progression
and apoptosis, raising a potential link with its role in tumorgenesis. The
investigations on cells or animals present us with a wonderful paradox that
E2F1 behaves as both oncogene and a tumor suppressor gene. On one hand,
enhancement of E2F1 activity in tissue culture cells can stimulate cell
proliferation and be oncogenic. On the other hand, E2F-1 has been demonstrated as a tumour suppressor by spontaneous development of multiple tumours in mice lacking E2F1 (Yamasaki et al., 1996). The biological function of E2F-1 is just beginning to emerge. More recently, new approaches have identified a large number of E2F1 targeted genes involved not only in DNA replication and cell cycle progression, but also in DNA damage repair, check point control, apoptosis (La Thangue, 2003; Stevens & La Thangue, 2003; Trimarchi & Lees, 2002). Thus, E2F-1 is a multi-functional damage responsive protein that is involved in numerous aspects of the DNA damage response (Figure 6).
2.2.7 DNA damage
Extracellular and intracellular insults such as reactive oxygen species, ionizing radiation,and radiomimetic drugs can induce DSBs (double-strand breaks) in DNA. Of the many cellular responses to DSBs, regulation of cell division by checkpoints received the most at attention initially. Historically, checkpoints refer to mechanisms that arrest the cell division cycle in response to intracellular conditions such as damaged or incompletely replicated DNA.
Signals that activate cell cycle checkpoints were later found to activate
additional cellular responses such as DNA repair and apoptosis. Thus,
currently, these responses, along with cell cycle regulation by checkpoints, are
collectively referred to as DNA damage response pathways.
2.2.8 E2F1 signaling
A role for E2F-1 in the DNA damage response pathway was suggested from experiments in which treating cells with DNA damaging agents increased E2F-1 protein levels (Blattner et al., 1999; Hofferer et al., 1999; O'Connor &
Lu, 2000). This effect exhibits kinetics that closely resembles the induction of p53. In turn, these results hinted that E2F-1 and p53 may be regulated through a common pathway (Blattner et al., 1999).
We know now that the induction of E2F-1 reflects the fact that E2F-1 is
targeted and phosphorylated by ataxia telangiectasia mutated/ataxia
telangiectasia and Rad3-related (ATM/ATR), and Checkpoint2 (Chk2) protein
kinases (Lin et al., 2001; Stevens et al., 2003) ( Figure 7), both of which are
integral components of the DNA damage signalling pathway. At present, it is
unclear whether ATM/ATR and Chk2 kinases co-operate in regulating E2F-1
activity in response to DNA damage, although it is the case that there is likely
to be crosstalk between these phosphorylation events. Whilst we await
resolution to the question of the relationship between ATM/ATR and Chk2 in
E2F-1 control, it is possible that multiple phosphorylation events ensure that
effector proteins are recruited and activated only upon complete activation of
the DNA damage response pathways. For example, ATM phosphorylation
may be required to prime E2F-1 for subsequent phosphorylation and
activation by Chk2 kinase. Alternatively, the level of phosphorylation may
modulate different properties of E2F-1; perhaps phosphorylation by ATM is
sufficient to signal cell cycle arrest, whereas induction of apoptosis requires
phosphorylation by both groups of kinases. The fact that multiple
phosphorylation events apply mainly to targets with pleiotrophic cellular effects
such as p53 lends some weight to this idea.
Figure 6: A role for E2F-1 in the control of proliferation, apoptosis and
DNA repair: (a) Under normal circumstances, E2F-1 regulates the expression
of genes required for cell cycle progression (b) In response to DNA damage,
E2F-1 is phosphorylated by ATM/ATR and Chk2 kinases, resulting in E2F-1
stabilisation. The high levels and/or modification of E2F-1 protein reached in
response to DNA damage may allow the binding and activation of a different
spectrum of genes involved in the induction of apoptosis (c) E2F-1 plays
additional roles, perhaps independently of its transcription factor activity, in
DNA damage repair and replication control (Stevens & La Thangue, 2004) .
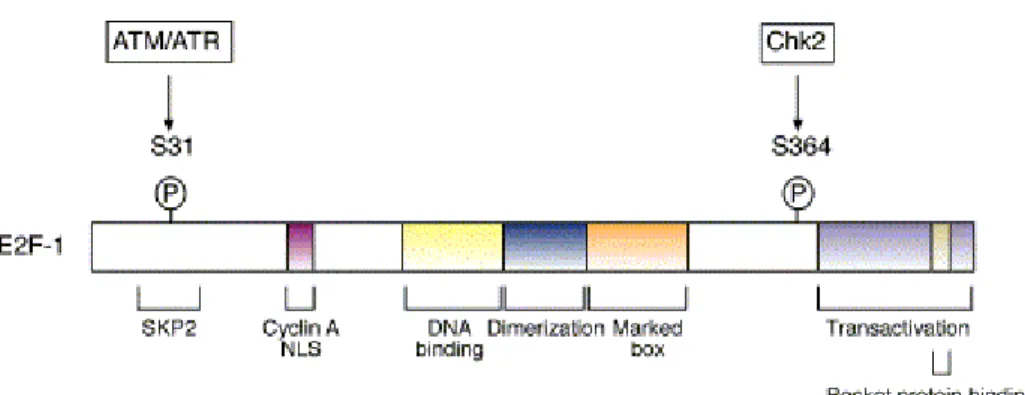
Figure 7: Domain organisation of E2F-1. Serine residue 31
(S31) phosphorylated by ATM/ATR, and serine residue 364
(S364) phosphorylated by Chk2 kinase in response to DNA
damage are indicated. E2F-1 has an N-terminal cyclinA/Cdk
binding site, a nuclear localisation signal (NLS), and a binding site
for the F-box protein Skp2, which is the cell cycle regulated
component of the ubiquitin protein ligase SCF
Skp2. The pocket-
protein binding and trans-activation domain are located in the C-
terminus. The position of the DNA binding, dimerization and
marked box domains are also shown. The dimerization domain
allows E2F-1 to interact with its heterodimeric partner, DP-1
(Stevens & La Thangue, 2004).
Nevertheless, the DNA damage responsive phosphorylation of E2F-1 has been clearly connected with increased E2F-1 protein stability and the induction of apoptosis, in a similar fashion to the control of p53 (Lin et al., 2001; Stevens et al., 2003). Given the established role of p53 in the DNA damage response and checkpoint control, it is highly likely that E2F-1 plays a similar role in checkpoint control.
The DNA damage-induced phosphorylation of p53 has been shown to promote the subsequent acetylation of lysine residues within its carboxy- terminal region, which enhances p53 DNA-binding and transcriptional activity (Sakaguchi et al., 1998). The phosphorylation of E2F-1 by ATM/ATR and Chk2 kinases may promote a similar outcome, and indeed the acetylation of E2F-1 has been connected with phosphorylation by ATM/ATR kinases (Pediconi et al., 2003). Degradation via the proteasome requires that proteins are first targeted for destruction by the ubiquitination of lysine residues (Ciechanover et al., 2000). Thus, it is tempting to speculate that the increase in E2F-1 stability observed in response to DNA damage could be the result of a phosphorylation-acetylation cascade that prevents the normal turnover of E2F-1.
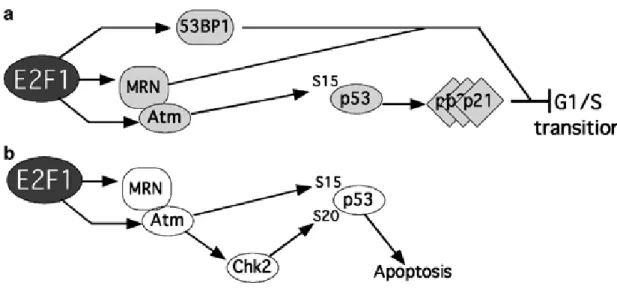
Several studies demonstrate that immediately following DNA damage
induced by IR or genotoxic drugs, DNA damage proteins relocalize to sites of
the double-stranded DNA breaks, for example, the MRN complex, 53BP1
(Nelms et al., 1998; Shiloh, 2003). A consequence of these events is the
activation of a cell cycle check point pathway through p53/p21
CIPthat is
dominant to E2F1-mediated apoptosis (Figure 8). To date, three pathways of
E2F1 induced apoptosis has been documented, which are (1) a p53-
dependent pathways through stabilization of p53 by E2F1; (2) p53-
independent pathways through direct upregulation of apoptotic related genes
by E2F1; (3) blocking of antiapoptotic pathways through downregulation or inhibition of antiapoptotic molecules (Bell & Ryan, 2004).
Whilst DNA damage provides a signal for E2F-1 to induce apoptosis, the mechanism through which E2F-1 causes apoptosis rather than cell cycle progression remains unclear. It has been suggested that different target promoters may be occupied by distinct E2F subunits, for example as cells progress through the cycle, but to date there is little evidence to support any promoter-specificity of E2F complexes (Takahashi et al., 2000). However, a recent study investigated E2F-1 gene specificity during the DNA damage response, observing that apoptosis-inducing genes like p73 rather than cell cycle genes were specifically targeted by E2F-1 upon DNA damage (Pediconi et al., 2003). This gene specificity was connected with an increased level of E2F-1 acetylation, and required the integrity of the S31 ATM/ATR kinase site (Pediconi et al., 2003). It is possible therefore that the DNA damage regulation of E2F-1 alters target gene specificity in such a fashion that apoptosis- inducing genes are favoured, and that the acetylation of E2F-1 plays an intimate role in this process.
Against this background, it remains possible that the level of E2F-1
protein influences the effects in cells. For example, a threshold E2F-1 level,
such as the high level reached in response to DNA damage, could determine
a particular outcome, perhaps by allowing a different spectrum of genes to be
activated. An equally valid model suggests that DNA damage and subsequent
phosphorylation promotes the interaction of E2F-1 with accessory proteins,
resulting in the activation of apoptotic target genes.
Figure 8: Model of the relationship between E2F1-mediated
check point and apoptosis pathway. (a) Dominant pathway
leading to a cell cycle check point. (b) Apoptosis signaling (Note
that a subset of factors function in both pathways) (Frame et al.,
2006).
When phosphorylated by Chk2, E2F-1 localises to distinct nuclear bodies with intense staining (Stevens et al., 2003). In this respect it is known that many proteins involved in the recognition and repair of DNA damage, including several activated by Chk2, localise to distinct nuclear foci most probably at sites of DNA damage (Rouse & Jackson, 2002). However, it is unclear if this location is connected with the apoptotic activity of E2F-1 or some other property of E2F-1 related to checkpoint control or DNA damage, although it is attractive to speculate that E2F-1 may have an additional role in the detection of DNA damage and, perhaps, its subsequent repair ( Figure 6c). In support of this idea, the Mre11–Nbs1–Rad50 checkpoint protein complex involved in responses to DNA double stranded breaks (D'Amours &
Jackson, 2002) associates with E2F-1 through the N-terminal region of Nbs1 (Maser et al., 2001). Furthermore, the Nbs1/E2F-1 interaction occurs close to these sites, suggesting that E2F-1 is required to target the Mre11 complex to origins of replication (Maser et al., 2001). Moreover, since Drosophila E2F and DP are present in origin recognition complexes (Bosco et al., 2001). It is possible that mammalian E2F-1 influences DNA replication upon DNA damage.
A recent study demonstrated that the DNA topoisomerase IIβ binding protein 1 (TopBP1) relocalises with E2F-1 to nuclear foci along with BRCA1 in response to DNA damage (Liu et al., 2003). The recruitment of E2F-1 to foci along with the BRCA1-repair complex and TopBP1 further supports the idea that E2F-1 is involved in DNA damage repair and replication control.
Combined with the earlier discussion, these results imply that E2F-1 is a multi-
functional damage responsive protein that is involved in numerous aspects of
the DNA damage response.
3. Thesis aims
The objective of this dissertation was to non-invasively assess E2F-1 dependent transcriptional regulation in vitro and in vivo.
It is known that frequently deregulation of the E2F-1 transcription factor via alteration of the p16-cyclinD-Rb pathway is a key event in the malignant progression of human gliomas. Several recent reports have described that the E2F-1 transcription factor serves as a link between Rb/E2F proliferation pathway and the p53 signaling pathway. In response to DNA damage, E2F-1 protein level is increased and induces p53 signaling .This leads to either cell cycle arrest followed by DNA repair mechanisms or apoptosis. In this regard, the overall goal of investigation was:
• Aim 1: To identify the basal level of E2F-1 expression following treatment with BCNU in human U87dEGFR glioma cell line.
• Aim 2: To generate a self-inactivating retroviral vector which carrying Cis-E2F-TA-LITG reporter system.
• Aim 3: To analyze the effect of BCNU in mediating E2F-1/ p53/
p21 signaling and blocking cell cycle progression.
• Aim 4: To study the efficacy of the Cis-E2F-TA-LITG reporter system by bioluminescent imaging in vitro and in vivo.
Due to the importance of E2F in the regulation of cell cycle progression and
their deregulation in cancer, these analyses could provide us the feasibility of
non-invasive monitoring of the kinetics of E2F-1-dependent reporter gene
expression in vitro and in vivo.
4. Results
4.1 E2F-1 expression in U87dEGFR cells is altered in response to BCNU treatment
After DNA damage, one consequence of a deregulated pRb/E2F pathway is an increase in E2F-1 protein level. To verify this in the human U87dEGFR glioma cell line, we measured the E2F-1 protein levels in cell extracts prepared from U87dEGFR cells after BCNU treatment by immunoprecipitation and Western blot. Proliferating U87dEGFR cells were exposed to BCNU (25 μM) and harvested 24h and 48h later. E2F-1 protein was immunoprecipitated by using monoclonal E2F-1 antibody and protein A/G-agarose. The E2F-1 protein level was checked by immunoblot analysis. As observed in Figure 1A, untreated cells show a basal level of E2F-1 expression which increased after exposure to BCNU with a maximum at 24 hours.
The densitometric quantification of E2F-1 expression as shown in
Figure 1B demonstrate the quantitative increase relative to the number
of U87dEGFR cells for three independent experiments. These results
indicate that BCNU treatment has a significant positive effect on the
E2F-1 protein level in U87dEGFR cells (p<0.001; Student t test).
24h+
BCNU 48h+
BCNU -BCNU
E2F1 Heavy IgG
chain Ab Light IgG chain Ab
Figure 1:
(A) A substantial induction of E2F-1 protein level in response to BCNU treatment
The E2F-1 protein level was shown in non-treated and BCNU
treated human U87dGEFR glioma cells at different incubation
times. The primary anti-E2F-1 antibody recognizes E2F-1 protein
at approx. 60 kDa (first band). The 55 kDa and 27 kDa heavy and
light IgG chains, respectively, of the primary antibody were also
detected.
Figure 1:
(B) A significant positive effect of BCNU on the E2F-1 protein level in U87dEGFR cells
The E2F-1 protein level was normalized with respect to cell number.Significant differences between BCNU-treated and non-treated cells (P<0.001; Student t test) are indicated by *. Error bars represent standard deviation.
The findings depicted in A and B represents the results of three independent experiments.
-BCNU 24h+BCNU 48h+BCNU
0,0 0,5 1,0 1,5 2,0 2,5
Optical density per cell number [arbitrary units]
E2F1 protein levels
*P=<0,001
*P=0,003
٭
٭
4.2 BCNU induces p53 and p21 expression in U87dEGFR cells
Given the fact that p53 protein plays an important role in protecting cells from the effects of DNA damage, we also evaluated p53 and p21 protein level in response to BCNU exposure by Western blot analysis. As shown in Figure 2, p53 and p21 levels increased in treated cells compare to non-treated cells with a maximum at 24h (p53) and 48h (p21 as downstream target for p53) following exposure to 25μM BCNU. Therefore we suspect that in response to treatment E2F-1 expression results in an increase in endogenous p53 protein levels.
Activation of p53 may leads in activation of a p21-dependent cell cycle checkpoint.
-BCNU 24h+ BCNU 48h+ BCNU
p53 Actin
p21 Actin Figure 2:
Induction of p53 and p21 protein levels in response to BCNU treatment.
Western blot analysis of p53 and p21 levels in non-treated and BCNU
treated U87dEGFR cells. The level of the actin protein is shown as a
loading control. Note that, as expected, p53, p21 and actin were
recognized by antibodies at approximately 50, 20, and 40 kDa,
respectively.
4.3 Characterization of E2F-1 regulated lucIREStkgfp expression in cell culture
To study drug dose- and time-dependent variations of luciferase gene expression in cell culture, U87dEGFR cell lines stably expressing firefly luciferase (luc) were engineered from different reporter vectors.
The generation of reporter vectors is described in Materials and Methods.
U87dEGFR cells expressing lucIREStkgfp (LITG) under transcriptional control of an E2F-1 responsive promoter (U87dEGFR- E2F-TALITG = test), minimal TA promoter (U87dEGFR-TA-LITG = non- regulated negative control), and LTR promoter (U87dEGFR-LITG = positive control), respectively, were seeded and treated with and without BCNU. Luciferin was added directly to the cell culture medium at different time points, and luciferase activity was monitored using the IVIS imaging system (Figure 3A). The light intensity was higher in U87dEGFR-E2F-TALITG cells as compared to non-regulated U87dEGFR-TA-LITG negative control cells. After BCNU treatment the bioluminescence signal intensity increased in U87dEGFRE2F-TA-LITG cells whereas no obvious change was observed between non-treated and BCNU-treated negative and positive control cells (Figure 3A).
For quantitative analysis of different levels of LITG expression
(luciferase component) in response to BCNU a microplate reader was
used. A 3.6-fold difference was observed in U87dEGFR-E2F-TALITG
cells as compared with non-regulated U87dEGFR-TA-LITG negative
control cells with respect to the basal bioluminescent signal (Figure
3B). In U87dEGFR-E2F-TALITG cells the expression of LITG increased
4.0-fold in response to BCNU exposure whereas no significant increase was observed in negative (U87dEGFR-TA-LITG) and positive (U87dEGFR-LITG) control cells (Figure 3B). These findings were confirmed by quantification of the relative green fluorescence signal per single cell using the MPI-tool imaging software (MPI, Cologne,Germany)
4showing a significant increase (1.9-fold) of green fluorescence in U87dEGFR-E2F-TA-LITG cells in response to BCNU treatment (Figure 3C).
The co-localization of IRES-mediated co-regulated LUC and TKGFP protein co-expression in cells carrying the E2F regulated LITG construct is depicted in Figure 3D.
Taken together, these data indicate that the light production from
E2F stably expressing cells correlate with other indicators of cell cycle
progression and DNA damage signals.
E2F
Negative control
Positive control
+BCNU -BCNU
Figure 3:
(A) Bioluminescence imaging of E2F transcriptional activity induced in cell culture
E2F-responsive transcriptional activity was imaged by the IVIS
imaging system. Measurements were made in U87dEGFR-E2F-
TA-LITG glioma cells (first row) in comparison to U87dEGFR-TA-
LITG (middle row) and U87dEGFR-LITG (third row) glioma cells.
Figure 3:
(B) Positive effect of BCNU on the Bioluminescence output related to E2F transcriptional activity
Relative E2F transcriptional activity is quantitated by microplate reader. U87dEGFR-E2F-TA-LITG cells have a significantly higher signal in comparison to negative control U87dEGFR-TA-LITG cells (t-test; P=0.029).After BCNU treatment, luciferase signal increases significantly in E21- regulated U87dEGFR-E2F-TA-LITG cells (t-test; P<0.001), but not in negative and positive control cells.
E2F-BCNU E2F+BCNU Neg-BCNU Neg+BCNU Pos-BCNU Pos+BCNU 0
100 200 300 400 500 600 700
RL U
٭٭
٭٭ ٭
٭
Figure 3:
(C) Intensity of green fluorescence in response to BCNU correlates with E2F activity in response to BCNU treatment.
Relative intensity of green fluorescence as recorded in single cells by mean of a ROI analysis using MPI-tool imaging software4 indicating again a significant induction of luciferase signal after BCNU treatment in E2F-1-regulated U87dEGFR- E2F-TA-LITG cells.
E2F-BCNU E2F+BCNU Neg-BCNU Pos-BCNU 0
5 10 15 20 25 30 35 40 45 50 55 60
RFU
Figure 3:
(D) Assessment of the Cis-E2F-TA-LITG reporter system by immnuo fluorescence microscopy
Co-localization of LUC and GFP in U87dEGFR-E2F-TA-LITG cells as compared with non-regulated negative (U87dEGFR- TA-LITG) and positive (U87dEGFR-LITG) control cells, U87dEGFR cells stably expressing luciferase were subjected with anti-LUC and fluorescence microscopy.
E2F
LUC
Negative
control Positive control
GFP
Luc
+
GFP
4.4 BCNU treatment leads an arrest in dose dependency manner
Cell cycle arrest is a common response to DNA damaging agents. Given the up-regulation of E2F-1 in response to BCNU treatment and the role of E2F-1 in cell cycle regulation, we examined the possible contribution of alkylation-induced arrest on cell cycle progression using flow cytometry. We evaluated the cell cycle distributions of U87dEGFR-E2F-TA-LITG cells following exposure to different doses of BCNU. As shown in Figure 4, 24h after exposure there was a dramatic increase in S-phase populations in treated cells compared with non-treated cells. In addition, a substantially increase in G1-phase was only observed at the highest does of BCNU.
Accumulation in S/G2 phase following BCNU exposure suggests that
significant proportion of cells were unable to complete DNA synthesis
and continue with cell division. Likewise, Cells gave stronger response
at the highest does of BCNU.
Figure 4:
Graphs depict cell cycle distributions of U87dEGFR-E2F-TA- LITG cells.
Cell cycle distributions were underwent sustained S/G2-phase arrest following treatment with different concentrations of BCNU.
Of note, a greater proportion of cells accumulated in G1-phase at the highest BCNU concentration.
G0/G1: 47,01% G0/G1: 27,94%
S: 27,81% S: 34,88%
G2/M: 16,21% G2/M: 20,44%
G0/G1: 20,48%
S: 43,98%
G2/M: 24,12%
G0/G1: 18,45%
S: 44,82%
G2/M: 25,07%
G0/G1: 36,75%
S: 40,47%
G2/M: 11,48%
-BCNU +BCNU
15 µM
25 µM
35 µM
45 µM DNA content
Cell
number
4.5 BCNU treatment induces apoptosis
To further investigation, the effect of BCNU in induction of
caspase-mediated apoptosis was evaluated by measuring the activation
of caspases- 3/7 in cells treated with BCNU. The semiconfluent
monolayer of cells was treated with BCNU for 24h to measure the
induction of caspase-3/7. Although BCNU increased the activities of
caspase-3/7 in cells with different concentrations of BCNU, the
activation of caspase-3/7 was significantly more prominent from 25 µM
BCNU concentrations. The caspase-3/7 activity in cells treated with the
45 µM concentration was lower, probably due to the cytotoxic effect of
BCNU at this concentration (Figure 5).
Figure 5:
The effect of BCNU (15-45 µM) on caspase-3 activity in U87dEGFR-E2F-TA-LITG cells
The activities of caspase-3/7 were measured using the Caspase-Glo 3/7 kit (Promega Corp., Madison, WI) in U87dEGFR-E2F-TA-LITG cells. Cells were cultured in 96-well plates until they achieved semiconfluency and then treated with the indicated concentrations of BCNU for 24h. The Caspase-Glo 3/7 reagent (100 µl) was added directly to the wells and plates were incubated for 1h before recording the luminescence reading. Each value represents the average of at least three different values.
0 15 25 35 45
0 5 10 15 20 25
30 P=0.002
P=0.01 ٭
P=0.008 ٭٭ ¥
٭
¥
٭٭
RLU
BCNU µM
4.6 Visualization of E2F-1 transcriptional activity in vivo
In order to access the efficacy of the Cis-E2F-TA-LITG reporter
system in vivo, each cell line was implanted subcutaneously into four
sites of nude mice: U87dEGFR-E2F-TALITG (test; n=2), U87dEGFR-
TA-LITG (non-regulated negative control; n=2), U87dEGFR-LITG (non-
regulated positive control; n=2). Experiments were repeated twice
resulting in n=6 animals per cell line. Seven days later, half of the
animals were injected with BCNU (25 mg/kg, i.p.) to induce E2F activity
in response to DNA damage. After intraperitoneal administration of
luciferin, mice were imaged daily with the Xenogen IVIS system (Figure
6A). As expected, the non-treated test mice bearing U87dEGFRE2F-
TA-LITG gliomas showed a 2.5-fold higher basal intensity of
bioluminescence signal as compare to mice bearing non-regulated
U87dEGFR-TA-LITG negative control gliomas. In BCNU-treated test
mice, a 1.9-fold induction of bioluminescence intensity was observed
24h after treatment with BCNU. No significant changes were found
either in non-treated test mice or in negative and positive controls mice
(Figure 6B). These results indicate that the activity of endogenous E2F-
1 protein and its regulation by an exogenous stimulus (BCNU) in glioma
cells can be detected and quantified nonnvasively in vivo.
-BCNU +BCNU
0h 24h
0h 24h
0h 24h
0h 0h 24h
0h 24h
0h 24h 0h 24h 0h 24h E2F
Negative control
Positive control
Figure 6:
(A) Bioluminescence imaging of endogenous E2F-1 in vivo The colour scale represents luminescent signal intensity, with blue indicating the least intense and red the most intense light.
BLI signal increases after addition of BCNU in mice bearing
U87dEGFR-E2F-TA-LITG gliomas (first row). Negative control
mice bearing U87dEGFR-TA-LITG gliomas exhibit background
signal only (second row). Positive control mice bearing
U87dEGFR-LITG glioma exhibit high BLI signal independent on
BCNU treatment.
Figure 6:
(B) Mean of the total bioluminescent signals emitted from s.c.
tumors in response to BCNU administration.
Data are representative of 3 independent experiments with n=6 per group. Upper- left graph represents data from mice bearing E2F-1 responsive U87dEGFR-E2F-TA-LITG gliomas. Upper- right graph represents data from mice bearing U87dEGFR-TA-LITG negative control gliomas. Lower graph represents data from mice bearing U87dEGFR-LITG positive control gliomas. Significant differences (Student t test; P =0.01) are depicted by *.
E2F-0h E2F-24h E2F-0h E2F-24h
0,00E+000 2,00E+007 4,00E+007 6,00E+007 8,00E+007 1,00E+008 1,20E+008 1,40E+008 1,60E+008 1,80E+008 2,00E+008 2,20E+008 2,40E+008
٭٭
RLU
٭٭
Neg-0h Neg-24h Neg-0h Neg-24h
0,00E+000 2,00E+007 4,00E+007 6,00E+007 8,00E+007 1,00E+008 1,20E+008 1,40E+008 1,60E+008 1,80E+008 2,00E+008 2,20E+008 2,40E+008
+BCNU -BCNU
٭
RLU٭
Pos-0h Pos-24h Pos-0h Pos-24h
0,00E+000 5,00E+007 1,00E+008 1,50E+008 2,00E+008 2,50E+008 3,00E+008 3,50E+008 4,00E+008 4,50E+008 5,00E+008 5,50E+008 6,00E+008 6,50E+008 7,00E+008
+BCNU -BCNU
RLU