Biol. Cybern. 66, 37-47 (1991)
Biological Cybemetics
9 Springer-Verlag 1991
An evaluation of sensory noise in the human visual system
U. Mortensen and U. Suhl
FB Psychologic der Westf/ilischen-Wilhelms-Universit[it, Institut III, Fliednerstrasse 21, W-4400 Miinster, Federal Republic of Germany Received February 4, 1991/Accepted in revised form July 12, 1991
Abstract. It is assumed that the activity o f a visual channel may be represented as V(t) = g(t) + ~(t), where g(t) is the deterministic response o f the channel due to the presentation of a stimulus and ~(t) is the trajectory o f a wide-sense stationary Gauss process. The stimulus is detected if the event { V ( t ) > S for at least one t ~ [0, T]} occurs. Two approximations for the proba- bility o f this event are proposed, and it is demonstrated how they may be employed to estimate (i) the value of the second spectral m o m e n t 22 of the noise process ~,, where 22 reflects the speed o f the fluctuations o f the trajectories ~(t), and (70 the value o f the internal threshold S. The commonly made assumption of peak - detection is shown to serve as a very good first approximation in particular if the channel is o f tran- sient type o r - in case o f detection by a channel of sustained t y p e - if the stimulus durations are not t o o long.
1 Introduction
In this paper, some estimates o f characteristics of the noise within the visual system will be derived from psychophysical detection data. At the same time we arrive at an evaluation o f the frequently made assump- tion o f peak-detection as compared to that o f detection by temporal probability summation (TPS). It is assumed (i) that the sensory activity may be represented as a nonstationary stochastic process, (ii) that detection is a level-crossing process.
We present two approximations for the probability o f such level-crossings. They will be employed to esti- mate (i) the rate o f fluctuation of the noise and (ii) the value o f an internal threshold.
It will be shown that the classical postulate of peak-detection may be considered as a special case o f a level-crossing process. Peak-detection allows a very di- rect interpretation o f detection thresholds, provided the system is linear: the reciprocal of the threshold contrast or intensity is proportional to the maximum value o f
the (mean) response. Clearly, such estimates of the maximum value will be distorted when the assumptions o f linearity and peak-detection are not justified. Peak- detection may hold as an approximation if either the noise fluctuates very slowly compared to the course o f the mean activity caused by the stimulus, or if the noise fluctuates fastly, and the internal threshold is high compared to the maximal value of the mean activity and the variance o f the noise process. If neither o f these conditions is met the firm belief in peak-detection leads to the conclusion that the nonlinearities o f the visual system have to be taken into account even for threshold contrasts (Rashbass 1970, Kelly and Savoie 1978).
However, what appears to be an essential nonlinearity (Kelly and Savoie 1978) may equally well be an effect of TPS.
A popular approach to detection by TPS makes use of the Weibull-distribution and will henceforth be re- ferred to as Weibull approximation. This approximation has been suggested by a number o f authors (Broekhuy- sen et al. 1976; Rashbass 1976; Watson and Nachmias 1977; Watson 1979). The motivation behind our search for alternative approximations stems from the fact that for reasons that will be elaborated in greater detail later the We{bull-approximation as proposed by the above mentioned authors is unsatisfactory.
There exist no general, closed expressions for the probability of a level-crossing by a non-stationary stochastic process. Summaries of attempts to find at least approximations for the probabilities of such cross- ings may be found in C r a m r r and Leadbetter (1967), Blake and Lindsay (1973) and Leadbetter et al. (1983).
However, none o f these attempts suits the demands o f psychophysics. The two approximations that will be presented here appear to work well. One is due to Hiisler I (1986) and is based on results from extreme value theory; Hiisler follows the classical line of attack-
i We would like to express our gratitude to J. Hiisler from the Department of Mathematics, University of Berne, for his generous cooperation
ing the problem o f level-crossings by chopping the interval [0, T] into sub-intervals and deriving the distri- bution o f the maximum of the maxima within these sub-intervals. The other is due to Ditlivsen (1971) who arrived at his approximation in quite a different way: he considered the probability of a level-crossing in a sub- interval given that a level-crossing did not occur in the preceding sub-interval. The relative merits of the two approximations will be discussed. In any case our com- putations suggest that the noise is fluctuating very fast, indicating that for all practical purposes it may be considered as "white".
2 Detection processes 2.1 Basic notions
The activity in visual channels as generated by some stimulus pattern depends upon (i) the stimulus contrast or intensity m, (ii) the values r o f parameters character- ising specific features o f the pattern, like its duration or temporal frequency.
A trial will be represented by the closed interval [0, T], where T represents the duration o f the trial (not o f the stimulus presentation). Let M = ff~ be the set o f contrasts from which the values for m are chosen.
Further, let Q = R be the set o f parameter values considered. Such a parameter may be the duration o f the stimulus, its spatial or temporal frequency, etc. Let s(m, r) be a stimulus pattern employed in the experi- ment. F o r each r ~ Q, the mapping P~ : M ~ (0, 1) will be called psychometric function; P , ( m ) e ( 0 , 1) is the probability o f a detection response given the stimulus pattern is defined by s = m ~ , ~ the function defining the pattern. The set ~ = {P~; r ~ Q} will be called a psychometric family, this notion was introduced by Falmagne (1982) and turns out to be o f importance in the present context because properties o f the detection process may be inferred from properties of classes o f psychometric functions. F o r the rest of the paper m a x t f ( t ) will denote the maximum o f the function f(t) over J = [0, T].
Assumptions: (i) The activity o f a detecting channel is supposed to be representable by a stochastic process Vt = {V(t); t e [0, T]); (ii) V(t) = g ( t ) + ~(t), where 4 ( ) is a trajectory o f a stochastic process 4t represent- ing stationary noise with E(~(. )) = 0 for all t ~ [0, T], and g(t) represents the mean activity o f the channel at time t e [0, T] for the given stimulus pattern. (iii) There exists an internal threshold with value S such that the stimulus is detected if X = max, (V(t)) > S.
Definition 1: If the assumptions (i) to (iii) hold, detec- tion is said to be by temporal probability summation (TPS).
g is a deterministic function o f t (time) depending upon parameters characterising the system as well as upon m and r. X may be considered a r a n d o m variable and represents the maximum value o f the activity during a
given trial. The probability of detection may now be expressed with reference to the distribution o f the ran- dom variable X as
Pr(m) = 1 - ( 1 - T)P(X ~ S), (2.1) where ~ is the probability of guessing that a stimulus was presented in a blank trial. The probability Po = P ( X > Sire = 0) will be called the probability of a false alarm. This term may apply more adequately to Pr(0); however, our definition of the term serves to simplify our language within our context.
The explicit definition o f peak-detection will be postponed until Sect. 2.3.
2.2 Approximations for P ( X <~ S)
The approximations to be presented depend upon two parameters, the internal threshold S and the second- spectral moment 2~, reflecting the speed of fluctuation of the noise. The meaning of 22 may be explicated as follows. Let R(t) be the autocorrelation function of the noise it allowing for the representation R ( t ) = 1 -2ztZ/2 +o(t 2) for t ~ 0 which may be considered as the first terms of a Taylor-series. Then, formally, 22=
- R " ( 0 ) , with R"(O) the second derivative o f R at t ---0.
If R(t) is sharply peaked at R(0) the random variables
~(t) and r + E) for E > 0 representing the values of the noise at times t and t + ~ will not be highly correlated even if E is small and consequently the trajectories o f 4, will fluctuate fastly; we will then expect a large value for 22. Correspondingly, for 22 small R(t) will be fiat, so that there is a high correlation between neigh- bouring values o f 4(0, i.e. the ~(t) fluctuate slowly.
a. Hiisler's approximation. The interval J = [0, T] may be divided into n disjoint intervals Ji o f length At such that T = nAt, or At = Tin. F o r the ith interval Ji let X ~ = m a x , ~ j , V(t), V(t) a trajectory o f Vt. Then X ~ m a x ( X ~ , . . . , Xn), so that the distribution function of X is that of an extreme value of the X;. Clearly, the X, will not be independent in general, and it is the dependencies among the Xi that cause the difficulties in deriving the distribution function P ( X <~ S) o f X.
Let R(t) be the autocorrelation function o f the noise process 4t- To tackle the problem of finding at least an approximation for P ( X <~ S) we may make use of the notion o f asymptotic independence. A detailed explica- tion o f this concept cannot be given here, see Leadbet- ter et al. (1983). Roughly, asymptotic independence means that
provided that R(t)--+0 for t--+ oo (and consequently T ~ oo) and S --+ oo in an appropriate way. We present now a theorem derived by Hfisler (1986):
Theorem 1: Suppose that 4t is a wide-sense stationary Gauss process with E(~(t)) = 0, E(~Z(t)) = 1 and auto- correlation function R satisfying R(t) = l -- 22t2/2
+o(t z) as t-+O, 42 = - - R " ( 0 ) < oo. Then, for suffic- iently high value o f S,
P ( X <~ S) ~ e x p ( - ~ - ~ i exp[- 89 " (S - g(t))2] dt ) . (2.2) The proof of the theorem may be found in the Ap- pendix; it is of interest when compared with the deriva- tion of the Weibull approximation. Obviously, P ( X ~ S) is related to the double exponential distribu- tion e x p ( - e x p ( - x ) ) ; this is the limiting distribution for extremes of independent Gaussian random vari- ables.
b. Ditlivsen's approximation. A detailed presentation of Ditlivsen's derivation is beyond the scope of this paper, we just sketch the main path of his argumentation.
Let us introduce the abbreviation
a(t) .-= S - g(t) . (2.3)
The probability of not detecting the stimulus is given by P ( X ~< S) = P(r ~< a(T), Vz 9 [0, T]). Let us define the probability
F(x, t) :=P(~(z) ~< a(z), Yz 9 It, t + x]). (2.4) Clearly, for t = 0 and x = T we have F(T, O)= P(X<<. S). Ditlivsen starts with the known fact that for short intervals [t, t + x] the probability of a level-crossing may be approximated via the joint density function f of u .-= ~(z) and v ,= r + x):
F(x, t) = P(r ~< a(t) c~ r + x) <<. a(t + x)) + o(x)
a ( t ) a ( t + x )
= S S f(u, v) du dv x o(x),
- c ~ - o o
with o(x)/x-+O as x - + 0 . (2.5) The problem is then to relate (2.5) to (2.4) in particular for t = 0, x = T; here, we just present the result:
Theorem 2: Let Ct be a wide-sense stationary Gauss process with E ( ~ ( t ) ) = 0 and E(~Z(t))=1 for all t 9 [0, T], and suppose the autocorrelation function o f 4, satisfies R(t) = 1 - 2ztz/2 + o(t 2) as t --+0. Suppose fur- ther that (2.5) holds (and F(x, t) is defined as in (2.4)). Let a'(t)__~ da(t)/dt = - dg(t)/dt = - g'(t), f(u) = exp(-uZ/2)/x/2rt the Gaussian density function, and 9 (u) = SL~oc(t) d t the ~ n d i n g distribution func- tion, and 7 = x/2z = x~-R"(O), 22 the second spectral moment o f r Then
T F _ P ( X ~< S) = ~(S) exPL-S0 L 7J ~ - )
{g'(t)) "t" ] f(a(t))
+ ~ 7 ) g L ) J ~ ( a ( t ) ) dt" (2.6) A proof of this theorem will not be given here for lack of space; a sketch of the proof of the theorem will be made available on request (Mortensen and Suhl 1990).
The validity of (2.6) has been evaluated by Ditlivsen
(1971) by simulation studies; the expression (2.6) pro- vides excellent approximations for the level crossing probabilities considered here.
c. Some properties o f Hiisler's and Ditlivsen's approxi- mations. The assumption that detection by TPS is de- tected by the crossing of a (threshold) level S implies that two parameters, S and 22, have to be estimated.
If m = 0 then g(t) = 0 for all t 9 [0, T]. If we let To denote the duration of a blank trial we have
P0 = 1 -- e x p ( - A ) , (2.7)
with A = T0w/~2. exp(-$2/2)/2rc for H/isler's and A = Tov~2" exp(-SZ/2)/(2rc~(S)) + log ~(S)
for Ditlivsen's approximation. Hiisler's and Ditlivsen's expressions for P0 become equivalent for ~(S) ~ 1. If we let 22 -+ 0 in Hiisler's approximation we find Po -+ 0, while from Ditlivsen's expression we find P0 -+ 1 - q~(S) > 0 if ~(S) < 1.
For Po > 0 the expressions for A in (2.7) show that then S and 22 cannot be chosen independently of each other. As may be seen from the expressions for A a given value of Po > 0 is not tied to a particular pair o f values for S and 22 =22(S); which combination o f values for S and 22 is the most adequate one has to be determined by other aspects of the data. Note that the relation between S and 22 is strictly increasing.
Although the approximations of Hiisler and Ditlivsen appear to be quite different it turns out that they lead to equivalent estimates for S and 2z(S) for given values of P0 for sufficiently high values of S. For lower values of S estimates based upon Hiisler's ap- proximation become less reliable because the approxi- mation is based upon extreme value statistics. Therefore it is valid only for S --+ o% i.e. for S > 3, say, since for a standard Gauss-variable the probability o f exceeding the value S = 3 is already relatively small. Ditlivsen's approximation is applicable for smaller values of S as well, however at the price of higher computing costs compared with those associated with Hiisler's approxi- mation.
d. Weibull approximations. We briefly consider the Weibull approximation for detection by TPS mentioned in Sect. 1 and currently held under high esteem by vision researchers. The expression is based upon the Weibull distribution. As in Hiisler's approximation the interval [0, T] representing a trial is subdivided into n subintervals of length At such that T = nAt. For the ith interval the probability of not detecting the stimulus is assumed to be given by q(ti)= e x p ( - [g(t,)la), where fl is a free parameter meant to reflect the "effect o f noise", g depends upon the parameters m and r. Then detection in the different intervals is postulated to be stochastically independent, so that the probability of detection is given by P r ( m ) = l - ( 1 - 7 ) x e x p ( - E ~ l g ( 4 ; m , r)lB), where ~ is again the probability of guessing that a stimulus was presented in a blank trial. Then a passage to the limit, with n -+ ~ , A t -+ 0, is
postulated, and the result
P r ( m ) = l - ( 1 - y ) e x p ( - _ ~ S [g(t)] ~ d t ) (2.8) is announced (Broekhuysen et al. 1976; Rashbass 1976;
Watson et al. 1977; Watson 1979, 1982). Blommaert and Roufs (1987) replace the integration interval ( - ~ , ~ ) by [0, T].
There are several difficulties associated with (2.8):
(i) it is not clear why in a given subinterval the proba- bility o f not detecting should be given by q(ti) = e x p ( - I g ( t i ) [ ' ) . The fact that the Weibull distri- bution has its merits in the theory of reliability o f materials cannot yet be a sufficient reason for its choice.
The detection process itself is not specified, i.e. it is not clear whether the detection process is assumed to be a level-crossing or to be o f some other nature; (ii) the process o f passing to the limit is rather obscure, it remains unclear why for n - - * ~ , A t ~ O the q(t~) can simply be replaced by q(t). The assumption o f stochas- tic independence o f detection events in neighbouring intervals will not hold for A t ---, 0 and n ~ ~ unless the underlying noise process is assumed to be white noise.
However, it is by no means clear why we should assume white noise a priori, and so the dependencies among the
"noise"-fluctuations at times t and t + E, E > 0, are not adequately dealt with. (iii) F o r m = 0 the probability Po equals zero; false alarms are due to guessing only. This may be so in certain experiments, but modelling detec- tion by TPS should at least allow for the possibility of
" t r u e " false alarms (cf. Nachmias 1981).
A different derivation o f the Weibull approximation was provided by Maloney and Wandell (1984); their work may be criticised along similar lines.
2.3 Peak-detection
We now provide a formal definition of peak-detection in order to avoid ambiguities that appear to be con- nected with this concept.
Definition 2: Let g(t; m, r) denote the mean-value func- tion o f the stochastic process representing the activity o f the detecting system, with stimulus parameters m ~ M, r ~ Q, and let go = maxtg(t; r) be representable by a strictly increasing mapping g o : M ~ R. F o r fixed r e Q let Gr = got(M) ~ R. Suppose that for r e Q the psychometric functions are representable by strictly in- c r e a s i n g mappings P~ : G~ ~ ( 0 , 1), i.e. P,(m) = P(go~).
Then detection is said to be peak-detection, and the psychometric family ~r ~ = {P~; r ~ Q} will be said to be a peak-detection family.
The definition o f peak-detection given here does not contain any reference to the noise process. This lack is also found in the usually less explicit definitions found in the literature (e.g. Roufs 1974; Kelly and Savoie 1978; Roufs and Blommaert 1981). A characterisation o f the noise compatible with peak-detection will be given, together with some further implications of peak- detection, in T h e o r e m 3; to prepare the presentation o f the theorem we introduce the following concept:
Definition 3: Let, for given r ~ Q, mo = mo(r) be the value of m e M such that Pr(mo) =Po a certain con- stant, say P0 = 1/2. Let x[m0(r)] = dPr(m)/dmlm=mo be the slope of Pr(m) at m = too(r). Then
q~ ..= 1/[mo(r)Z(mo(r)) x / ~ ] (2.9) will be called the generalised Crozier quotient.
If the psychometric function can be expressed in terms of a Gaussian distribution function it is easily shown that qr as defined in (2.9) equals the ratio ar/#r, where
#r is the standard deviation of the Gaussian density of m and /~ is the corresponding expected value; in this form the quotient qr was originally introduced by Crozier (1935/1936). If the psychometric function P~ is indeed given by a Gaussian distribution function ~ may be determined from the slope o f Pr in mo. Crozier found that the ratio qr is practically constant. This is known as Crozier's law, and ar/Pr is known as Crozier's quotient ( L e G r a n d 1968, p. 269). We will speak of Crozier's law if qr as defined in (2.9) equals a constant on Q without assuming that the psychometric function is necessarily Gaussian. In any case can the slope of P~
be determined empirically and consequently q~ may be computed for any empirically determined psychometric function without any specific assumption about P , N o w most of the published values o f the Crozier quo- tient are based on the Gaussian assumption and have been computed according to (2.9) (e.g. Blackwell 1963), and so we will compute the quotient analogously al- though our psychometric functions are not Gaussian. A discussion o f some implications of Crozier's law may be found in LeGrand (1968).
Definition 4: Let ~ff be a psychometric family whose members are parallel when plotted on a log(m)-scale.
Then the Pr e ~ will be called log-parallel and/~ will be called a log-parallel family.
Let x = l o g ( m ) and let F~(x)~=P,(eX),Fs(x),=Ps(eX), r e Q, s ~ Q, be two psychometric functions that are parallel on the log(m)-scale. This means that there exists a constant ~(r, s) independent o f x, with Fr(x) = Fs(x + ~(r, s)) for all x. With ct(r, s) =log[b(r, s)]
we have then P r ( m ) = P s [ m . b(r, s)], i.e. any two psy- chometric functions Pr(m) and Ps(m) from J g differ with respect to a factor b(r, s) of the independent variable m. We may generally write P , ( m ) = P(ma(r)) with a(r) = b(r, so) for a certain reference value So.
The purpose of the following theorem is to make explicit the implications and predictions o f peak-detec- tion in the strict sense of Definition 3. The data are indicative of detection by TPS when these implications cannot be observed.
Theorem 3: Let ~ be a psychometric family such that each Pr ~ ~ is differentiable with respect to m ~ M and r ~ Q. Then the following statements hold:
(i) Suppose that the stimulus is detected if X = maxt(g(t) + ~(t)) > S. Then detection ispeak-detec- tion as defined in Definition 3 if and only if the trajecto- ries ~ o f the noise process it are constants (almost surely,
i.e. trajectories that are not constants have probability measure zero) varying randomly only between trials.
(ii) I f ~ is a log-parallel psychometric family and if the Pr ~ ~ are strictly increasing with m E M, then Crozier's law holds for rig.
(iiO Let ~ be a peak-detection-family and let the detecting channel be linear; then A is also a log-parallel psychometric family.
The proofs of the statements may be found in the appendix. Statement (i) characterises the "noise". One may say that in case of peak-detection the noise consists of a random shift of the internal threshold according to some distribution function; within the trial [0, T] the threshold remains constant. As indicated above this is certainly an idealisation. Consequently the statements (ii) and (iii) will be reflected in empirical data at best in an approximative sense. Since peak-detection (in the strict sense of Definition 3) implies that the noise trajec- tories are constant during a trial one condition under which the assumption of peak-detection may be em- ployed as an approximation is characterised by a small value of 22, such that the fluctuations are slow com- pared to the changes of g.
Let us briefly consider Hiisler's and Ditlivsen's ap- proximation for the case 22---, 0. In this case Ditlivsen's approximation converges towards the expression for peak-detection in the strict sense. The case 22--* 0 is not covered by Hiisler's approximation: it follows from (2.2) that for 22 ---, 0 P ( X <<, S ) ~ 0 regardless of which g(t) is generated by the stimulus presentation. Hiisler's approximation is no longer meaningful for small values of 22 because it rests on the assumption of asymptotic independence of neighbouring values of the ~(t) (see the proof of (2.2)); the approximation is therefore applica- ble only if 42 assumes greater values. This does not mean that Hiisler's approximation cannot be used if peak-detection holds as an approximation: from Defini- tion 2 one may also conclude that the peak-detection approximation may hold if an arbitrary, in particular high value of 22 accompanied with a high value of S is given, such that a level-crossing can occur only in the vicinity of the maximum of g.
Statements (ii) and (iii) imply that if detection is peak-detection, then Crozier's law holds. However, Crozier's law does not, in general, imply peak-detection and therefore not log-parallelity. A violation of Crozier's law implies a lack of log-parallelity and points to detection by TPS. Log-parallelity and therefore the validity of Crozier's law, on the other hand, does not necessarily exclude detection by TPS; for instance, psy- chometric functions defined in terms of the Weibull distribution as in (2.8) respresent a log-parallel psycho- metric family. Note that constant Crozier quotients do not imply constant slopes of the psychometric func- tions. Further, a value of P0 > 0 is compatible with peak-detection in the sense of Definition 3 and there- fore not yet indicative of detection by TPS. Rather, TPS is indicated by a violation of Crozier's law or, even better, by a lack of log-paraUelity of psychometric functions. We introduce therefore
Definition 5: The violation of Crozier's law and, conse- quently, of log-parallelity of psychometric functions will be called the effect o f temporal probability summa- tion.
3 Application to detection data
3. I Estimation o f S and 2 2 f r o m flicker detection data Let the stimulus be a sinusoid that is gated in order to avoid transients. Let f be the temporal frequency and k the number of complete cycles (Fully Fledged Cycles, FFC), and suppose that for each element of a set {(f, k)} the corresponding threshold modulation m k ( f ) is determined. The data from such an experiment, which was actually carried out by Roufs (1974), may be employed to estimate the values of S and 22.
To begin with, suppose that peak-detection in the strict sense, i.e. ~(. ) = ( during a trial of length less than some critical duration To, holds. Then the value of m k ( f ) for different values of k, such that the total duration of the stimulus presentation is less than To, should be the same, since then the probability of detec- tion depends only upon maxt g(t). However, this predic- tion does not correspond to Rouf's finding, which may be summarized as
log m k ( f ) = t " log k +/~, (3.1) with fl < 0 independent o f f , and/t = p ( f ) . This may be interpreted as indicating somehow the effect of tempo- ral probability summation.
Hiisler's and Ditlivsen's approximation are of the form P ( X > S ) = 1 - e x p ( - S r q ~ ( t ) dt). ~b depends upon the parameters S and 22. Here we identify, for given value of the frequency f, the parameter r with the number of cycles, i.e. r = k . Now P k ( m k ( f ) ) = P 0 a constant iff S r ~b(t; S, 22) dt = Io a constant depending upon the value of Po (i.e. Io = - l o g ( 1 - P o ) ) . Recall that for a linear system with constant coefficients the response to m. sin(tot) is given by g(t)=
m [H(to)[ sin(tot + ~o(to)). Because the stimuli were gated we may neglect the onset and offset parts of the re- sponses and identify (i) t = 0 with the start of the first full cycle, and (ii) t = T with the end of the last full cycle. Thus we get rid of the problem of having to find an estimate of the phase shift ~0(to) so that we may put g(t) = m k ( f ) l n ( t o ) l sin(tot), with to = 2~zf Since 4~(t) = q~(t + 2r 0 and the duration of a single cycle equals 1]f we have So q~(t) dt = k S~/f gp(t) dt = T
k S~/f dP(mk IH(to)l sin(tot)) dt. Employing the substitu- tion u = cot we have, since to = 2rcf' for the integral
T
Io = S ~b(t) dt
0 k 2g
= -~ ! 4~[mk(f)lH(to) I sin u; S, 22] du. (3.2) The values of i n k ( f ) are computed from (3.1), using the empirically determined values of fl and #. Clearly, the values of ~b(t; S, 22) in (3.2) can be computed only if
the values o f IH(to)l are given. Usually, the reciprocal threshold values are taken as estimates for In(to)l;
however, these estimates are based on the assumption of peak-detection, and we do not know at this stage whether the assumption is justified. Consequently, the
IH(to)l have to be estimated alongside with S and 22 .
The values of S and 22 have to satisfy the following conditions:
(i) They have to be related to the value of Po by (2.1), depending upon which approximation is chosen.
(ii) For the chosen S and 22 estimates should exist for [H(to)[ that are constant for all values of the number k of cycles, for a given value o f f .
(iii) The Crozier-quotients qr computed for the the- oretical psychometric functions should be about con- stant, i.e. for all r, qr ~ q and the value of q is specific for the subject whose data are considered.
Generally, the duration T O of a blank trial was taken to equal 2 s. The empirical Crozier quotients t~(f) for the different temporal frequencies f satisfied the condition ~ ( f ) ~ .25 for all f , meaning that the differ- ences between empirical Crozier quotients for different values o f f are so small that they enter only at the third position after the decimal point at best. Therefore we took ~ ( f ) = .25 as the value to be approximated by the theoretical Crozier quotients, i.e. by the Crozier quo- tients associated with the psychometric functions defined in terms of Hfisler's and Ditlivsen's approxima- tions.
We considered the data from two subjects. For subject JP the estimate for fl in (3.1) was fl = - . 2 2 for all temporal frequencies, and/~1 = - 1 . 8 2 forf~ = 8 Hz, /~2 = -- 1.16 for f2 = 22.5 Hz and/~3 = 0 for f 3 = 40 Hz.
For subject JAJR z the estimate for fl was fl = - . 4 4 , and the/~-values~ were about the same as for subject JP;
their exact values are unimportant since the effect of TPS is indicated by the value of fl (peak-detection in the sense of Definition 3 would imply fl = 0).
Empirical values o f Po were not given to us. This did not turn out to be a serious drawback, since the demands
(ii) and (iii) even imply an estimate of Po. To explore the effect of the value of Po upon the estimates of 22, S(22) and of [H(to)[, the parameters S and 22 were estimated for different values of Po, employing Hiisler's as well as Ditlivsen's approximation. It was found that (i) values of S and ~-2 can be found such that the corresponding value for In(to) l were practically constant for all values of k, and (ii) Crozier quotients in the neighbourhood of .25 could only be found for values of Po not larger than .02 (for Po > .03 the requirement qr ~ .25 implies the need for values o f S and 22 not allowing the integration procedure to converge; these values of S and 22 appear to be meaningless).
For the slope f l = - . 2 2 of the regression line (3.1) one arrives at practically identical results with both approximations; they are summarised in Table 1.
2 W e are greatly indebted to J. A. J. R o u f s for making these data available to us
Obviously, the differences of the estimates for S are negligible, and the estimates for 22 are qualitatively equivalent: they appear to reflect a noise process ~t that may be considered for all practical purposes as white.
For all three temporal frequencies values of IH(to)l approximately constant for the different values of the number of cycles and correspondingly constant values of the Crozier quotients, for both values of Po, were found employing the two approximations. The esti- mates for IH(to)[ and the Crozier quotients from Ditlivsen's approximation may be found in Fig. l(a);
the corresponding graphs for Hiisler's Approximation are almost identical.
The side condition q ( f ) ~ .25 was satisfied to a greater extent for the smaller value of Po, Po = .01. This means that for given value of fl a smaller value of Po implies parameter values S and 2z(S) for which the peak-detection approximation is better than for a big- ger value of Po. Recall that, on the other hand, the value of Po per se is not yet counterindicative of peak- detection, since in case of peak-detection the value of P0 depends upon the variance of the random variable and the value of ho (the maximum of h(t), the unit response of the detecting channel). So the value of P0 is indicative of an effect of TPS only in conjunction with that of fl and with the values of the Crozier quotients.
Note further that for a given value of fl a higher value of P0 implies not only a higher value of 22 in order to achieve a fit to the data, but also a higher value of S.
An increase of 22 without an increase of S, or, alterna- tively, a decrease of S without a change of the 22-value is not compatible with the data.
Let us recall that according to Theorem 3, (ii) and
(iii) peak-detection by a linear channel implies that Crozier's law holds, i.e. the Crozier quotients qr corre- sponding to different values of the number k o f cycles, should be constant. Therefore, if the q, differ from one another detection will not be peak-detection in the strict sense of Definition 3. Note that the Crozier quotients for the frequency f = 8 Hz show a greater variation with k than the Crozier quotients for f = 22.5 Hz. This reflects the intuitively very plausible fact that for lower frequencies the duration of the stimulus presentation is longer, and an increased stimu- lus duration goes with an increased chance of a level crossing (recall that the expressions (2.2) and (2.6) for
P(X <~ S) depend upon the duration T of a trial).
Furthermore, for low frequencies the deterministic re- sponse g(t)=mlH(to)l sin(tot +~b(to)) is more spread out in the neighbourhood of its maximal value [H(to)], so that again the chance of a level crossing in the neighbourhood of the maxima is greater than for higher
Table 1. Estimates for S and 22
HiJsler Ditlivsen
Po S 22 S 22
.01 4.772 506095.75 4.451 400193.39
.03 7.562 6.256298E + 22 7.750 7.06218E + 22
D i t i l v s e n ' s a p p r o x i m a t i o n ; P o = 0 . 0 1 20 ~-~ ...
F
I
10 ...
E
3 5 7 9 11 13 15 17 19 21 23 25 27 29 k ( n u m b e r of f u l l y f l e d g e d c y c l e s )
a
D i t i l v s e n ' s a p p r o x i m a t i o n ; P o = 0 . 0 3
",I
!
1 3 5 7 9 11 13 15 17 19 21 23 25 27 29 k ( n u m b e r of f u l l y f l e d g e d c y c l e s ) 0.30 r ... : ...
/
0.25 9
v
o" 0.20 . . .
"~ 0.15
"6 cr 0.10
,a) ,L
0 , 0 5 . . . .
el
. , ; , ; . . . . : , , , ; . . . . J ~ , ! , ! , ~ , ~ , : . ....... .m_(3
3 5 7 9 11 13 15 17 19 21 23 25 2 7 2 g k ( n u m b e r of f u l l y f l e d g e d c y c l e s )
0.35 ...
~ . 0.30
0.25
c r
0.20
"6 0.15
13"
" 0.10 0,05
f
. . . -'1 ~ f= 8Hz -~- f = 22.S Hz-=- f = 40Hz J ~ - ' : ' : , t , ,, , ,, , ,, , ,, , ,, ,~ , ~ , ,, , : , ~ , ; ,
3 5 7 9 11 1 3 1 5 1 7 1 9 2 1 2 3 2 5 2 7 2 9 k ( n u m b e r of f u l l y f l e d g e d c y c l e s )
D i t i l v s e n ' s a p p r o x i m a t i o n ; P o = 0 . 0 1
25
2o!
=__. 151- ...
1 I I"L~ ] -' -' : r a I ' = " ~ ! ! ~ I ! ! ~"". i
0 1 i i i i j l I I I I * IIII Ill' I I I t Iltl I
5 10 15 20 25 30
k ( n u m b e r of c y c l e s )
b
D i t i l v s e n ' s a p p r o x i m a t i o n ; P o = 0 . 0 3 25 r
2 0 t - ...
1 5 ~ " . . .
5 10 15 20 25 30
k ( n u m b e r of fully f l e d g e d c y c l e s )
~ o . z . . . ,
~ 0.6 ... "~ 0.6
0.5 (n
o 4 . . . . . . . . . . . . . . . . . . . . 0 4
o', 0.3 ... o"
~ 0.2
0 . 2 . . .
o o.1 - - f - , . 8 , , 1 .. . .
0 | t I I I I ' ' ~ " a t ' ' I ~ ' = ~ ' j [ . j ' L ' ' l 0
5 10 t 5 20 25 30
k ( n u m b e r of c y c l e s )
! ~ f = 8 H z -~- f= 22.SHz -=" f = 40Hz J
5 10 15 20 25 30
k ( n u m b e r of f u l l y f l e d g e d c y c l e s )
Fig. l a , b. M o d u l a t i o n t r a n s f e r f u n c t i o n s ( M T F s ) a n d C r o z i e r q u o t i e n t s d e r i v e d f r o m the F u U y - F l e d g e d - C y c l e s d a t a ; a fl = = . 2 2 ( c f (3.1)), b fl = - . 4 4 ; see t e x t for f u r t h e r details
frequencies. So for lower frequencies the effect o f TPS is altogether greater than f o r higher frequencies. Note further that for P0 = .01 the estimates of tH(og)[ are practically constant also for smaller values of k (k < 5), in contrast to the estimates for Po = .03. Further, the estimates for IH( o) I are higher for the smaller value of Po.
Let us have a look at the estimates for S and )`2 for fl = - . 4 4 . F o r this value of fi, Hiisler's approximation does n o t yield estimates for S and 22 that allow for constant values o f [H(~o)1, because these data require comparatively small values for the parameter S. Thus the condition of "large" values for S required for the validity o f Hiisler's approximation, contained in the extreme value approach taken for its derivation, is violated. Figure 1 (b) shows the estimates for [H(~o)[ and the Crozier quotients, based upon Ditlivsen's approxi- mation. F o r (a) P o = . 0 1 we found S = 2 . 6 5 1 , 22 = .40134, and for (b) P0 = .03 we have S =2.654, ),2 = 7.852. Again, the higher value o f P0 requires higher values of S and ),2(S); however, for this value o f fl the increase o f S with Po is quite small compared with the case fl = - . 2 2 . N o t e that the higher value o f Po implies a higher value in particular o f 22, and not so much o f S.
Note that the case fl = - . 4 4 requires a smaller value o f S than the case fi = - . 2 2 , and a correspond- ingly s m a l l e r value o f ),2- Detection is peak-detection in the strict sense if ),2 = 0, so one could argue that the smaller the value o f ),2, the better the assumption o f peak-detection holds as an approximation. However, it was not possible to achieve estimates for S and ),2 allowing for approximately constant Crozier quotients.
( N o t e that the Crozier quotients for f l = - . 4 4 are higher in the mean than for fl = - . 2 2 . ) This lack of constancy points, according to Theorem 3, to detection by TPS. Indeed, the "small" values o f 22 found for fl = - . 4 4 go with "small" values of S, and since the relation between S and )`2 is nonlinear the c o m b i n a t i o n o f small values for S and 22 may imply detection by TPS.
3 . 2 P e a k - d e t e c t i o n as an a p p r o x i m a t i o n
The implication o f peak-detection is c o n s t a n c y of Crozier quotients a n d log-parallelity of psychometric functions. The value o f the slope o f psychometric func- tions is not indicative o f detection by TPS, as may be readily seen from (2.1): with X = g 0 + ~ , ( a random variable that is constant within [0, T]; the slope of P r ( m ) = 1 - ( 1 - 7 ) P ( X <<. S ) depends upon the value of 7, and because of P ( X <<. S ) = P ( ( <~ S - mho), mho = go upon that o f ho. So even if detection is peak-detection in the strict sense the psychometric function may be steep or fiat.
Suppose we have determined psychometric func- tions for various values r o f a stimulus parameter. If detection is not peak-detection in the strict sense of Definition 3 the Crozier quotients will vary, and we m a y compute their mean value as well as their variance.
This variance may be taken as a measure of constancy.
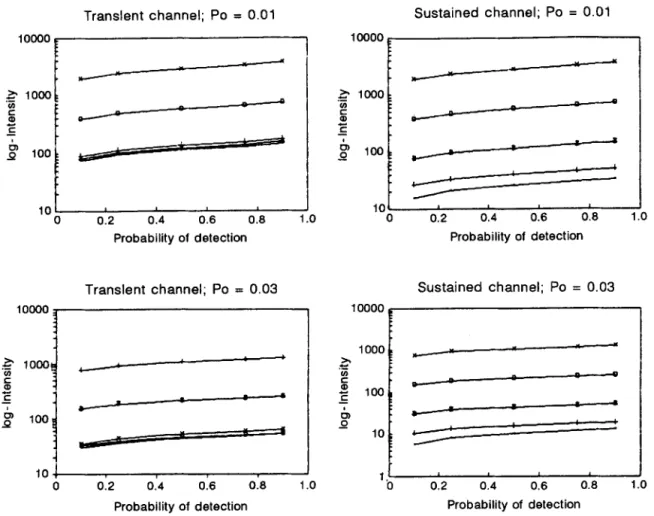
A better test o f the hypothesis o f peak-detection as an approximation is to test the log-paraUelity of the psychometric functions for the different values o f the stimulus parameter since (almost) complete psychomet- ric functions contain more information about the detec- tion process than the corresponding Crozier quotients alone. To illustrate the validity of the peak-detection approximation we have thus determined the psychomet- ric functions for rectangular pulses of different dura- tions T s (T~ being the parameter r according to which the stimuli and therefore the psychometric functions differ) employing the values o f S and 22 estimated from the Fully-Fledged-Cycles data. We assumed either P0 = .01 or Po = .03, and plotted the detection probabil- ities on a log-m scale, see Fig. 2.
If these psychometric functions had been deter- mined empirically we would not hesitate to call them log-parallel and interpret them as not contradicting the hypothesis of peak-detection at least as an approxima- tion in this case. Clearly, the psychometric functions are not e x a c t l y log-parallel, but exact log-parallelity can of course only be expected for 22 = 0.
Empirically determined psychometric functions may not look that clean, and we have not touched the statistical problems associated with the question how one decides whether observed deviations from log-par- allelity are significant or not. In principle, such a test is a relatively straightforward affair if it were not for the difficulties associated with the estimation of the Pr-val- ues; we will not elaborate these matters here.
4 Discussion
We assumed that sensory noise can be represented by a wide-sense stationary Gaussian stochastic process Ct with autocorrelation function R(T) for which R"(0) exists; 22 = - R " ( 0 ) is known as second-spectral mo- ment and may be taken as a measure o f the speed of the fluctuations of ~t.
It may now be of interest to elaborate the relation between the value o f 22 as estimated from psychophysi- cal data as compared with corresponding estimates from neurophysiological investigations. A complete dis- cussion of these matters is clearly beyond the scope of this paper, but it may be worthwhile to point out some open questions.
One problem with such an undertaking results from the question whether we may relate the estimates of ),2 to the activity o f a single cell. Most likely the detection process involves a set o f neurons in the visual cortex (cf. Freeman 1990). Therefore estimates o f threshold voltages in receptor cells (e.g. Fain et al. 1977) may not be very helpful in this context, also because we are not dealing with absolute thresholds. If we agree that more than one cell is involved in the detection process we have to tackle the question how the activity is moni- tored or integrated by higher centers o f the brain. The work of Roufs and Blommaert (1981) indicates that the role o f probability summation is at best negligible here (cf. Mortensen (1988) for a general discussion o f
10000
1000 _= _c
0 100
10 0
T r a n s i e n t c h a n n e l ; Po = 0.01
. _ . _ . . _ . - - -
I i
o12 0.,
Probability of detection
10000
>" 1000
( o r
i
o
~ 100
.0
S u s t a i n e d c h a n n e l ; Po = 0.01
1(] 0
,v.----'-" f
/
012 014 016 018
Probability of detection
1.0
10000
T r a n s i e n t c h a n n e l ; Po = 0 . 0 3
10000
S u s t a i n e d c h a n n e l ; Po = 0 . 0 3
> - .
1000
(/J t-"
C
100~
_Q
I i ---t-.
10 o o12 0:4 o16 1.o
i O )
_o
Probability of detection
Fig. 2. Log-parallel psychometric functions (for technical reasons exchange of x-axis (log-intensity) and y-axis (probability of detec- tion); Ditlivsen's approximation. Stimuli: rectangular pulses of vari-
1000
10
I t J
012 014 016 018 1.0
Probability of detection
ous durations Ts(log T~:. 2.8, +2.1, *1.4, 1~.7, x .0). Effects of TPS as indicated by deviations from log-parallelisms occur only for the sustained channel
this point). So we may assume some linear form o f integration, which m a y be equivalent to considering a single neuron. Clearly, these considerations are highly speculative and require a lot more work for their substantiation.
Neurophysiological work refers closely to molecular processes in the cell membrane (De Felice 1981; L~iuger 1984), which implies models of noise that in one way or another, often implicitly, relate noise (or the activity o f the cell in general) to Brownian motion or to processes derived from Brownian motion. This again means that one is dealing with M a r k o v processes. F o r instance, Bevan et al. (1979) consider a process with autocorrela- tion R(x) = ce-'l~q. I f we combine this with our assump- tion o f a stationary Gauss process we are indeed dealing with a M a r k o v process (cf. Papoulis 1965, p.
537), which m a y be derived as a special type of diffu- sion process and which is related to Langevin's equa- tion for the velocity o f a free particle in Brownian motion. However, for a process characterised by the autocorrelation function R(z) = ce-=t~l a second-spectral m o m e n t does not exist.
Generally, 22 as a noise parameter is practically never determined in neurophysiological investigations
(De Felice 1981; Kolb 1991). Further, estimates o f the power spectrum S(e~) for various values o f co (Bevan et al. 1979) or of e and ~ as parameters o f R(z) depend upon the type o f neuron, its size and temperature, and so the published values o f S(~o) do not allow for an estimate o f the corresponding value of 22.
So we have excluded M a r k o v processes from our consideration. F r o m a formal point o f view M a r k o v processes in the strict sense are idealisations ( H o n e r k a m p 1990) so that we may argue that in fact we have covered a very general case. While this is certainly a rather puritan point o f view we take, for the time being, our model as a functional description o f the visual system, perhaps representing some guidelines for studies relating more closely psychophysical and neuro- physiological data.
Appendix: proofs of t h e o r e m s
Theorem 1 (Hiisler): Let J,-denote the half-open inter- val ((i - 1)At, idt]. P [ m a x t ( g ( t ) + ~(t)) ~< S] = P[~(t) ~<
S -- g ( t ) , Vt e [0, T]] ~. P [ ~ ( t ) <~ S - g ( t , ) , Vt ~ ((i -