A PPLICATION M IGRATION E FFORT IN THE C LOUD
Stefan Kolb, Jörg Lenhard, and Guido Wirtz University of Bamberg
{stefan.kolb, joerg.lenhard, guido.wirtz}@uni-bamberg.de
Abstract
Over the last years, the utilization of cloud resources has been steadily rising and an increasing number of enterprises are moving applications to the cloud. A leading trend is the adoption of Platform as a Service to support rapid application deployment. By providing a managed environment, cloud platforms take away a lot of complex configuration effort required to build scalable applications. However, application migrations to and between clouds cost development effort and open up new risks of vendor lock-in. This is problematic because frequent migrations may be necessary in the dynamic and fast changing cloud market. So far, the effort of application migration in PaaS environments and typical issues experienced in this task are hardly understood. To improve this situation, we present a cloud-to-cloud migration of a real-world application to seven representative cloud platforms. In this case study, we analyze the feasibility of the migrations in terms of portability and the effort of the migrations. We present a Docker- based deployment system that provides the ability of isolated and reproducible measurements of deployments to platform vendors, thus enabling the comparison of platforms for a particular application. Using this system, the study identifies key problems during migrations and quantifies these differences by distinctive metrics.
Keywords: Cloud Computing, Platform as a Service, Migration, Case Study, Portability, Metrics
I NTRODUCTION
1
Throughout the last years, cloud computing is making its way to mainstream adoption. After the rise of Infrastructure as a Service (IaaS), also the higher-level cloud model Platform as a Service (PaaS) is finding its way into enterprise systems (Biscotti, et al., 2014;
Carvalho, Fleming, Hilwa, Mahowald, & McGrath, 2014).
PaaS systems provide a managed application platform, taking away most configuration effort required to build scalable applications. Due to the dynamic and fast changing market, new challenges of application portability between cloud platforms emerge. This is problematic because migrations to and between clouds require development effort. The higher level of abstraction in PaaS, including diverse software stacks, services, and platform features, also opens up new risks of vendor lock-in (Petcu & Vasilakos, 2014). Even with the emergence of cloud platforms based on an orchestration of open technologies, application portability is still an issue that cannot be neglected and remains a drawback often mentioned in literature (Hogan, Liu, Sokol, & Tong, 2011; Badger, Grance, Patt- Corner, & Voas, 2012; Petcu, Macariu, Panica, & Cracium, 2013; Di Martino, 2014; Silva, Rose, & Calinescu, 2013).
So far, the effort of application migration in PaaS environments and typical issues experienced in this task are hardly understood. Whereas the migration from on- premises applications to the cloud is frequently considered in current research, less work is available for migrations between clouds. To improve this situation, we present a cloud-to-cloud migration of a cloud-native
application between seven public cloud platforms. In contrast to an on-premises application, this kind of software is already built to run in the cloud
1. Therefore, we primarily investigate application portability between cloud vendors, rather than changes that are caused by adjusting an application to the cloud paradigm.
Considering the portability promises of open cloud platforms, consequences of this migration type are less obvious.
Application portability between clouds not only includes the functional portability of applications, but ideally also the usage of the same service management interfaces among vendors (Hogan, Liu, Sokol, & Tong, 2011; Petcu, 2011). This means that migration effort is not limited to code changes, which we also consider here, but includes effort for performing application deployment. Therefore, we put a special focus on effort caused by the deployment of the application in this study. We derive our main research questions from the preliminary results of previous work (Kolb & Wirtz, 2014):
RQ 1: Is it possible to move a real-world application between different cloud platforms?
RQ 2: What is the development effort involved in porting a cloud-native application between cloud platforms?
1
See the twelve-factor methodology at http://12factor.net.
The utilized application, Blinkist, is a Ruby on Rails web application developed by Blinks Labs GmbH. The set of selected PaaS vendors includes IBM Bluemix, cloudControl, AWS Elastic Beanstalk, EngineYard, Heroku, OpenShift Online, and Pivotal Web Services. We analyze the feasibility of the migration in terms of portability and the effort for this task. Besides, we present a Docker-based deployment system that provides the ability of isolated and reproducible measurements of deployments to platform vendors, thus enabling the comparison of platforms for a particular application. Using this system, the study identifies key problems during migrations and quantifies differences between the platforms by distinctive metrics. In this study, we target implementation portability (Kolb &
Wirtz, 2014; Petcu & Vasilakos, 2014) of the migration execution, i.e., the application transformation and the deployment. We focus on functional portability of the application. Data portability must be investigated separately, especially since popular database technologies, e.g., NoSQL databases, impose substantial lock-in problems. With our results, we are able to compare migration effort between different cloud platforms and to identify existing portability problems.
This article is an extended version of our earlier work (Kolb, Lenhard, & Wirtz, 2015), in which we introduced the case study and deployability framework.
We extend (Kolb, Lenhard, & Wirtz, 2015) in multiple directions. Firstly, we provide a more detailed description and illustration of the case study application, the vendor selection process, and the deployment tooling, as well as a more in-depth discussion of related work. Secondly, we update the pricing data for the platforms to contemporary levels and enhance the presentation of the data with several figures. Third, we perform a more sophisticated statistical analysis of the data resulting from the case study, including significance tests on the difference between container-based and VM-based platforms. This analysis reinforces the results from (Kolb, Lenhard, & Wirtz, 2015), hardens our interpretation, and confirms significant differences between container-based and VM-based platforms in deployment times and reliability.
The remainder of the paper is structured as follows.
In Section 2, we describe our research methodology including details of the application used, the process of vendor selection, the automation of deployment, and the measurement of deployment effort. Section 3 presents the results of our measurements and describes problems that occurred during the execution of the migrations. In Section 4, we review related work. Section 5 discusses limitations and future work that can be derived from the results. Finally, Section 6 summarizes the contributions of the paper.
Figure 1. Migration Evaluation Process (Jamshidi, Ahmad, & Pahl, 2013)
M ETHODOLOGY
2
The goal of this study is to analyze the task of migrating a cloud-based application with respect to the effort from the point of view of a developer/operator. To achieve this, we follow the process defined in Figure 1.
The first step is migration planning, which includes the analysis of application requirements and the selection of cloud providers. Next comes the migration execution for all providers, including code changes and application deployment. After manually migrating the application to the providers, these steps and modifications are automated to enable a reproducible and comparable deployment among them. To be able to compare the main effort drivers of the execution phase, i.e., code changes and application deployment, we define several metrics that allow a measurement of the tasks performed during the migration execution step. As discussed before, application portability between clouds not only includes the functional portability of applications, but also the portability of service management interfaces between vendors (Hogan, Liu, Sokol, & Tong, 2011; Petcu, 2011). In our case, due to the use of open technologies and a cloud-native application, this effort is mainly associated with application deployment. Hence, in this study, we put a special focus on the effort caused by the deployment of the application, next to application code changes. In times of agile and iterative development paradigms, this implies that also the effort of redeployment must be considered.
Therefore, our deployment workflow includes a redeployment of a newer version of the study's application. To validate that the application is operating as expected in the platform environment, we can draw on a large set of functional and integration tests. As concluding step, we evaluate our findings in the migration evaluation, including measured results and a discussion about problems and differences between providers.
The primary focus of this study is on the migration execution and evaluation, as the initial planning step can be largely assisted by our cloud brokering tool from (Kolb & Wirtz, 2014) that covers the details of provider brokering and application requirements matching.
2.1 M IGRATED A PPLICATION
The application Blinkist is built by a Berlin-based mobile learning company launched in January 2013 and distills key insights from nonfiction books into fifteen- minute reads and audio casts. Currently, Blinkist
Migration Planning Migration Execution Migration Evaluation
includes summaries of over 1,300 books in its digital library. Blinkist has a user count of more than 500,000 registered customers worldwide. The product is created by a team of 21 full-time employees and is available for Android, iPhone, iPad, and web. We target the web application
2, which is built in Ruby on Rails. The high- level architecture relevant for this study can be seen in Figure 2.
Figure 2. Web Application Architecture
The user facing front end is a Rails 4 application with access to decoupled business logic written in Ruby. The application uses a MongoDB database for persistence of user data and book summaries. Moreover, page caching and distribution of static application assets, e.g. images, is implemented via Redis and Amazon's CloudFront content delivery network (CDN). The web interface is run with at least two application instances in parallel, hosted by a Puma web server. The study uses Blinkist's application version from May 2014 for the initial deployment and a subsequent release after a major code sprint for redeployment. The application part totals for about 60,000 Lines of Code (LOC).
2.2 V ENDOR S ELECTION
As hosting environment for the application, we aim for a production-ready, public PaaS that supports horizontal application scalability. The application itself depends on support for Ruby 2.0.0 and Rails 4. The necessary services and data stores are provided by independent external service vendors and are configured via environment variables (see Fig. 2).
The decision on possible candidates for the application can be assisted by the knowledge base and cloud brokering tool
3presented in (Kolb & Wirtz, 2014). The knowledge base is founded on a taxonomy describing essential components and capabilities of PaaS vendors.
The classification was extracted from an extensive study of the vendor landscape and literature reviews. To enable matching and filtering of PaaS offerings, the taxonomy is transformed into a standardized machine-
2
The recent application version can be accessed at https://www.blinkist.com.
3
The project homepage is https://github.com/stefan- kolb/paas-profiles. A hosted version of the web interface is available at http://PaaSify.it.
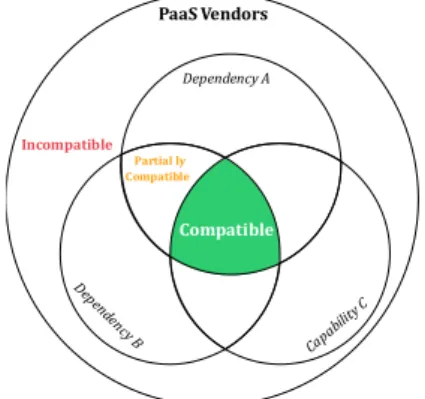
readable profile. The underlying assumption of the matching strategy is that an application can be ported among vendors that support the same application dependencies natively. Figure 3 exemplifies the approach for a set of three requirements, including two application dependencies and one platform capability.
The overlapping sections of the requirements include sets of vendors that can be divided into partially compatible, and compatible. Compatible vendors support all listed demands. Therefore, the application is portable to their system. Partially compatible vendors support a subset of requirements and might only be candidates if some of the application requirements can be relaxed or manually upgraded by the customer. In contrast, incompatible vendors (all vendors outside the subsets) do not support any of the requested requirements.
Figure 3. PaaS Ecosystem Portability
This approach compensates the lack of commonly accepted portability standards in the cloud context. By following the dimensions of our taxonomy, we are also able to solve semantic conflicts between PaaS by providing a restricted common set of capabilities. The feasibility of the approach was validated in (Kolb &
Wirtz, 2014). To enhance the accuracy and up-to- dateness of the knowledge base, all data is collaboratively maintained by vendors and customers as an open source project. To the best of our knowledge, this is the most recent, comprehensive, and publicly available collection of PaaS vendors. For more details on the specification and taxonomy see (Kolb & Wirtz, 2014).
Listing 1 shows the desired PaaS profile, as defined in (Kolb & Wirtz, 2014), for the application requirements of the case study application.
The broker tool allows us to filter from the multitude of available platform offerings based on the defined ecosystem capabilities and requirements. The filtering can either be done manually via a web interface or in an automated fashion by querying the RESTful broker API with the request from Listing 1. With the help of our tool,
Front end Caching
Back end Database
CDN
ENV[REDIS_URL]
ENV[ASSET_URL]
ENV[MONGO_URL]
MongoDB Redis
Webserver Puma
CloudFront
Rails Ruby
Incompatible
Dependency A
Depe nden
cy B Capability C
Compatible
Partial ly Compatible
PaaS Vendors
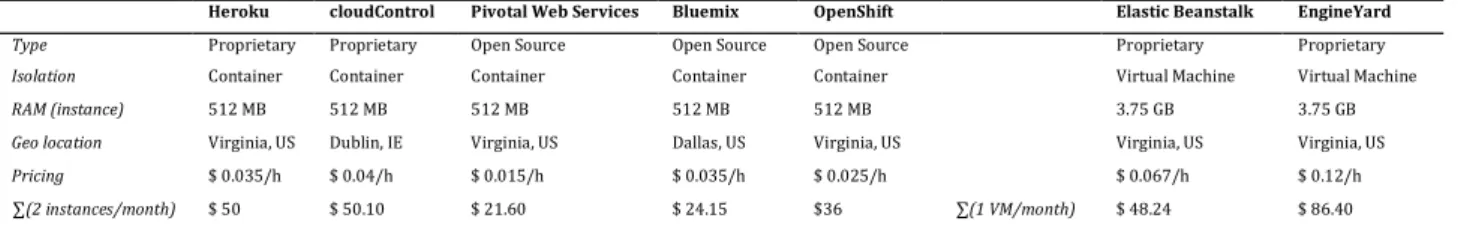
we were able to filter from a total of 75 offerings to a candidate set of 22 offerings, based on the chosen platform capabilities and runtime support. This means that 70 % of the vendors have already been excluded due to ecosystem portability mismatches, i.e., failing support for specific requirements. Thereafter, we also filtered out vendors that are based on the same base platform technology, e.g., Cloud Foundry, except for one duplicate control pair (Pivotal and Bluemix). The final selection of the seven vendors, presented in Table 1, was based on a concluding relevance assessment of the remaining offerings.
{
"status": "production", "scaling": {
"horizontal": true },
"hosting": { "public": true },
"runtimes": [ {
"language": "ruby", "versions": [ "2.0.0" ] }
],
"frameworks": [ {
"name": "rails", "versions": [ "4.*" ] }
] }
Listing 1. PaaS Profile for the Application
For reasons of comparability, we selected equal instance configurations and geographical locations among the different vendors, grouped by virtualization technology. At the time when the case study was executed, this was possible for all but two vendors, i.e., cloudControl and Bluemix, which only supported application deployment in Dublin, IE, and respectively Dallas, US.
As we can see in Table 1, there are substantial pricing differences between the vendors. Pricing is based on equivalent production grade configurations dependent on the technology descriptions and specifications of the vendors
4. Nevertheless, first results reveal performance differences, which are not included in this consideration.
Currently, a price-performance value can hardly be investigated by a customer upfront. In general, container-based PaaS are cheaper to start with than VM-
4
Pricing is based on selected RAM usage, resp. instance type.
720 h/month estimate. No additional bandwidth and support options included. Free quotas deducted. Dollar pricing of cloudControl is taken from their US subsidiary dotCloud. Date:
11/11/2015.
based ones. Still, instance performance is lower with respect to the technology setup. When looking at instance prices of container-based PaaS per hour, the most expensive vendor charges over two and a half times more than the cheapest one. However, it is common among PaaS vendors that there is a contingent of free instance hours per month included. Therefore, the total amount of savings is dependent on the number of running container instances. For example, the differences between Bluemix and cloudControl, caused by a higher free hour quota of Bluemix, will level up with increasing instance count. Pricing among VM-based offerings is even more complex with dedicated pricing for platform components like IP services, bandwidth, or storage, which makes it difficult for customers to compare the prices of different vendors.
2.3 D EPLOYMENT A UTOMATION
In this study, we want to measure the effort of a customer migrating an application to specific platforms.
As discussed, in our case this effort is mainly associated with application deployment. To be able to measure and compare this effort, we automate the deployment workflows by using the provider's client tools. This kind of interaction is supported by the majority of providers and therefore seems appropriate for a comparative measurement in contrast to other mechanisms like APIs.
Although all selected providers offer client tools, not all steps can be automated for every provider. The amount of manual steps via other interfaces like a web UI will be denoted explicitly. The automation of the workflows helps to better understand, measure, and reproduce the presented results. We implemented an automatic deployment system, called Yard
5, that works similar for every provider and prevents errors due to repeatable deployment workflows. This enables a direct comparison of deployment among providers.
Yard consists of a set of modules which automate the deployment for specific providers. To abstract from differences between providers, we define a unified interface paradigm that each module has to implement.
To conform to the interface, every module needs to implement one init, deploy, update, and delete script that encapsulates necessary substeps. This approach offers a unified and provider-independent way to conduct deployment. Accordingly, the init script must execute all steps that are required to bootstrap the provider tools for application deployment, e.g., install the client tools.
The deploy script contains the logic for creating a new application, including application and platform configuration. This typically involves authenticating with the provider platform, creating a new application space, setting necessary environment variables, deploying the
5
See https://github.com/stefan-kolb/paasyard.
application code, and finally verifying the availability of the remote application. Updates to an existing application are performed inside the update script.
Finally, the delete script is responsible for deleting any previously created artifacts and authentication information with the particular provider. Any necessary provider-specific artifacts, like deployment manifests or configuration files, must be kept in a subfolder adjacent to the deployment scripts and will be merged into the main application repository by Yard before any module script execution. The deployments are automated via Bash scripts. User input is inserted automatically via Here Documents or Expect scripts. This guarantees that user input is supplied consistently for every deployment.
As an example, Listing 2 shows the deploy script for Heroku.
#!/bin/bash
echo "---> Initializing application space..."
# authentication heroku login <<END
$HEROKU_USERNAME
$HEROKU_PASSWORD END
# create app space heroku create $APPNAME
# environment variables
heroku config:set MONGO_URL=$MONGO_URL REDIS_URL=$REDIS_URL ASSET_URL=$ASSET_URL
echo "---> Deploying application..."
git push heroku master
echo "---> Checking availability..."
./is_up https://$APPNAME.herokuapp.com
Listing 2. Deployment Script for Heroku
First, the script authenticates the CLI with the platform. Any provider credentials and other variables, e.g. $HEROKU_USERNAME , used inside the scripts must be defined in a configuration file. After the login, a new application space is created and necessary environment variables to the external caching and database services are set. Next, the application code is pushed to the platform via a Git remote which automatically triggers the build process inside the platform. Finally, a helper script requests the remote URL until the application is up and successfully responds to requests.
Since the system is intended to be used for independent deployment measurements, we must make sure that we achieve both local and remote isolation between different deployment runs. Consequently, the previously described set of scripts must allow an application installation in a clean platform environment and reset it to default settings by running the delete script. The set of scripts must ensure that subsequent deployments are not influenced by settings made to the remote environment through previous runs. As the different build steps and deployment tools will possibly write configuration files, tokens, or host verifications to the local file system, we need to enhance our approach with extra local isolation. Thus, the deployments are run inside Docker containers for maximum isolation between different deployments. Docker provides lightweight, isolated containers through an abstraction layer of operating-system-level virtualization features
6.
Figure 4. Yard - Isolated Deployment with Docker A graphical overview of our deployment system Yard can be seen in Figure 4. For each container, a base image is used that only consists of a minimal Ubuntu installation, including Python and Ruby runtimes. This base image can be varied, if one does not want to have specific libraries or runtimes pre-installed for the measurements. From the base image, a deployment image is created that bootstraps the necessary provider tool dependencies. This is achieved by executing the init script of each provider module inside the base image, which results in a new container image. Additionally, the application code and the deployment artifacts are
6
See https://www.docker.com/whatisdocker for more details.
Base image
Deployment artifacts Application code
Deployment image
init deploy
Deployment scripts
Heroku cloudControl Pivotal Web Services Bluemix OpenShift Elastic Beanstalk EngineYard
Type Proprietary Proprietary Open Source Open Source Open Source Proprietary Proprietary
Isolation Container Container Container Container Container Virtual Machine Virtual Machine
RAM (instance) 512 MB 512 MB 512 MB 512 MB 512 MB 3.75 GB 3.75 GB
Geo location Virginia, US Dublin, IE Virginia, US Dallas, US Virginia, US Virginia, US Virginia, US
Pricing $ 0.035/h $ 0.04/h $ 0.015/h $ 0.035/h $ 0.025/h $ 0.067/h $ 0.12/h
∑(2 instances/month) $ 50 $ 50.10 $ 21.60 $ 24.15 $36 ∑(1 VM/month) $ 48.24 $ 86.40
Table 1. PaaS Vendors and Selected Configurations
directly merged into a common repository. This is done to avoid additional bootstrapping before each deployment, which could influence the timing results of the deployment run. The resulting image can be used to deploy the code to different providers from every Docker-compatible environment via a console command.
For convenience, the tool additionally provides a CLI script that handles the invocation of the different deployment scripts.
2.4 M EASUREMENT OF D EPLOYMENT E FFORT As discussed before, migration effort in our case translates into effort for installing the application on a new cloud platform, i.e., into effort for deploying the application. Hence, we need metrics that enable us to measure installability or deployability. In (Lenhard, Harrer, & Wirtz, 2013), we proposed and validated a measurement framework for evaluating these characteristics for service orchestrations and orchestration engines, based on the ISO/IEC SQuaRE quality model (ISO/IEC, 2011). Despite the difference between service orchestrations and cloud applications, this framework can be adapted for evaluating the deployability of applications in PaaS environments by modifying existing metrics and defining new ones. A major benefit of the chosen code-based metrics is their reproducibility and objectiveness. Currently, we do not consider human factors, e.g., effort in terms of man hours. Such aspects are hardly quantifiable without a larger empirical study and influenced by a lot of other factors, like for instance the expertise of the workers involved. However, it is possible to introduce such factors by adding weighting factors to the metrics computation, as for instance done in (Sun & Li, 2013).
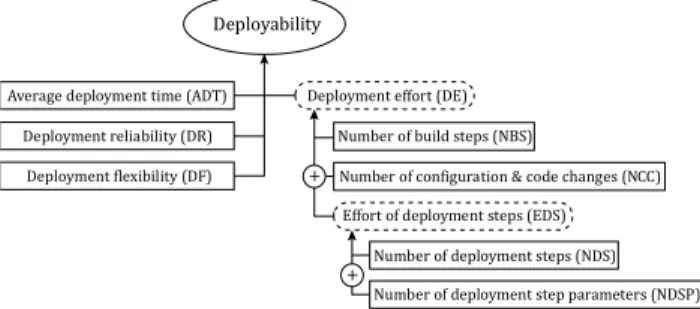
Figure 5. Deployment Metrics Framework As cloud platforms are preconfigured and managed environments, there is no need to consider the installability of the environment itself, as in (Lenhard, Harrer, & Wirtz, 2013). Instead, the focus lies on the deployability of an application to a cloud platform.
Figure 5 outlines the adapted framework for deployability. We capture this quality attribute with the direct metrics average deployment time (ADT),
deployment reliability (DR), deployment flexibility (DF), number of deployment steps (NDS), number of deployment step parameters (NDSP), number of configuration & code changes (NCC), and the number of build steps (NBS). The last four metrics are aggregated to an overall effort of deployment steps (EDS) and deployment effort (DE). All metrics but ADT, DR, and DF are classic size metrics in the sense of (Briand, Morasca,
& Basily, 1996). This means, they are non-negative, additive, and have a null value. They are internal metrics that can be computed by statically analyzing code artifacts and are defined on a ratio scale. ADT and DR are external metrics, since they are computed by observing execution times and reliability. ADT is defined on a ratio scale and DR is defined on the interval scale of [0,1]. The following paragraphs briefly introduce the metrics.
Average deployment time (ADT). This metric describes the average duration between the initiation of a deployment by the client and its completion, making the application ready to serve user requests. This can be computed by timing the duration of the deployment on the client side and repeating this process a suitable number of times. Here, we use the median as measure of central tendency.
Deployment reliability (DR). Deployment reliability captures the reliability of an application deployment to a particular vendor. It is computed by repeating the deployment a suitable amount of times and dividing the number of successful deployments of an application ( ) with the total number of attempted
deployments ( ): = / . will
be equal to one, if all deployments succeed.
Deployment flexibility (DF). (Lenhard, Harrer, &
Wirtz, 2013) defines deployment flexibility as the amount of alternative ways that exist to achieve the deployment of an application. In our case, available deployment techniques are, e.g., CLI-based deployment, web-based deployment or IDE plug-ins. The more of these options a platform supports, the more flexible it is.
As we are concentrating on deployment via command line tools in this study, hereafter, we omit a more detailed consideration of this metric.
Number of deployment steps (NDS). The effort of deploying an application is related to the amount of operations, or steps, that have to be performed for a deployment. In our case, deployment is automated, so this effort is encoded in the deployment scripts (see Sect. 2.3). A deployment step refers to a number of related programmatic operations, excluding comments or logging. The larger the amount of such steps, the higher is the effort. Usually, there are different ways to deploy an application. Here, we tried to find the most concise way in terms of step count, while favoring
Deployability
Deployment effort (DE) Number of build steps (NBS)
Number of deployment steps (NDS) Number of deployment step parameters (NDSP) +
+
Effort of deployment steps (EDS) Average deployment time (ADT)
Deployment reliability (DR)
Deployment flexibility (DF) Number of configuration & code changes (NCC)
command options over nonportable deployment artifacts that may silently break the deployment on different vendors. As an example, the value of for the deployment script in Listing 2 sums up to
= 4.
1) Authentication: heroku login
2) Create application space: heroku create 3) Set environment variables: heroku config:set 4) Deploy code: git push heroku master
Number of deployment step parameters (NDSP).
The number of steps for a deployment are only one side of the coin. Deployment steps often require user input (variables in scripts) or custom parameter configuration that need to be set, thereby causing effort. We consider this effort with the metric deployment step parameters, which counts all user input and command parameters that are necessary for deployment. The deployment script in Listing 2 uses six different variables and requires no additional command line parameters,
resulting in = 6.
Effort of deployment steps (EDS). The two direct metrics NDS and NDSP count the effort for achieving a deployment. Since they are closely related, we aggregate the two to the indirect metric EDS by summing them up.
Given an application : = .
For our example, this amounts to = 10 . Number of configuration & code changes (NCC).
The deployment of an application to a particular vendor may require the construction of different vendor-specific configuration artifacts. This includes platform configuration files and files that adjust the execution of the application, e.g., a Procfile
7. Again, the construction of these files results in effort related to their size (Lenhard, Harrer, & Wirtz, 2013). For all configuration files, every nonempty and noncomment line is typically a key-value pair with a configuration setting, such as an option name and value, needed for deployment. We consider each such line using a LOC function. Furthermore, it might be necessary to modify source files to mitigate incompatibilities between different platforms. This can be due to unsupported dependencies that must be adjusted, e.g., native libraries or middleware versions.
Any of those changes will be measured via a LOC difference function. The sum of the size of all configuration files and the amount of code changes corresponds to the configuration & code changes metric.
For an application that consists of the configuration files !"#
$, … , !"#
&'()*and the code files
!"#
+, … , !"#
&'(,-, along with their platform-adjusted versions !"#
+., … , !"#
&. /0, NCC can be computed as:
7
See https://devcenter.heroku.com/articles/procfile.
11 2 341 !"#
$2 341
/$55!"#
+, !"#
.+&'(,- +67
&'()*
$67
Number of build steps (NBS). Another effort driver in traditional application deployment is the number of build steps, i.e., source compilation and the packaging of artifacts into an archive (Lenhard, Harrer, & Wirtz, 2013). This is less of an issue for cloud platforms, where most of this work can be bypassed with the help of platform automation, e.g., buildpacks
8. At best, a direct deployment of the application artifacts is possible ( 8 0 ), shifting the responsibility of package construction to the platform. For some platforms it is still necessary, which is why we capture it in the same fashion as the number of deployment steps.
Deployment effort (DE). To provide a comprehensive indicator for effort associated with deployment, we provide an aggregated deployment effort, computed as the sum of the previous metrics:
1 8 . It is arguable to weight the severity of different deployment efforts by introducing a weighting factor in this equation. As we cannot determine a reasonable factor without a larger study, they are considered as coequal here.
R ESULTS
3
In this section, we first describe the execution of the measurements, followed by a presentation, discussion, and interpretation of the results in Section 3.2 and a summary in Section 3.3.
3.1 E XECUTION OF M EASUREMENTS
As part of our migration experiment, we need to compute values for the deployment metrics from the preceding Section 2.4. The timing for the ADT of an individual deployment run can be calculated by prefixing the script invocation with the Unix time command
9, which returns the elapsed real time between the invocation and termination of the command. One distinct test is the execution of a sequence of an initial deployment, followed by an application redeployment, and concluded by the deletion of the application. Each provider was evaluated via 100 runs of this test. Every successful run was included in the ADT calculation and the amount of successful and failed runs were used to compute deployment reliability. Runs with deployment failures that could not be attributed to the respective platforms, e.g. temporary unavailability of external resources, where excluded from the calculation.
EngineYard forms an exception in the measurement
8
See https://devcenter.heroku.com/articles/buildpacks.
9
See http://linux.die.net/man/1/time.
setting, with a total of 50 runs. The reason for this is that the deployment could not be fully automated and each run involved manual steps. The measurements were conducted at varying times during workdays, to simulate a normal deployment cycle inside a company. To minimize effects of external load-induced influences (e.g.
RubyGems mirror) on the measurement, the deployments were run in parallel. The significance of potential problems can be further attenuated as we are not primarily looking for exact times, but magnitudes that can show differences between vendors. Such differences will be separately identified with the help of significance tests. All deployments were measured with a single instance deployment at first, i.e., no scaling included. The values for each metric were evaluated and validated by an in-group peer review. The gathered metrics can be seen in Tables 2 and 3.
Even though we could successfully migrate the application to all but one vendor, a substantial amount of work was required. Besides the captured effort values, additional important obstacles are incomplete documentation of the vendors and missing direct instance access for debugging, especially with container- based PaaS. Even with this common kind of application, getting the application to run was difficult and compromises with certain technology setups, e.g., web servers, were needed. Whereas some of these problems are to be expected and can only be prevented by unified container environments, major parts of the interaction with the system should be homogenized by, e.g., unified management interfaces.
During the case study, a number of bugs had to be fixed inside the cloud platforms. In total, we discovered four confirmed bugs on different platforms that prevented the application from running correctly. The majority was related to the bootstrapping of the platform environment, e.g., server startup and environment variable scopes, and could be resolved by the vendors in a timely manner. As a downside, one vendor supported a successful deployment, but did not allow us to run the application correctly, due to an internal security convention that prevented the database library from connecting to the database. These issues show that even with common application setups, cloud platforms cannot yet be considered fully mature.
3.2 E FFORT A NALYSIS
The following section describes the results of our case study in detail. We discuss the metric values and their implications and give insights into the problems that did occur during the migrations.
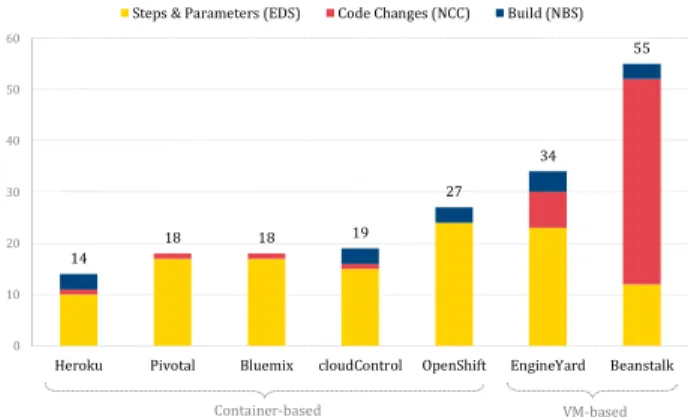
Effort of deployment steps (EDS). As a first result, we can state that although deployment steps are semantically similar among vendors, they are all carried out by proprietary CLI tools in no standardized way.
This results in recurring effort for learning to use new tooling for every vendor and to adapt existing automation. Figure 6 depicts the effort of deployment steps of all vendors. On average, deployment takes 17 steps with a maximum spread of 14 and a standard deviation of 5. Some vendors require more steps, whereas others require less steps but more parameters.
Heroku, cloudControl, Pivotal, and Bluemix are driven by
Heroku cloudControl OpenShift Pivotal Bluemix Elastic Beanstalk EngineYard
Effort of deployment steps (EDS) 10 15 24 17 17 12 23
Number of deployment steps (NDS) 4 5 6 6 6 2 8
Automated 4 5 6 6 6 2 4
Manual 0 0 0 0 0 0 4
Number of deployment step parameters (NDSP) 6 10 18 11 11 10 15
Number of configuration & code changes (NCC) 1 1 0 1 1 40 7
Deployment artifacts 1 1 0 1 1 40 7
Application code 0 0 0 0 0 0 0
Number of build steps (NBS) 3 3 3 0 0 3 4
Deployment reliability (DR) 0.96 0.72 0.78 1 0.89 0.99 1
Average deployment time (ADT) 9̃ 6.75 min 9.13 min 8.42 min 5.83 min 7.03 min 15.94 min 28.44 min
Deployment effort (DE) 14 19 27 18 18 55 34
Table 2. Deployment Efforts
Heroku cloudControl OpenShift Pivotal Bluemix Elastic Beanstalk EngineYard
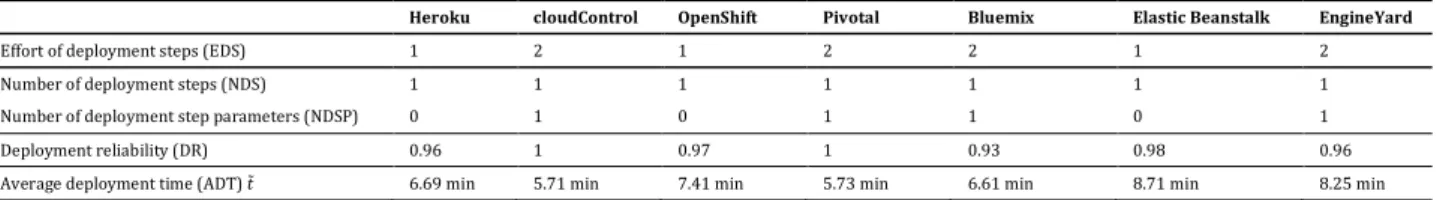
Effort of deployment steps (EDS) 1 2 1 2 2 1 2
Number of deployment steps (NDS) 1 1 1 1 1 1 1
Number of deployment step parameters (NDSP) 0 1 0 1 1 0 1
Deployment reliability (DR) 0.96 1 0.97 1 0.93 0.98 0.96
Average deployment time (ADT) 9̃ 6.69 min 5.71 min 7.41 min 5.73 min 6.61 min 8.71 min 8.25 min
Table 3. Redeployment Efforts
a similar concise deployment workflow. In contrast, OpenShift requires a cumbersome configuration of the initial code repository. Only the deployment for EngineYard could not be automated entirely. The creation of VM instances must be initiated via a web interface, whereas the application deployment can be triggered by the client tools. As instance setup is normally performed once and not repetitively, this has less negative influence in practice than other steps would have. In the case of Elastic Beanstalk, the low EDS value of 12 is contrasted by a large configuration file.
The majority of modern container-based PaaS reduce effort with respect to the EDS through an intelligent application type detection. In comparison, this must be explicitly configured up-front with the VM-based offerings. The EDS for a redeployment are roughly the same between vendors and only involve pushing the new code to the platform.
Figure 6. Effort of Deployment Steps
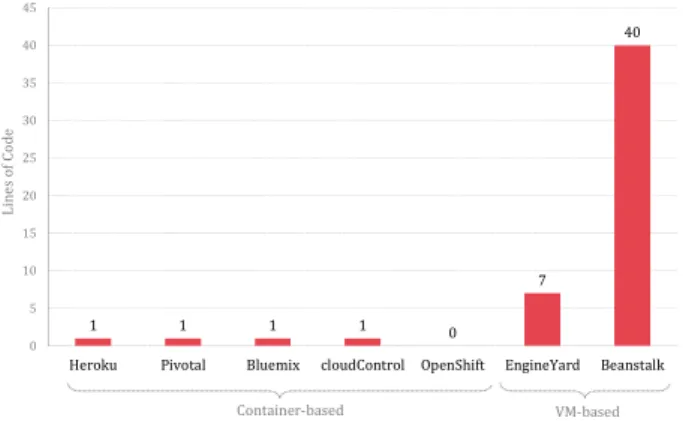
Number of configuration & code changes (NCC).
Particularly the container-based platforms can be used with only few deployment artifacts (see Figure 7). Four out of five vendors support a Procfile-based deployment for specifying application startup commands ( 11 = 1).
Whereas this compatibility helps to reproduce the application and server startup between those vendors, it is a major problem with the others. Especially custom server configuration inside the Procfile, i.e., the Puma web server, is a source of portability problems among platforms. Two platforms only support a preconfigured native system installation of Puma and one does not support the web server in conjunction with the necessary Ruby version at all. Moreover, the native installations can lead to dependency conflicts, if the provider uses another version than specified in the application's dependencies, resulting in compulsory code modifications. The only two vendors for which more configuration is needed are both VM-based offerings. In the case of EngineYard, the deployment descriptor can be kept small in a minimal configuration.
Additionally, in contrast to other vendors, a custom
recipe repository must be cloned to use environment variables and these variables have to be configured inside a script file. The recipes can be uploaded and applied to the server environment afterwards. Elastic Beanstalk proved to be more problematic to achieve a working platform configuration. We needed a rather large configuration file that modifies required Linux packages, platform configuration values, and environment variables. Apart from that, we even had to override a set of server-side scripts, to modify the Bundler dependency scopes and enable dependency caching.
Figure 7. Configuration and Code Changes In general, we tried to avoid the use of configuration files or proprietary manifests. If options were mandatory to be configured for a vendor, where possible, this was done using CLI commands and parameters instead of proprietary manifests. In either case, the value of EDS and the size of configuration files is in a close relation with each other.
For the case study's application, we could achieve portability without changing application code, solely by adapting the runtime environment, i.e., deployment configuration, application and server startup. This is the effect of having a cloud-native application based on open technologies. Furthermore, all vendors that did not support required technologies were excluded in the initial migration planning step. If the application made use of proprietary APIs or unavailable services, this would have caused a large amount of application changes. Apart from that, further tests showed that especially native Gems (code packages) cause portability problems between PaaS offerings. These Gems may depend on special system libraries that are not available in every PaaS offering and cannot always be installed afterwards. Buildpacks can help to prevent such problems by unifying the environment bootstrapping, making it easier to support special dependencies that would otherwise be hard to maintain.
10 12
15
17 17
23 24
0 5 10 15 20 25 30
Heroku Beanstalk cloudControl Pivotal Bluemix EngineYard OpenShift Steps Parameters
1 1 1 1 0
7 40
0 5 10 15 20 25 30 35 40 45
Heroku Pivotal Bluemix cloudControl OpenShift EngineYard Beanstalk
Lines ofCode
Container-based VM-based
Number of build steps (NBS). The NBS for deployment is similar between vendors. As sole packaging requirement, most vendors mandate that the source code is organized in a Git repository, either locally or remotely ( 8 = {3, 4} ). This is often naturally the case but must be counted as build effort.
Deployment reliability (DR). For some vendors, we experienced rather frequent deployment failures, resulting in lower DR values, especially during the initial creation of applications. Often, these failures were provoked by recurring problems, e.g., permission problems with uploaded SSH keys or other platform configuration problems. From the descriptive data in Table 2, it seems that container-based systems experience more frequent failures than VM-based systems. To examine this assumption, we used a test to check if the amount of deployment successes for container-based systems is significantly lower
10. Since deployment success is coded in a binary fashion, i.e., either success or failure, it is possible to apply a binomial test. We aggregated the amount of successes and failures for all container- and VM-based systems, respectively.
Thereafter, we computed the binomial test, comparing the amount of successful runs for container-based systems (433) and the total amount of runs for container-based systems (497) to the success probability for VM-based systems (0.99). The null hypothesis is that both system types have an equal success probability. The alternative hypothesis is that the success probability of container-based systems is lower. In this case, the null hypothesis can be safely rejected with a p-value of 2.2
@7A. As a result, it can be said that VM-based systems are more reliable in intial application deployment.
In the case of redeploying existing applications, on average, we experienced less failures, resulting in higher DR values. We used a binomial test in the same fashion as in the previous paragraph to check if VM-based systems are still more reliable. This time, there were 423 redeployment runs for container-based systems in total, of which 411 were successful. At the same time the success probability for VM-based systems is 0.96. The p- value of 0.78 resulting from the binomial test does not reach a significant level and we cannot diagnose significant differences in the success probability for container- and VM-based systems. Also the reverse test, checking if the success probability of VM-based systems is lower, did not reach a significant level.
To sum up this section, VM-based systems are significantly more reliable on initial deployment than container-based systems, but this difference vanishes after the initial deployment phase. This can be explained
10
All statistical tests in this paper were executed using the R software (R Core Team, 2015).
by the anomalies associated with the platform configuration we mentioned at the beginning of this section and shows room for improving the maturity of the platforms.
Average deployment time (ADT). Figure 8 visualizes the observed average deployment times. The mean of the deployment time is 11.65 min, but it deviates by 7.52 min. Differences between container-based offerings are small, only ranging within a deviation of 71 seconds.
Container-based deployments are on average almost 3 times faster than VM-based platforms. The authors of (Mao & Humphrey, 2012) measured an average startup time for Amazon's EC2 VM instances of 96.9 seconds. Tests with the case study's instance configurations confirm this magnitude. This amount of time is contrasted with a duration of only a few seconds for creating a new container. Even when deducting this overhead from the measurements, the creation of the VM-based environments takes considerably longer than the one of container-based PaaS environments. A majority of the deployment time (≈ 46 %) is spent for installing necessary application dependencies with Bundler. Another considerably large part is the asset precompilation
11of CSS files, JavaScript files, and static assets (≈ 18 %). The remaining time (≈ 35 %) is consumed by other tasks of the build process and the platform configuration.
Figure 8. Average Deployment Times
As before, we used statistical tests to confirm if the differences in deployment times between the two types of environments are significant. To begin with, we used the Shapiro-Wilk test (Shapiro & Wilk, 1965) to check if deployment times follow a normal distribution. This can be safely rejected for both, container-based and VM- based environments. As a result, we applied a non- parametric test, the Mann-Whitney U test (Mann &
Whitney, 1947) for comparing deployment times. Our null hypothesis is that there are no significant
11
See http://guides.rubyonrails.org/asset_pipeline.html.
5.83 6.75 7.03 8.42 9.13
15.94 28.44
0 5 10 15 20 25 30
Pivotal Heroku Bluemix OpenShift cloudControl Beanstalk EngineYard
Minutes
Container-based VM-based
differences in the deployment times of VM-based and container-based environments. The alternative hypothesis is that deployment times for VM-based environments are greater. The p-value resulting from the test (
BC: 150,
F $F0G: 497 , J: 64513) is 2.2
@7A. Thus, the null hypothesis can be clearly rejected.
Container-based environments deploy significantly faster than VM-based environments.
Measured time values are also interesting for the case of redeployment. To that end, we take a newer version from a typical code sprint of Blinkist's release cycle. Besides code changes, it includes new and updated versions of dependencies as well as asset changes. In general, the redeployment times are less than for the initial deployment, which can be mainly attributed to dependency caching. In total, the installation of updated or new dependencies takes ≈ 50 % less time than on the initial deployment. In our redeployment, there are more assets to process, resulting in a slightly longer precompilation time than for the initial deployment. For redeployment, all timings of the vendors are in a close range. Here, VM-based offerings catch up with container- based PaaS due to the absence of environmental changes. The average redeployment time for all offerings is 7.02 min and only deviates by 65 seconds. Some vendors still benefit from a better deployment configuration, e.g., parallelized Bundler runs. Vendors that were fast during the initial deployment confirm this tendency in the redeployment measurements. Based on these observations, it is interesting to check if there still are significant differences between VM-based and container-based environments when it comes to redeployment. We used the Shapiro-Wilk and Mann- Whitney U tests in the same fashion as above to confirm this. As before, the distribution of redeployment times is clearly non-normal. The resulting Mann-Whitney U test (
BC: 146,
F $F0G: 423, J: 53089.5) again allows to reject the null hypothesis with a p-value of 2.2
@7Ain favor of the alternative: Container-based environments also redeploy significantly faster than VM-based environments.
In a final step, we compared the deployment and redeployment times of all pairs of vendors with each other using the Mann-Whitney U test as above. The aim of this comparison is to investigate if there is a performance gain in choosing a particular vendor, or if it is sufficient to decide between VM-based and container- based vendors. Put differently, we checked if there are significant differences among the container-based vendors as well. We omit a detailed presentation of the results here due to the amount of comparisons necessary (each pair of vendors needs to be tested for deployment and redeployment times, i.e., 42 combinations), but the results are unambiguous: There are significant differences in the deployment times of all
vendors, except for one combination of two container- based environments. Almost the same holds for redeployment times, where significant differences can be diagnosed for all but two pairs of container-based environments. This observation also holds for our control pair Bluemix and Pivotal which both use Cloud Foundry as base platform. This indicates that platform and infrastructure configuration can also make a difference for customers even when just switching the hosting provider of the same PaaS system. To sum up this paragraph, even container-based environments differ significantly in their deployment performance and, thus, a performance gain can be obtained by using the fastest vendor. Whereas this observation was only validated for application deployment in this study, it can be expected that this also holds for application response times, which should be investigated separately.
Deployment effort (DE). The values for total deployment effort are substantially different between the platforms, with a maximum spread of 41 and a standard deviation of 13. Most container-based platforms are within a close range to each other, only deviating by a value of 4, whereas VM-based platforms generally require more effort. When comparing both platform types, the additional effort for VM-based PaaS buys a higher degree of flexibility with the platform configuration if desired.
Figure 9. Overall Deployment Effort
3.3 S UMMARY
With the help of this study, we could answer both of our initial research questions. To begin with, it is possible to migrate a real-world application to the majority, although not to all, of the vendors (RQ 1). Only one vendor could not run our application due to a security restriction caused by a software fault, which cannot be seen as general restriction that prevents the portability of the application. However, we could not reproduce the exact application setup on all vendors. We had to make trade-offs and changes to the technology setup, especially the server startup. With the automation
14
18 18 19
27 34
55
0 10 20 30 40 50 60
Heroku Pivotal Bluemix cloudControl OpenShift EngineYard Beanstalk Steps & Parameters (EDS) Code Changes (NCC) Build (NBS)
Container-based VM-based
of the migration, together with the presented toolkit and deployment metrics, we could quantify the effort of the migration (RQ 2). Our results show that there are considerable differences between the vendors, especially between VM-based and container-based offerings. Our measurements provide insights into migration effort, both quantifying the developer effort caused by deployment steps and code changes, as well as effort created by deployment and redeployment times of the application.
R ELATED W ORK
4
Jamshidi et al. (2013) identified that cloud migration research is still in its early stages and further structured work is required, especially on cloud migration evaluation with real-world case studies. Whereas this structured literature review focuses on legacy-to-cloud migration, our own investigations reveal even more gaps in the cloud-to-cloud migration field. Most of the existing work is published on migrations between on-premises solutions and the cloud, primarily IaaS. Few papers focus on PaaS and even less on cloud-to-cloud migrations, despite the fact that portability issues between clouds are often addressed in literature (Hogan, Liu, Sokol, &
Tong, 2011; Petcu, Macariu, Panica, & Cracium, 2013; Di Martino, 2014; Silva, Rose, & Calinescu, 2013; Badger, Grance, Patt-Corner, & Voas, 2012). This study is a first step towards filling the identified gaps.
In (Kolb & Wirtz, 2014), we already ported a small application between five PaaS vendors in an unstructured way and gathered first insights into portability problems and migration efforts. These initial results revealed that more research has to be carried out in a larger context. Likewise, a large proportion of existing cloud migration studies are confined to feasibility and experience reports, e.g., (Chauhan &
Babar, 2011; Chauhan & Babar, 2012; Vu & Asal, 2012).
These studies typically describe a migration case study including basic considerations of provider selection and application requirements and afterwards present a compilation of occurred problem points and necessary implementation changes during the application migration. Nevertheless, all of them omit a quantification or a more detailed comparison of migration effort.
A large part of more structured research on cloud migration prioritizes migration planning over the actual migration execution and observation. These studies focus on abstracting and supporting the migration process with decision frameworks rather than quantifying and examining actual migrations with metrics. Pahl and Xiong (2013) introduce a generic PaaS migration process for on-premises applications. Their framework is mainly motivated by a view on different organizational and technological changes between the systems, but not focused on a detailed case study or
measurement. Others, like Hajjat et al. (2010) and Bessera et al. (2012), focus on minimizing cost aspects in their migration decision processes. A broader set of target variables is presented by Menzel and Ranjan (2012) who propose an approach for cloud migration based on multi-criteria decision making, specifically for use with web server migration.
In contrast to these abstract migration processes, also several studies exist to assist automatic application inspection and transformation for migration execution.
Sharma et al. (2013) utilize a set of repositories containing patterns of technical capabilities and services for on-premises applications and PaaS offerings. By analyzing the source code as well as the configuration files, they try to extract application requirements and map them with the capabilities of target cloud platforms.
The approach results in a report that describes which parts of the system can be migrated as-is, which parts require changes, as well as a listing of those that cannot be migrated due to the limitations of the target platform.
Beslic et al. (2013) discuss an approach for an application migration among PaaS vendors related to our study. Their scenario includes vendor discovery, application transformation, and deployment. In this regard, they propose to use pattern recognition via static source code analysis and automatic transformations between different vendor-specific APIs. Nonetheless, besides outlining their migration processes, none of the referenced papers quantify the effort of the described translations.
When it comes to the measurement of the migration effort, most existing research is focused on estimating expected costs in an early phase of the development cycle, whereas we are evaluating factual changes after the implementation phase. Popular examples for generic algorithmic model estimation approaches are COCOMO (Boehm, et al., 2000) or Putnam (Putnam, 1978). However, such traditional algorithmic models were developed in the context of software development projects, not for on-premises or cloud migration (Sun &
Li, 2013). Based on the accepted estimation model function points (Albrecht & Gaffney, 1983), Tran et al. (2011) define a metric, called cloud migration point (CMP), for effort estimation of cloud migrations. Another study by Sun and Li (2013) estimates expected effort in terms of man hours for an infrastructure-level migration. Similar, Miranda et al. (2013) conduct a cloud-to-cloud migration between two IaaS offerings that uses software metrics to calculate the estimated migration costs in man hours rather than making migration efforts explicit. When unveiling occurred effort, the focus is often on operational cost comparisons (Khajeh-Hosseini, Greenwood, &
Sommerville, 2010; Khajeh-Hosseini, Sommerville,
Bogaerts, & Teregowda, 2011; Tak, Urgaonkar, &
Sivasubramaniam, 2011; Andrikopoulos, Song, &
Leymann, 2013), e.g., infrastructure costs, support, and maintenance or migration effort in man hours (Tran, Keung, Liu, & Fekete, 2011; Maenhaut, Moens, Ongenae,
& De Turck, 2015). Solely, Ward et al. (2010) mention migration metrics related to the effort to create build automation or the server provisioning time comparable to our deployment metrics.
L IMITATIONS AND F UTURE W ORK
5
As common for a case study, several limitations exist, which also provide potential areas of future work. First of all, the presented study was conducted with a particular Ruby on Rails application. In future work, we want to investigate the generalizability of the conclusions drawn, i.e., if they also apply for applications built with other runtime languages. Initial experiments back up the presented results and indicate that other languages potentially require an even higher migration effort. Due to their general applicability, our methodology and provided tools can be used to obtain results for other migration scenarios as well. Another main topic for further research, indicated by this paper, is the unification of management interfaces for application deployment and management of cloud platforms. Despite semantically equivalent workflows, the current solutions are invariably proprietary at the expense of recurring developer effort when moving between vendors. To overcome this issue, we are currently developing Nucleus
12, a RESTful abstraction layer and Ruby gem that unifies core management functions of PaaS systems. It forms a next step in our ongoing efforts towards a unified management interface for Platform as a Service. As revealed by our study, further work is needed regarding the unification of runtime environments between cloud vendors and also on-premises platforms for improved portability of applications. Buildpacks are a promising step in that direction. Another need for research is the performance evaluation of cloud platforms. During our tests, we observed performance differences between the vendors that are hard to quantify from the viewpoint of a customer at this time. However, this is vital for a well- founded cost assessment and, hence, should be investigated further.
C ONCLUSION
6
In this paper, we carried out and evaluated the migration process for a real-world application among seven cloud platforms. As a first step, we examined the feasibility of the application migration by manually
12