Research Collection
Journal Article
The impact of urban district composition on storage technology reliance: trade-offs between thermal storage, batteries, and power-to-hydrogen
Author(s):
Petkov, Ivalin; Gabrielli, Paolo; Spokaite, Marija Publication Date:
2021-06-01 Permanent Link:
https://doi.org/10.3929/ethz-b-000473364
Originally published in:
Energy 224, http://doi.org/10.1016/j.energy.2021.120102
Rights / License:
Creative Commons Attribution 4.0 International
This page was generated automatically upon download from the ETH Zurich Research Collection. For more information please consult the Terms of use.
ETH Library
The impact of urban district composition on storage technology
reliance: trade-offs between thermal storage, batteries, and power-to- hydrogen
Ivalin Petkov
a,*, Paolo Gabrielli
b, Marija Spokaite
aaGroup for Sustainability and Technology, ETH Zurich, 8092, Zurich, Switzerland
bInstitute of Energy and Process Engineering, ETH Zurich, 8092, Zurich, Switzerland
a r t i c l e i n f o
Article history:
Received 14 October 2020 Received in revised form 15 January 2021 Accepted 9 February 2021 Available online 18 February 2021
Keywords:
District multi-energy systems Power-to-hydrogen Seasonal energy storage Optimization under uncertainty Energy system design Zero-emissions energy systems
a b s t r a c t
The composition of urban districts - residential, commercial, or‘mixed’topologies - can have drastically different energy load profiles and peak demands, leading to altered optimal District Multi-Energy System (D-MES) designs. Although demand-influenced differences in D-MES designs are generally understood, there is a research gap of how the interplay of various storage technologies differs between topologies. In this paper, we investigate the extent of D-MES reliance on storage technologies over various district topologies in central Europe. The core of this analysis relies on a multi-objective MILP optimization model utilized in an uncertainty analysis framework.
Optimal D-MES results show distributions of designs which vary depending on uncertain parameters.
For district energy planners, mainfindings show that mixed districts are the most promising case for D- MES planning due to a diversified demand type balance leading to lower costs and emissions. Residential districts typified by high peaks demonstrate larger storage requirements. All three storage technologies are key components of low emissions D-MES, enabling increased sector-coupling and renewable self- consumption. Such districts utilize power-to-hydrogen seasonally while batteries are relied upon for short-term load management. The most influential parameters for power-to-hydrogen installation are mainly attributed to competing technologies on the electric (batteries) and thermal (ASHPs) sectors.
©2021 The Author(s). Published by Elsevier Ltd. This is an open access article under the CC BY license (http://creativecommons.org/licenses/by/4.0/).
1. Introduction
A significant number of towns and cities around the world are transitioning towards renewable energy-based systems with goals to decarbonize all sectors by as early as 2030 [1]. At urban scales, District Multi-Energy Systems (D-MES) have demonstrated lower costs and CO2emissions than traditional energy systems which rely on the electric grid and utilize fossil fuel heating systems. D-MES integrate multiple conversion, storage, and network technologies, leading to the interaction of multiple energy carriers enabling increased self-consumption of renewable energy and flexible sector-coupling [2]. Although, the cost-effectiveness and decar- bonization potential of D-MES can be highly disparate depending on the composition of urban districts, as demonstrated in several studies [3e6]. Urban districts generally have compositions of
building energy load profile types such as residential, commercial, industrial, or‘mixed’encompassing electric, heating, and cooling demands. Defined as district topologies, each possess different load profile shapes and peak demand patterns at daily to seasonal scales.
To manage various district load topologies, a particular focus for the design of optimal D-MES must consider the necessity of various energy storage mediums for providing energy demand side man- agement [7] and/or temporal shifting of demands [8,9]. While the influence of energy demands on D-MES design manifestations are generally understood for the majority of D-MES technologies [10], there is a research gap regarding the optimal interplay of short- and long-term storage technologies between district topologies [11,12].
General D-MES studies focus on the design of single- or multi- site configurations across different scales and settings. For instance, both Bracco et al. [13] and Orehounig et al. [14] presented mixed integer linear programming (MILP) models for the optimal design and operation of D-MES, in Northern Italy and for a rural alpine community in Switzerland, respectively. Particular focus in both papers was on achieving energy autonomy and self-
*Corresponding author.
E-mail address:epetkov@ethz.ch(I. Petkov).
Contents lists available atScienceDirect
Energy
j o u r n a l h o m e p a g e :w w w . e l s e v i e r . c o m / l o c a t e / e n e r g y
https://doi.org/10.1016/j.energy.2021.120102
0360-5442/©2021 The Author(s). Published by Elsevier Ltd. This is an open access article under the CC BY license (http://creativecommons.org/licenses/by/4.0/).
sufficiency with renewable energy. Other studies focused on other particular aspects and considerations of D-MES design and opera- tion such as retrofitting, interconnection, and sector-coupling. Wu et al. [15] presented a MILP model considering the simultaneous optimization of D-MES and retrofitting for a range of building types in Switzerland. Wouters et al. [16] developed a multi-site MILP for a residential D-MES in South Australia considering interconnection.
Comodi et al. [17] developed a model for the optimal design of an energy system composed of multiple interconnected D-MES located infive sites at a university campus in Singapore. Flores and Brouwer [18] also focused on a university campus, presenting a model for the optimal design of an energy system in California considering both building energy demands and transportation needs of campus fleet vehicles. While all of the aforementioned papers demonstrated the importance of various energy storage technologies for decarbonization, the storage time horizon is generally of a short-term basis due to model computational constraints.
Focusing on similar key technologies, multiple studies explored the role of seasonal energy storage in optimal D-MES designs as a means to address increasing local utilization of renewable energy.
Both Ata et al. [19] and Murray et al. [20] explored sector-coupling integration in D-MES between the building and mobility sectors through optimization frameworks. McKenna et al. [21] investigated the role that seasonal thermal storage plays in the optimal design of a D-MES for a German residential district with high fractions of renewable heat supply. Nastasti et al. [22] explored the role of Power-to-Hydrogen (PtH2) to supply both mobility and thermal energy at an urban-scale. Giannakoudis et al. [23] presented a stochastic optimization under uncertainty framework including hydrogen storage, although without taking different demand sce- narios into account. The results from Refs. [4,20e22] are in agree- ment that seasonal energy storage - no matter the energy carrier - is utilized solely in deep decarbonization (i.e. minimum emissions) scenarios due to significant cost increases and necessity of a high renewable energy surplus.
While seasonal energy storage presents great value for decar- bonizing sectors such as buildings, mobility, and industry, effi- ciently integrating its technical characteristics in optimization models presents challenges. Recent advances, particularly Gabrielli et al. [24] and Kotzur et al. [25], investigated optimal D-MES design with seasonal storage and introduced methods that can perform the design task without the need to consider a full year’s horizon in hourly time steps, hence, significantly reducing the models’ computational burden. Particularly, Gabrielli et al. [24] focused on the role of seasonal storage with PtH2for D-MES for which this study relies on as a modeling basis.
Designing reliable D-MES must account for parameter
uncertainty to avoid suboptimal results. This necessitates capturing the stochastic nature of techno-economic and contextual parame- ters in a certain economic or geographic area. Comprehensive ap- proaches to investigate the impacts of uncertainty in the context of optimal D-MES design are presented in Mavromatidis et al. [3] and Karmellos et al. [26]. Further, Shams et al. [27] presented a sto- chastic model for D-MES operative scheduling with electrical and thermal demand response programs for increased resilience. Wang et al. [28] developed an optimization and robustness analysis framework based on various load scenarios along with demand and environmental condition uncertainties. General analytical exam- ples for designing robust D-MES under multiple uncertainties are given in Refs. [29,30] with further detail into risk management in Refs. [31,32]. In summary, the aforementioned uncertainty analyses generally point to the importance of energy demand patterns, environmental conditions, along with parameter input data (in- terest rates, energy prices, feed-in-tariffs, etc.) for influencing D- MES design and operation.
Overall, there is a need to further understand the interplay of various energy storage technologies in various district topologies with uncertainty. In this paper, we investigate the role of short- term energy storage - Hot Water sensible Thermal Storage (HWTS) and electrical battery storage - along with seasonal energy storage - PtH2 - for D-MES over various district topologies in a central European climate zone (Dfb temperate continental/humid continental on the K€oppen-Geiger system [33]). We accomplish this by relying on an optimization with uncertainty framework based on Monte Carlo (MC) simulations, followed by a global sensitivity analysis (GSA) using a two-sample Kolmogorov-Smirnov (KS) test. For the purpose of this work, we take a‘current to near- future’ European viewpoint towards all techno-economic and context parameters. We utilize the uncertainty characterization provided in the in-depth literature review presented in Petkov and Gabrielli [4]. We build on the aforementioned study to understand the importance and varied influence of uncertain parameters and district topology on storage technology inclusion in D-MES design and operation.
This paper is structured as follows. Section2describes the fea- tures of the investigated D-MES, formulates the optimization problem, and describes all relevant input data. Results and dis- cussion are presented in Section 3, and finally conclusions are drawn in Section4.
2. District multi-energy system modeling
Here, wefirst describe the D-MES topology, followed by the optimization framework which were originally presented in Ref. [24]. Next, we present the district load profile topologies, Nomenclature
A constraint matrix B constraint matrix
c cost vector
d cost vector
x continuous decision variables y binary decision variables T length of the time horizon
ASHP electricity-driven Air-Source Heat Pump COP Coefficient of Performance
D-MES District Multi-Energy System EC Electrolyzer
FC Fuel Cell
GSA Global Sensitivity Analysis H2St Hydrogen Storage
HWTS Hot Water sensible Thermal Storage KS Kolmogorov-Smirnov
MC Monte Carlo
MILP Mixed Integer Linear Programming PEM Proton Exchange Membrane PtH2 Power-to-Hydrogen PV Photovoltaic UA Uncertainty Analysis
WT Wind Turbine
followed by the uncertainty analysis, with further detail on both provided in Ref. [4].
2.1. System topology
The D-MES can be considered a centralized‘energy hub’where energy is converted and stored centrally to be delivered to end- users in a district. The optimization model returns the optimal selection and size of the considered conversion and storage tech- nologies, as well as their hourly operation over the year. The D-MES has four energy carriers (electricity, heat, natural gas, and H2), and consists of the nine conversion and storage technologies - solar photovoltaic panels (PV), wind turbines (WT), electrically-driven air-source heat pumps (ASHP), natural gas boilers, HWTS, li-ion batteries, and namely, the PtH2system, consisting of a proton ex- change membrane electrolyzer (PEMEC), a PEM fuel cell (PEMFC) and a pressurized H2storage tank at 40 bar. The D-MES is assumed to be connected to both the NG and electricity grids.
2.2. Optimization framework
The optimization problem is formulated as a deterministic mixed integer linear program (MILP) that determines the optimal selection, size, and operation of the considered technologies to satisfy the energy demands while minimizing for total system cost and/or CO2emissions over a one year time horizon. It is written generally as:
minx;y
cTxþdTy
(1)
s:t:AxþBy¼b
x02RNx;y2f0;1gNy
wherexandyrepresent the continuous and binary decision vari- ables with the corresponding cost vectorscandd, and constraint matricesA,B;bis the constraint known-term;NxandNyindicate the dimension ofxandy, respectively. Both continuous and binary variables are optimized. Total annual costs are given by the sum of capital, operation, and maintenance costs. We utilize the augmented epsilon-constraint (ε-constraint) to not completely exclude the total cost in the minimum-emission optimization [34].
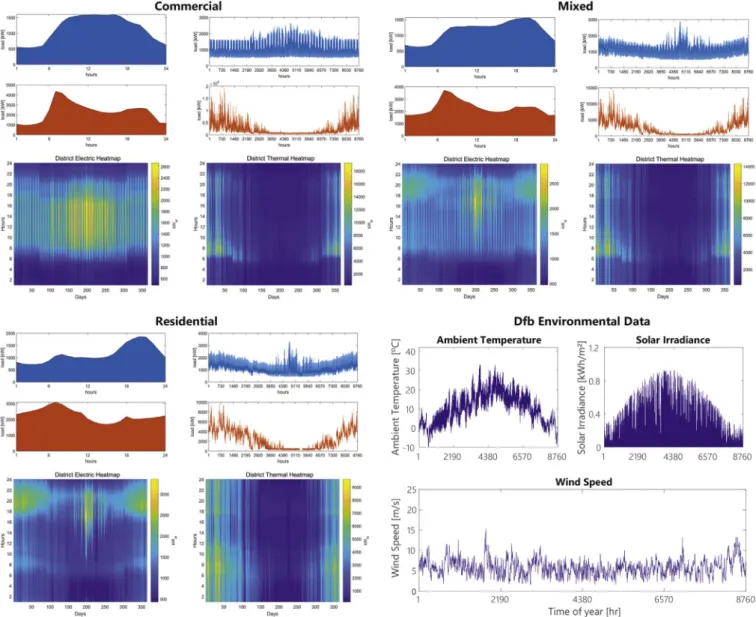
The optimization framework requires input data such as envi- ronmental conditions, energy demands, along with techno- economic and context parameters. Environmental conditions and energy demands, presented inFig. 1, are considered deterministic as they are addressed in Ref. [31], while uncertain technology (costs, efficiencies, etc.) and context (energy carrier prices, eco- nomic parameters, and carbon intensities of the electricity grid) parameters are captured in a comprehensive literature review demonstrated in the Uncertainty Characterization section of [4].
2.3. District topology
In this work, we compare various urban district load profile topologies defined as compositions of residential, commercial, and
‘mixed’energy load profile types. To output meaningful results, acquiring accurate energy demand profile data is pivotal. Unfor- tunately, it is difficult to access hourly energy demand profile data which is accurate enough to model the interactions between electrical, heating, and cooling demands. Ferrari et al. [35] pre- sented a review of over 70 papers for methods of estimating building energy demands at a district level, highlighting the need
for reliable demand profiles at an hourly resolution for D-MES design. Few databases are freely available online to quickly extract demand profiles from reference buildings which are climate zone referenced. Of course, any reference building energy demand pro- file database will be an estimation for the use case of interest, and gathering real-world data is paramount. Nonetheless, if this is not possible, it is still important to have a profile of reference for various building types.
To generate district load profiles of various district topologies, we developed a methodology based on one of the few available freely accessible reference building energy demand databases which is maintained by the U.S. Department of Energy (DOE) Building Technologies program and the Office of Energy Efficiency and Renewable Energy (EERE) [36]. These reference residential and common commercial buildings (16 types) were based on the Building America House Simulation Protocols (residential) and DOE Commercial Reference Buildings in all typical meteorological year (TMY) 3 locations. The hourly profiles are based on TMY3 data from 1991 to 2005 conducted by the National Solar Radiation Database, which is the most recent version as of this writing. The open-source database contains residential and commercial energy demand data available on OpenEI [37]. Although it is climate-referenced for U.S.
IECC climate zones, this can easily be converted to the global K€oppen-Geiger climate zone classification for wider applicability [33].
Thermal and electrical district load profiles are synthesized based on various proportions of residential and commercial building profiles based on the‘Dfb’central European climate zone for three district topologies - residential, commercial, and mixed.
Further details regarding district load synthesis are provided in Appendix B of Petkov and Gabrielli [4]. Although, in this work, we synthesize various district topologies in one climate zone to eval- uate the impact of load types on general D-MES design and storage technology installation and operation. For the purpose of compar- ison for D-MES design, districts have equally sized annual electric demands (10 GWh/yr) with thermal loads scaled to the climate zone based on a thermal-to-electrical ratio. The Dfb climate zone has an average ratio of 2, and thus the districts have annual thermal demands of 20 GWh/yr. Nonetheless, energy demand profile sea- sonality is kept intact allowing for the basis of comparison for peak load profiles which strongly differ between district topologies, depicted inTable 1. The significant differences in seasonality of both commercial and residential district energy profiles can be easily seen in the heatmaps ofFig. 1. Commercial profiles are typified by
‘working-hours’electrical demands peaking in the summer, along with having the highest thermal peak of all topologies. Residential profiles are typified by larger seasonalities, possessing the highest electrical peak of all profiles, typically later in the evening and more accentuated in the summer months, while thermal peaks occur earlier in the morning compared to the commercial profile. The mixed district combines both commercial and residential profiles, allowing for smoother peaks and demand seasonalities.
2.4. Uncertainty analysis
We briefly describe the uncertainty analysis (UA) framework originally reported in Ref. [4]. To attain a distribution of optimal designs, MC simulations are conducted to account for interactions between different input factors from the uncertainty character- ization of techno-economic and context parameters, allowing for further sensitivity analysis of uncertain parameters in the D-MES.
While general optimization studies with deterministic data inputs present Pareto fronts between the multiple objectives of minimum- cost and minimum-emissions, in this work we only analyze the
‘pure’objective results over the three district topologies. For each of these six cases, we run 300 MC simulations to adequately account for the techno-economic uncertainty.
Next, we perform a GSA to evaluate the most influential pa- rameters on the system design. We utilize the two-sample KS test in order to statistically account for the differences between empirical results in the MC simulations. This involves setting a threshold value to ‘filter’ MC results between those that are behavioral or non-behavioral, allowing for the identification of the
most influential parameters. For example, we use the KS testfind the set of MC results which present the most sensitive parameters for which high fractions (i.e. over quartile 3) of PtH2are installed.
3. Results and discussion
First, we explore the objective function results of both system costs and CO2 emissions. Next, the optimal D-MES design and operation are presented, followed by a focus on storage technolo- gies and PtH2operation and the GSA.
3.1. Objective functions
Fig. 2 shows the total system costs (top) and CO2 emissions (bottom) for all the cases investigated. Similar objective function results of previous multi-objective optimizations studies [3e6,31]
are seen with decreasing emissions involving an increase in cost, and vice versa.
Fig. 1.District energy demands across topologies, with electricity demands shown in blue, and thermal demands shown in red. Average daily (top-left) and annual (top-right). Heat maps of electricity (bottom-left) and thermal (bottom-right). Note scales vary between district subplots. Environmental data (ambient temperature, solar irradance, and wind speed) presented on bottom-right. (For interpretation of the references to colour in thisfigure legend, the reader is referred to the Web version of this article.)
Table 1
District topology peak energy demands. Annual demands scaled equally for all districts - electric 10 GWh/yr, thermal 20 GWh/yr - based on the climate zone.
Peak demand [MW]
Electric Thermal
Commercial 2.67 19.26
Mixed 2.90 14.33
Residential 3.36 9.61
As we do not consider life cycle analysis in this study, all district topologies are able to achieve zero operational CO2emissions in the minimum-emissions objective. System emissions at the median in the minimum-cost objective are nearly equal between the com- mercial and residential districts, although 4% lower in the mixed district due to a more favorable relationship between energy de- mands to renewable generation, leading to fewer storage re- quirements. The minimum-cost emissions quartile ranges are similar for all districts, while the commercial district shows the highest possible emissions up to nearly 490 gCO2/kWh, corre- sponding with the highest thermal peak and thus boiler usage.
Regarding system costs in the minimum-emissions objective, the commercial and mixed district see similar total system costs at the median, while the residential district shows a 14% increase. This is likely due to the higher nighttime electric peak particularly in winter and thus higher storage requirements. As the minimum- emissions objective cost ranges are significantly larger than for the minimum-cost objective, the inset figure (axis on right) is necessary to demonstrate the cost objective’s range. Nonetheless, a similar pattern is observed in the minimum-cost objective, with the residential district difference decreasing to 2%.
3.2. D-MES design and operation
Trends in objective functions can be better understood by looking at the D-MES design through technology selection and size.
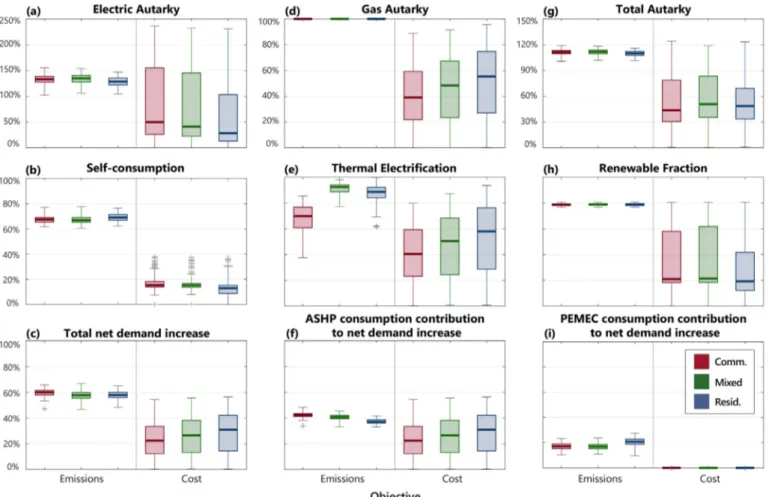
Conversion and storage technology size results are presented in Fig. 3and inTable 2for median values. Further,Fig. 4demonstrates technology contributions to system costs along with relevant sys- tem metrics such as autarky, self-consumption, thermal electrifi- cation, and net demand increase.
Minimum-emissions optimizations achieve zero operational CO2 emissions with maximal sizing of renewable conversion technologies (solar PV and WTs), reliance on ASHP and PEMFC for electrified heat, along with high utilization of batteries for short- term electrical energy balance. As the residential district has the highest electrical peak and system costs, technologies which input electricity as an energy carrier are sized higher relative to peak (ASHP and battery) while the opposite is true for the commercial district, which possesses the highest thermal peak and, accordingly, has higher sizing of HWTS and boilers. When going from the minimum-cost to minimum-emissions objectives, there is a direct trade-off of boilers for ASHPs, demonstrated by thermal electrifi- cation patterns inFig. 4.e. In the cost objective, districts mainly rely Fig. 2.Objective function outputs of total annual costs (top) and CO2emissions (bottom) for the three district topologies and two different objective functions (from left to right:
minimum CO2emissions to minimum cost). Boxes span from 25% to 75% quartile, with median reported in bold. Crosses represent outliers. Insetfigure for minimum-cost objective system costs has axis displayed on right.
on boilers for heating and to a lesser extent ASHPs, while still relying on renewables, demonstrating the present-day attractive- ness of renewable-powered D-MES. Due to thermal electrification from ASHPs and PEMEC, total net demand increases (Fig. 4.c., f., and i.) by around 60% with little variation between district topologies in the emissions objective, while in the cost objective a large range is presented due to the varied ASHP installations. Although the cost objective districts are largely autarkic, self-consumption is low due to lack of sufficient energy storage, shown in the large ranges of autarkies (Fig. 4.a., d., and g.) and thermal electrification (Fig. 4.e.).
In both objectives, the commercial district has higher electric
autarky but similar self-consumption to other districts due to higher electricity exports. On the other hand, the residential district has the lowest electric autarky, self-consumption, and exports due to difficulties in meeting higher electrical peaks in winter. A similar but opposite pattern for thermal demand is observed for the commercial district, achieving the lowest gas autarky in the cost objective.
3.3. Storage technologies
Renewable energyfluctuations can be balanced both by utilizing Fig. 3.Conversion and storage technology size ranges across districts. To normalize technology sizes between district demands, sizes were scaled based on peak electric (Elecp) or thermal (Thermp) loads. Storage technologies were scaled based on annual demands. Note different scales for each subfigure, and PEMFC scale by electric peak. Boxes span from 25%
to 75% quartile, with median reported in bold. Crosses represent outliers. Median values for actual technology sizes and relevant metrics shown inTable 2.
Table 2
Median conversion and storage technology sizes and relevant metrics across districts to complement results inFig. 3. Technology sizes are reported in [kW] for conversion technologies and in [kWh] for storage technologies. Relevant metrics are reported as technology sizes scaled based on electric peak (Elecp), thermal peak (Thermp), or total energy demand (Demand).
District Median actual capacity [kW] or [kWh] Median relevant metric [scaling]
Commercial Mixed Residential Commercial Mixed Residential
Objective Emissions Cost Emissions Cost Emissions Cost [scaling] Emissions Cost Emissions Cost Emissions Cost
Technologies[unit] PV[kW] 4929 4929 4929 4929 4929 4028 Elecp 1.87 1.87 1.72 1.72 1.49 1.22
WT[kW] 22,500 e 22,500 e 22,500 e Elecp 8.44 e 7.77 e 6.70 e
PEMEC[kW] 2632 e 3252 e 2926 e Elecp 0.99 e 1.12 e 0.87 e
PEMFC[kW] 3244 e 4765 e 5083 e Elecp 1.22 e 1.65 e 1.51 e
Boiler[kW] e 11,006 e 8513 e 6755 Thermp e 0.57 e 0.59 e 0.70
ASHP[kW] 2858 353 2181 480 1836 606 Thermp 0.15 0.02 0.15 0.03 0.19 0.06
HWTS[kWh] 45,806 26,371 40,154 17,156 30,788 9107 Demand 0.0015 0.0009 0.0013 0.0006 0.0010 0.0003
Battery[kWh] 434,424 e 447,523 e 498,022 e Demand 0.015 e 0.015 e 0.017 e
H2St[kWh] 2,468,859 e 2,382,117 e 2,635,597 e Demand 0.083 e 0.080 e 0.088 e
different energy storage technologies and interacting with the grid.
Although, it must be noted that in the emissions objective, the optimization chooses not to import electricity in order to avoid inherent grid emissions, based on the electric grid’s carbon in- tensity. As a function of total annual energy, the residential district has a higher reliance on batteries compared to the commercial district (median battery storage of total energy 2.5% vs. 2.2%, respectively), while the commercial district has a higher reliance on HWTS (median HWTS storage of total energy 0.15% vs. 0.23%, respectively). At the median, the mixed district sees the lowest reliance of H2St as a fraction of total energy (11.9%) due to the smoother peak demand profiles, followed by the commercial dis- trict (12.3%), and the residential district (13.2%) - to be explored further in the GSA. In general,Fig. 3shows that H2St contributes a range of 7e15% of annual demands, while batteries and HWTS are used for short-term energy balancing to a much smaller degree.
Although batteries provide a fraction of the energy of H2St in the emissions objective, batteries take the majority of total system costs, ranging from 70 to 80% of total costs, trending slightly higher to the residential district, shown inFig. 4. This leads to higher self- consumptionfigures by 5% at the median for the residential district.
This demonstrates the importance of batteries for short-term en- ergy balancing to achieve low emissions D-MES. On the other hand, while H2St contribute to a larger fraction of energy demands, their contribution to total costs are much lower than batteries, with a range of 15e25% of total system costs. Here, we demonstrate the value of the offsetting the seasonal mismatch between renewable energy and energy demand.
Although PEM technologies are sized slightly higher in the mixed district emissions objective relative to electric peak,Fig. 5 shows the 2% higher contribution to both net electric and ther- mal loads in the residential district. The same pattern is seen in Fig. 4.i. with the PEMEC contribution to net electric load andFig. 3.i.
with the H2St. Since the FC has a higher ratio of electrical to thermal efficiency, it contributes more to net annual electric demand, demonstrating the importance of electrical peak in sizing PtH2
systems across D-MES topologies.
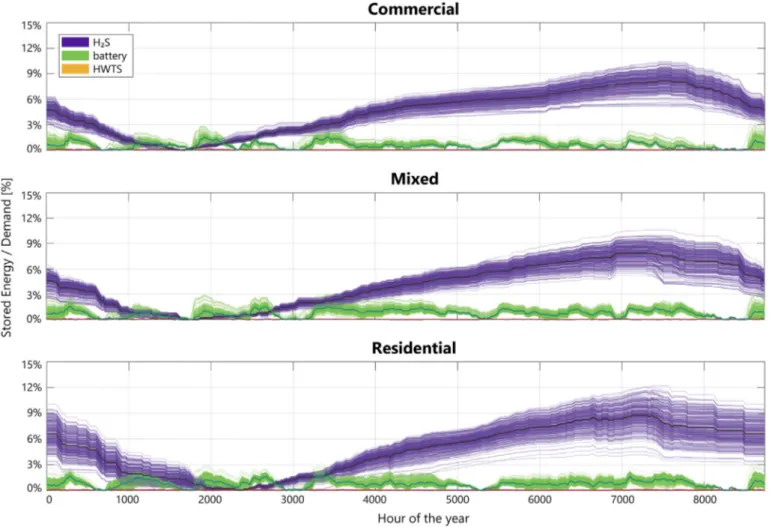
PtH2is used to maximize self-consumption and thermal elec- trification to achieve zero operational CO2emissions, aligning with thefindings of previous studies [4,5,31]. The system operates ac- cording toFig. 6, with HWTS used for maximum weekly cycles, and batteries used for maximum 3 month cycles. H2St follows a highly seasonal pattern of charging in the summer and discharging in winter, with peaks occurring around 7500 h and valleys around 1500e2500 h depending on district demands. Specifically, the commercial district has a zero-point at 1500 h while the residential does at 2500 h. This is attributed to the residential districts’ lingering heating demands into the springtime, shown in Fig. 1.
Further, the residential MC runs show a wider range of H2St peaks, implicating a trade-off of peak demand management depending on the sampled input data. The value of H2St as a seasonal storage option is due to the lack of self-discharge in the PtH2 system, despite its low round-trip efficiency compared to the short-term storage options of batteries and HWTS, which possess higher effi- ciencies and self-discharges.
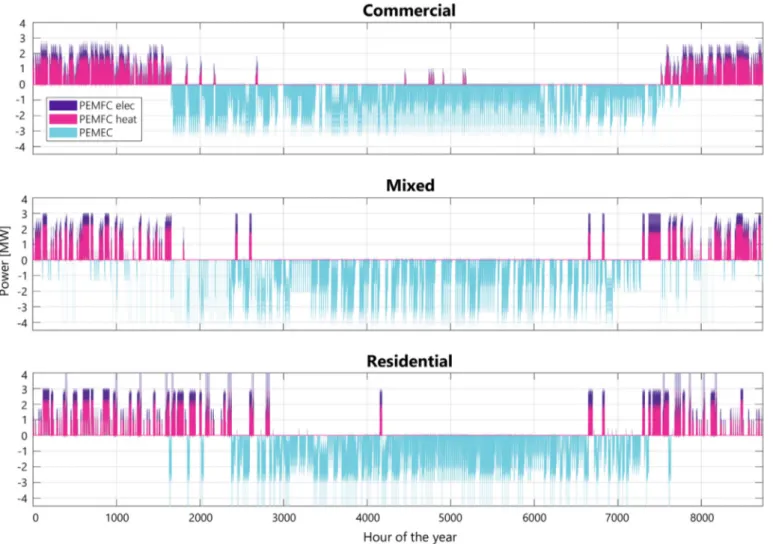
Fig. 7 shows the PEM technology operation for all districts, Fig. 4.System-related post-process metric ranges across districts. Note different scales between top rows in subfigures (a), (d), and (i) Boxes span from 25% to 75% quartile, with median reported in bold. Crosses represent outliers.
demonstrating a generally seasonal operation with rare‘outliers’of FC utilization in the summer months based on the input demands.
As the residential district is typified by a higher wintertime elec- trical peak compared to the available renewable balance, there is a higher reliance on PtH2. This is demonstrated by higher peaks of PEMFC output in accordance to the lack of renewables, whereas the commercial and mixed district see smoother PtH2operation during a smaller time period in the winter.
3.4. Global sensitivity analysis
We now present the two-tailed KS test results for PtH2instal- lation and operation for the emissions objective, based on testing for the most sensitive parameters at quartile thresholds along with a subjective‘high’value for each PtH2 technology across district topologies.
Fig. 8illustrates this as an example for the PEMFC (top) and Fig. 5.PEMFC technology contributions to net electric (left) and thermal loads (right) between districts. Boxes span from 25% to 75% quartile, with median reported in bold.
Fig. 6.Stored energy in HWTS, batteries, and H2St for the minimum-emissions district topologies for all MC runs (median value shown as separate color).
PEMEC (bottom) for the commercial district, taken at quartiles 3 and 2, respectively. These are found to represent the six most influential parameters across all district topologies, although in different orders depending on the quartile tested. Overall, the most influential parameters are, in order of significance: (1) ASHP effi- ciency (coefficient of performance - COP), (2) PEMEC efficiency, (3) Battery self-discharge, (4) capital cost, and (5) lifetime. Summa- rized, the most influential parameters for PtH2 are the key pa- rameters of competing electrical (batteries) and thermal (ASHPs) technologies. Competition exists between ASHPs and batteries with PtH2for electrified thermal and electrical storage, respectively, in order to meet the minimum-emissions objective. This is comple- mentary to thefindings of Petkov and Gabrielli [4] adding to the significance of battery self-discharge as a dynamic consideration of round-trip efficiency for electrical storage competition. Further, at high values of PtH2installation, the PEM technologies’capital costs, lifetimes, and efficiencies also become significant.
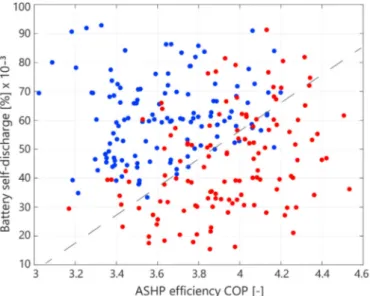
The relationship between the important parameters of competing technologies to PtH2 - ASHP COP and battery self- discharge - are shown inFig. 9. Interestingly, there is direct trade- off (demonstrated by the diagonal separation) of high PtH2instal- lation between various levels of ASHP COP and battery self- discharge - at high (low) ASHP COP and low (high) battery self- discharge, we see low (high) PtH2installation.
4. Conclusions
This work presents an analysis of the optimal interplay of short- and long-term storage technologies between urban district topol- ogies defined as compositions of residential, commercial, or‘mixed’ energy profiles. We utilize a MILP optimization coupled with an uncertainty analysis framework to explore the relationship be- tween district energy topologies and storage technology installa- tion and operation, with a particular focus on seasonal energy storage. After analyzing the various D-MES technology selection and sizing considerations between district topologies through Monte Carlo simulations, we determine key D-MES sensitivities of uncertain input parameters on PtH2installation. This complements the work of Petkov and Gabrielli [4] by providing depth on the impact of district topologies and parameter uncertainty on D-MES design within a central European climate zone.
In the emissions objective, all districts rely on PtH2seasonal storage to achieve zero operational CO2 emissions to maximize renewable self-consumption and thermal electrification (sector- coupling). The residential district, typified by the highest electrical peak of all districts, demonstrated higher total system costs. This was mostly due the need for larger storage requirements to assure a zero-emissions energy source in times of low renewable availabil- ity. Further, we demonstrate the importance of mixed district profiles as the most promising case for D-MES planning.
Fig. 7.PtH2system operation across all districts topologies for all MC runs in the emissions objective. Negative (PEMEC) and positive (PEMFC) power demonstrates charging and discharging of the PtH2system. FC electricity and heat are overlayed (not stacked) to show higher contribution of electricity generation.
For district energy system planners, this implicates an increased focus to utilize a diversified balance of energy demand types, leading to reduced system costs and CO2emissions. Nevertheless, batteries are heavily relied on to smooth short-to medium-term (maximum 3 month) renewablefluctuations, while PtH2is used to offset the long-term mismatch between renewable energy and energy demand. The impact of uncertainty proves to be significant, with PtH2 deployment being highly sensitive to the sampled
parameters of competing technologies mainly attributed to the cost, efficiency, or lifetime of competing technologies on the elec- trical (batteries) and thermal (ASHPs) sectors.
Declaration of competing interest
The authors declare that they have no known competing financial interests or personal relationships that could have appeared to influence the work reported in this paper.
Acknowledgments
This research is supported in part by funds from the Swiss Competence Center for Energy Research (SCCER) Future Energy Efficient Buildings and Districts (FEEB&D), and the Swiss National Science Foundation (SNF) under the National Research Program Energy Turnaround (NRP70). The authors would like to thank all members of the SusTec, sus.lab, and IMES project teams who assisted in the development of this work.
References
[1] Jacobson M, Cameron M, Hennessy E, Petkov I, Meyer C, Gambhir T, Maki A, Pfleeger K, Clonts H, McEvoy A, Miccioli M, von Krauland A-K, Fang R, Delucchi M. 100% clean and renewable Wind, Water, and Sunlight (WWS) all- sector energy roadmaps for 53 towns and cities in North America. Sustainable Cities and Society 2018;42:22e47.https://doi.org/10.1016/j.scs.2018.06.031.
[2] Mancarella P. MES (multi-energy systems): an overview of concepts and evaluation models. Energy 2014;65:1e17. https://doi.org/10.1016/
J.ENERGY.2013.10.041.
[3] Mavromatidis G, Orehounig K, Carmeliet J. Uncertainty and global sensitivity analysis for the optimal design of distributed energy systems. Appl Energy 2018;214:219e38.https://doi.org/10.1016/j.apenergy.2018.01.062.
Fig. 8.KS test results for the PEMFC quartile 3 (top) and the PEMEC quartile 2 (bottom) for the commercial district in order of significance. These represent the six most influential parameters for the installation of PtH2in all districts. A significance level ofa¼0.01 is used.
Fig. 9.Relationship from KS tests between ASHP COP to battery self-discharge.
[4] Petkov I, Gabrielli P. Power-to-hydrogen as seasonal energy storage: an un- certainty analysis for optimal design of low-carbon multi-energy systems.
Appl Energy 2020;274:115197. https://doi.org/10.1016/
j.apenergy.2020.115197.
[5] Murray P, Orehounig K, Grosspietsch D, Carmeliet J. A comparison of storage systems in neighborhood decentralized energy system applications from 2015 to 2050. Appl Energy 2018;231:1285e306. https://doi.org/10.1016/
J.APENERGY.2018.08.106.
[6] Murray P, Marquant J, Niffeler M, Mavromatidis G, Orehounig K. Optimal transformation strategies for buildings, neighbourhoods and districts to reach CO2 emission reduction targets. Energy Build 2019;207:109569. https://
doi.org/10.1016/j.enbuild.2019.109569.
[7] Guelpa E, Marincioni L, Deputato S, Capone M, Amelio S, Pochettino E, Verda V.
Demand side management in district heating networks: a real application.
Energy 2019;182:433e42.https://doi.org/10.1016/j.energy.2019.05.131.
[8] Nastasi B, Lo Basso G. Hydrogen to link heat and electricity in the transition towards future Smart Energy Systems. Energy 2016;110:5e22. https://
doi.org/10.1016/j.energy.2016.03.097.
[9] Mehleri ED, Sarimveis H, Markatos NC, Papageorgiou LG. A mathematical programming approach for optimal design of distributed energy systems at the neighbourhood level. Energy 2012;44(1):96e104.https://doi.org/10.1016/
j.energy.2012.02.009.
[10] Müller D, Monti A, Stinner S, Schl€osser T, Schütz T, Matthes P, Wolisz H, Molitor C, Harb H, Streblow R. Demand side management for city districts.
Build Environ 2015;91:283e93. https://doi.org/10.1016/
j.buildenv.2015.03.026.
[11] Mavromatidis G, Orehounig K, Bollinger LA, Hohmann M, Marquant JF, Miglani S, Morvaj B, Murray P, Waibel C, Wang D, Carmeliet J. Ten questions concerning modeling of distributed multi-energy systems. Build Environ 2019;165:106372.https://doi.org/10.1016/j.buildenv.2019.106372.
[12] Keirstead J, Jennings M, Sivakumar A. A review of urban energy system models: approaches, challenges and opportunities. Renew Sustain Energy Rev 2012;16(6):3847e66.https://doi.org/10.1016/j.rser.2012.02.047.
[13] Bracco S, Dentici G, Siri S. Desod : a mathematical programming tool to optimally design a distributed energy system. Energy 2016;100:298e309.
https://doi.org/10.1016/j.energy.2016.01.050.
[14] Orehounig K, Evins R, Dorer V. Integration of decentralized energy systems in neighbourhoods using the energy hub approach. Appl Energy 2015;154:
277e89.https://doi.org/10.1016/j.apenergy.2015.04.114.
[15] Wu R, Mavromatidis G, Orehounig K, Carmeliet J. Multiobjective optimisation of energy systems and building envelope retrofit in a residential community.
Appl Energy 2017;190:634e49. https://doi.org/10.1016/
j.apenergy.2016.12.161.
[16] Wouters C, Fraga ES, James AM. An energy integrated, multi-microgrid, MILP (mixed-integer linear programming) approach for residential distributed energy system planning - a South Australian case-study. Energy 2015;85:
30e44.https://doi.org/10.1016/j.energy.2015.03.051.
[17] Comodi G, Bartolini A, Carducci F, Nagaranjan B, Romagnoli A. Achieving low carbon local energy communities in hot climates by exploiting networks synergies in multi energy systems. Appl Energy 2019;256:113901.https://
doi.org/10.1016/j.apenergy.2019.113901.
[18] Flores RJ, Brouwer J. Optimal design of a distributed energy resource system that economically reduces carbon emissions. Appl Energy 2018;232:119e38.
https://doi.org/10.1016/j.apenergy.2018.09.029.
[19] Ata M, Erenoglu AK, S¸eng€or b, Erdinç O, Tas¸cıkaraoglu A, Catal~ao JP. Optimal operation of a multi-energy system considering renewable energy sources stochasticity and impacts of electric vehicles. Energy 2019;186:115841.
https://doi.org/10.1016/J.ENERGY.2019.07.171.
[20] Murray P, Carmeliet J, Orehounig K. Multi-objective optimisation of power-to- mobility in decentralised multi-energy systems. Energy 2020;205:117792.
https://doi.org/10.1016/j.energy.2020.117792.
[21] McKenna R, Fehrenbach D, Merkel E. The role of seasonal thermal energy storage in increasing renewable heating shares: a techno-economic analysis for a typical residential district. Energy Build 2019;187:38e49. https://
doi.org/10.1016/j.enbuild.2019.01.044.
[22] Nastasi B, Lo Basso G, Astiaso Garcia D, Cumo F, de Santoli L. Power-to-gas leverage effect on power-to-heat application for urban renewable thermal energy systems. Int J Hydrogen Energy 2018;43(52):1e15.https://doi.org/
10.1016/j.ijhydene.2018.08.119.
[23] Giannakoudis G, Papadopoulos AI, Seferlis P, Voutetakis S. Optimum design and operation under uncertainty of power systems using renewable energy sources and hydrogen storage. Int J Hydrogen Energy 2010;35(3):872e91.
https://doi.org/10.1016/j.ijhydene.2009.11.044.
[24] Gabrielli P, Gazzani M, Martelli E, Mazzotti M. Optimal design of multi-energy systems with seasonal storage. Appl Energy 2018;219:408e24. https://
doi.org/10.1016/j.apenergy.2017.07.142.
[25] Kotzur L, Markewitz P, Robinius M, Stolten D. Time series aggregation for energy system design: modeling seasonal storage. Appl Energy 2018;213:
123e35.https://doi.org/10.1016/j.apenergy.2018.01.023.
[26] Karmellos M, Georgiou PN, Mavrotas G. A comparison of methods for the optimal design of Distributed Energy Systems under uncertainty. Energy 2019;178:318e33.https://doi.org/10.1016/j.energy.2019.04.153.
[27] Shams MH, Shahabi M, Kia M, Heidari A, LotfiM, Shafie-khah M, Catal~ao JP.
Optimal operation of electrical and thermal resources in microgrids with energy hubs considering uncertainties. Energy 2019;187:115949. https://
doi.org/10.1016/j.energy.2019.115949.
[28] Wang M, Yu H, Jing R, Liu H, Chen P, Li C. Combined multi-objective opti- mization and robustness analysis framework for building integrated energy system under uncertainty. Energy Convers Manag 2020;208:112589.https://
doi.org/10.1016/j.enconman.2020.112589.
[29] Mavromatidis G, Orehounig K, Carmeliet J. Design of distributed energy sys- tems under uncertainty: a two-stage stochastic programming approach. Appl Energy 2018;222:932e50.https://doi.org/10.1016/j.apenergy.2018.04.019.
[30] Majewski DE, Lampe M, Voll P, Bardow A. TRusT: a Two-stage Robustness Trade-off approach for the design of decentralized energy supply systems.
Energy 2017;118:590e9.https://doi.org/10.1016/j.energy.2016.10.065.
[31] Gabrielli P, Fürer F, Mavromatidis G, Mazzotti M. Robust and optimal design of multi-energy systems with seasonal storage through uncertainty analysis.
Appl Energy 2019;238:1192e210. https://doi.org/10.1016/
j.apenergy.2019.01.064.
[32] Mavromatidis G, Orehounig K, Carmeliet J. Comparison of alternative decision-making criteria in a two-stage stochastic program for the design of distributed energy systems under uncertainty. Energy 2018;156:709e24.
https://doi.org/10.1016/j.energy.2018.05.081.
[33] Peel MC, Finlayson BL, McMahon TA. Updated world map of the K€oppen- Geiger climate classification. Hydrol Earth Syst Sci 2007;11:1633e44.https://
doi.org/10.5194/hess-11-1633-2007.
[34] Mavrotas G. Effective implementation of theε-constraint method in multi- objective mathematical programming problems. Appl Math Comput 2009;213(2):455e65.https://doi.org/10.1016/J.AMC.2009.03.037.
[35] Ferrari S, Zagarella F, Caputo P, D’Amico A. Results of a literature review on methods for estimating buildings energy demand at district level. Energy 2019;175:1130e7.https://doi.org/10.1016/j.energy.2019.03.172.
[36] NREL, U.S. Tech. rep.. In: Department of energy commercial reference building models of the national building stock. U.S. Department of Energy - National Renewable Energy Laboratory; 2011. https://digitalscholarship.unlv.edu/
renew_pubs/44/.
[37] U.S. Department of Energy. Commercial and residential hourly load profiles for all TMY3 locations in the United States. 2014.