arXiv:hep-ex/0101027v3 29 Jan 2001
EUROPEAN ORGANIZATION FOR NUCLEAR RESEARCH
CERN-EP-2000-153 December 19, 2000
Combination procedure for the precise determination of Z boson parameters from
results of the LEP experiments
The Lep Collaborations Aleph, Delphi, L3 and Opal1) and the Line Shape Sub-group of the Lep Electroweak Working Group2)
Abstract
The precise determination of the Z boson parameters from the measure- ments at the Z resonance by the four collaborations Aleph, Delphi, L3 and Opalin e+e− collisions at the large electron positron colliderLep at CERN is a landmark for precision tests of the electroweak theory. The four experiments measured quantities which were used to extract the mass and width of the Z boson, the hadronic cross-section at the pole of the resonance, the ratio of hadronic and leptonic decay widths, and the leptonic forward-backward asym- metries at the pole. The combination procedure based on these parameters is presented in this paper.
(to be published as part of a review in Physics Reports)
1)The full list of authors may be found in References 1–4
2) The members of the line shape group are: G. Duckeck, M. Gr¨unewald, T. Kawamoto, R. Kellogg, G. Martinez, J. Mnich, A. Olshevski, B. Pietrzyk, G. Quast, P. Renton, E. Tournefier
1 Introduction
Between the years 1989 and 1995 the e+e− collider Lep at CERN provided interactions at centre-of-mass energies, √
s, ranging from 88 to 95 GeV, i. e. around the mass of the Z boson (LepI phase). An important aspect of physics at Lep concerns the analysis of fermion-pair production in e+e− collisions [5]. The four Lep experiments Aleph [6], Delphi [7], L3 [8] and Opal [9] analysed, in particular, hadron (quark-pair) production and the pair production of charged leptons, ℓ= e, µ, τ.
At various centre-of-mass energies, total cross-sections are measured for all processes, while forward-backward asymmetries are measured in lepton-pair production. These mea- surements (“realistic observables”) allow the determination of various properties of the Z boson such as its mass, total and partial decay widths, and coupling constants to fermions (“pseudo-observables”). For the extraction of the pseudo-observables, the experiments per- form model-independent fits to their measured realistic observables [1–4].
To obtain the best possible precision the results of the four Lep experiments have to be averaged. This paper describes the combination procedure adopted by the Lep electroweak working group. Performing an average over the realistic observables constitutes an extremely complicated task, as it involves hundreds of measurements, each with specific phase space definitions and experimental errors which are correlated among different centre- of-mass energies and data taking periods and also among theLepexperiments. Therefore, the combination of the experimental results is performed on the basis of the four sets of pseudo-observables. As will be shown here, this is possible without significant loss of precision.
Additional fits to the experimental data, usually not contained in the individual publi- cations quoted above, were provided by the experiments and are documented in this paper.
A large effort is devoted to the treatment of systematic errors and their correlation among the experiments, such that the combination procedure yields an optimal estimator for the averages.
This paper is organised as follows: Section 2 summarises the information about the Lep I running relevant for this paper. Section 3 presents a brief introduction to the pseu- do-observables used to parametrise the realistic observables around the Z resonance. The individual experimental results are presented in Section 4. Sources of correlated systematic errors between experiments and their effects on the pseudo-observables are discussed in Section 5. In Section 6, studies of various methods for combining the results are presented.
The resulting pseudo-observables are then considered in the framework of a specific model, the minimal Standard Model (SM), and are compared with direct SM fits to the realistic observables. The conclusions are summarised in Section 7.
2 Z resonance scans at LEP I
Running of Lep in the years from 1989 to 1995 was dedicated to precision studies of the Z boson parameters. Electron-positron collisions were provided at several well-determined
centre-of-mass energies around the Z resonance, with steadily improving performance.
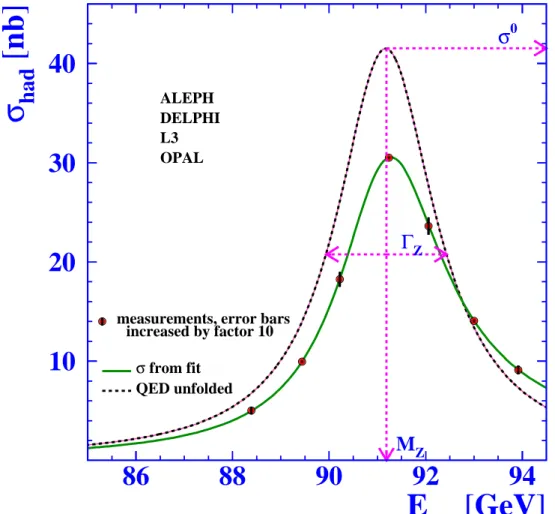
The set of measurements collected by the experiments consists of the hadronic and lep- tonic cross-sections and the leptonic forward-backward asymmetries around seven points in centre-of-mass energy, over six years of running at LepI. In addition, changes of experi- mental conditions, such as the inclusion of new detector components, made it necessary to subdivide the data samples even further. The fullLep I data set consists of about 4×200 individual cross-section and asymmetry measurements. From these each experiment has extracted a set of parameters describing the cross-section around the Z resonance, which include the mass, mZ, and width, ΓZ, of the Z and the total pole cross-section for qq pro- duction, σh0. These parameters are discussed in detail in Section 3 . QED corrections from initial-state photon radiation are large around the Z resonance due to the rapid variation of the cross-sections with centre-of-mass energy. For illustration, Figure 1 shows the average over the hadronic cross-section measurements by the four experiments, together with the fitted line shape curve before and after unfolding photon radiation. The cross-section is dominated by on-shell Z production, although photon exchange and γ-Z interference con- tributions are not negligible. The measurements are sensitive to higher-order electroweak corrections. These modify the tree-level couplings of the Z to fermions, and are quantified in terms of electroweak form factors.
Much effort was dedicated to the determination of the energy of the colliding beams, which reached a precision of about 20×10−6 on the absolute energy scale. This level of ac- curacy is vital for the measurements of the mass and width of the Z. All the experiments replaced their first-generation luminosity detectors, which had systematic uncertainties around the percent level, by high-precision devices capable of pushing systematic errors on the acceptance of small-angle Bhabha scattering events below one per-mil. As a conse- quence of improvements of the accelerator and of the experiments during Lep I running, statistical and systematic errors are much smaller for the last three years of data taking, which hence dominate the precision achieved on the Z parameters.
2.1 Event selection and statistics
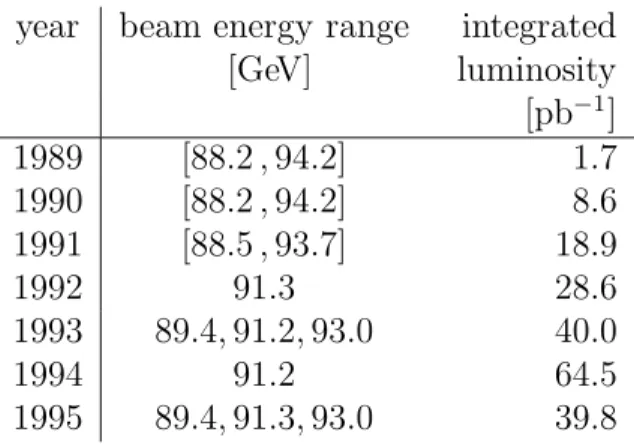
During the summer of 1989 the first Z bosons were produced at Lep and observed by the four experiments. Since then the operation of the machine and its performance were steadily improved. At the end of data taking around the Z resonance in autumn 1995 the peak luminosity had reached nearly twice its design value. Table 1 summarises the data taking periods, the approximate centre-of-mass energies and the integrated luminosities delivered.
The data collected in 1989 constitute only a very small subset of the total statistics and are of lower quality, and therefore are not used here. In the years 1990 and 1991 “energy scans” were performed at seven different centre-of-mass energies around the peak of the Z resonance, placed about one GeV apart. In 1992 and 1994 there were high-statistics runs at the peak energy only. In 1993 and 1995 data taking took place at three energy points, about 1.8 GeV below and above the peak and at the peak. In particular the off-peak energies were carefully calibrated employing the technique of resonant depolarisation of the
E cm [ GeV ] σ had [ nb ]
σ from fit QED unfolded
measurements, error bars increased by factor 10
ALEPH DELPHI L3 OPAL
σ0
ΓZ
MZ
10 20 30 40
86 88 90 92 94
Figure 1: Average over measurements of the hadronic cross-sections by the four exper- iments, as a function of centre-of-mass energy. The dashed curve shows the QED de- convoluted cross-section, which defines the Z parameters described in the text.
transversely polarised beams [10–13].
The accumulated event statistics amount to about 17 million Z decays recorded by the four experiments. A detailed breakdown is given in Table 2.
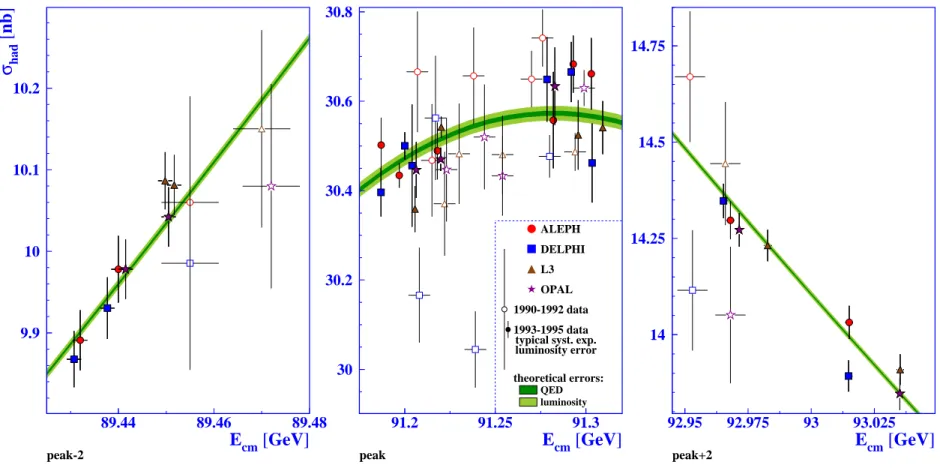
As an example, the measurements of the hadronic cross-section at the three principal energy points are shown in Figure 2. Because the hadron statistics are almost ten times larger than the lepton statistics, these measurements dominate the determination of the mass and the width of the Z. Detailed descriptions of the individual experimental anal- yses can be found in [1–4]. They all rely on excellent separation of the final states, qq, e+e−,µ+µ− and τ+τ−, accompanied by high selection efficiencies. The total cross-section, σtot, is determined from the number of selected events in a final state, N, the number of background events, Nbg, the selection efficiency, ǫ, and the integrated luminosity, L, as σtot = (N −Nbg)/(ǫL).
peak-2
9.9 10 10.1 10.2
89.44 89.46 89.48
Ecm[GeV] σ had[nb]
ALEPH DELPHI L3 OPAL 1990-1992 data 1993-1995 data typical syst. exp.
luminosity error theoretical errors:
QED luminosity
peak
30 30.2 30.4 30.6 30.8
91.2 91.25 91.3
Ecm[GeV]
peak+2
14 14.25 14.5 14.75
92.95 92.975 93 93.025
Ecm[GeV]
Figure 2: Measurements by the four experiments of the hadronic cross-sections around the three principal energies. The vertical error bars show the statistical errors only. The open symbols represent the early measurements with typically much larger systematic errors than the later ones, shown as full symbols. Typical experimental systematic errors on the determination of the luminosity are indicated in the legend; these are almost fully correlated within each experiment, but uncorrelated among the experiments. The horizontal error bars show the uncertainties in Lep centre-of-mass energy, where the errors for the period 1993–1995 are smaller than the symbol size in some cases. The bands represent the result of the model-independent fit to all data, including the two most important common theoretical errors from initial-state photon radiation and from the calculations of the small-angle Bhabha cross-section.
5
year beam energy range integrated [GeV] luminosity [pb−1]
1989 [88.2 , 94.2] 1.7
1990 [88.2 , 94.2] 8.6
1991 [88.5 , 93.7] 18.9
1992 91.3 28.6
1993 89.4, 91.2, 93.0 40.0
1994 91.2 64.5
1995 89.4, 91.3, 93.0 39.8
Table 1: Approximate centre-of-mass energies and integrated luminosities delivered by Lep, per experiment. In 1990 and 1991, a total of about 7 pb−1 was taken at off-peak energies, and 20 pb−1 per year in 1993 and in 1995. The total luminosity used by the experiments in the analyses was smaller by 10-15 % due to data taking inefficiencies.
year A D L O all
’90/91 433 357 416 454 1660
’92 633 697 678 733 2741
’93 630 682 646 649 2607
’94 1640 1310 1359 1601 5910
’95 735 659 526 659 2579
total 4071 3705 3625 4096 15497
ℓ+ℓ−
year A D L O all
’90/91 53 36 39 58 186
’92 77 70 59 88 294
’93 78 75 64 79 296
’94 202 137 127 191 657
’95 90 66 54 81 291
total 500 384 343 497 1724
Table 2: The qq and ℓ+ℓ− event statistics, in units of 103, used for the analysis of the Z line shape and lepton forward-backward asymmetries by the experiments Aleph (A), Delphi (D), L3 (L) and Opal (O).
The luminosity of the beams is determined by normalisation to the theoretical cross- section for the process of small-angle Bhabha scattering, which is dominated by photon exchange in the t channel. Thus, the integrated luminosity is given by the number of observed small-angle Bhabha events and the calculated cross-section for this process within a given experimental acceptance. This requires the detection of back-to-back electrons and positrons close to the beam direction. Their positions and energies are precisely measured by forward calorimeters placed at small angles with respect to the beam line (typically 30 mrad< θ <50 mrad). The main experimental systematic error arises from the definition of the geometrical acceptance for this process. Since the angular distribution is steeply falling with increasing scattering angle (∝θ−3), the precise definition of the inner radius of the acceptance region is most critical.
The forward-backward asymmetry,Afb, is defined by the numbers of events in which the
final state lepton goes forward or backward with respect to the direction of the incoming electron,NfandNb, respectively: Afb= (Nf−Nb)/(Nf+Nb).In practice,Afbis determined from a fit to the differential cross-section of the formdσ/dcosθ∝1 + cos2θ+ 8/3Afbcosθ, whereθis the angle between the direction of the final state fermion and that of the incoming electron. This procedure makes better use of the available information and hence leads to slightly smaller statistical errors. The electron final state is special due to t-channel diagrams, as is discussed in more detail in Section 5.2. The forward-backward asymmetries do not require any normalisation, but rely on precise measurements of the production angles of the final state fermions. Forward-backward asymmetries in qq final states are not considered here, because these require either dedicated techniques for the tagging of quark flavours or a special method to extract the inclusive quark forward-backward asymmetry from the natural mixture of quark flavours in hadronic events.
In general, the systematic errors arising from the selection procedures are small and so the accumulated statistics can be fully exploited. Furthermore, the purely experimental errors arising from the limited understanding of detector acceptances are uncorrelated among the experiments. Errors arising from limitations in theoretical precision, such as the calculation of the small-angle Bhabha cross-section, thet-channel contribution in the e+e− final state or pure QED corrections to the cross-section, are common to all experiments.
They are discussed in detail in Section 5.
An overview of the experimental systematic errors is given in Table 3. The systematic error on the luminosity is common to cross-section measurements of all final states, but does not affect the measurements of Afb.
2.2 Energy calibration
Precise knowledge of the centre-of-mass energy is essential for the determination of the mass and width of the Z resonance. The key features of the energy calibration procedure were the technique of resonant depolarisation and the careful monitoring of all relevant machine parameters [13]. The latter is important because beam energy calibrations with resonant depolarisation were possible only outside normal data taking, usually at the end of data taking in a particular fill of the accelerator, with fills typically lasting approxi- mately 10 h. About 40% of the recorded off-peak luminosity was calibrated in this way in the 1993 scan and about 70% in the 1995 scan. For each experiment a value of the beam energy was provided every 15 minutes. These values were evaluated from the time evolutions of the relevant machine parameters. This required a model which took into account the fields in the Lep dipoles and in the corrector magnets, beam orbit positions, collision offsets at the interaction points and parameters of the radio-frequency system. In addition, environmental effects from leakage currents produced by trains in the Geneva area and the gravitational forces of the Moon and the Sun leading to small deformations of the accelerator geometry had to be considered. Errors on the centre-of-mass energy are largely dominated by the uncertainties in this model. The energy errors vary slightly among the interaction points, largely due to different configurations of the radio frequency cavities. The energy errors for different experiments and periods of data taking have large
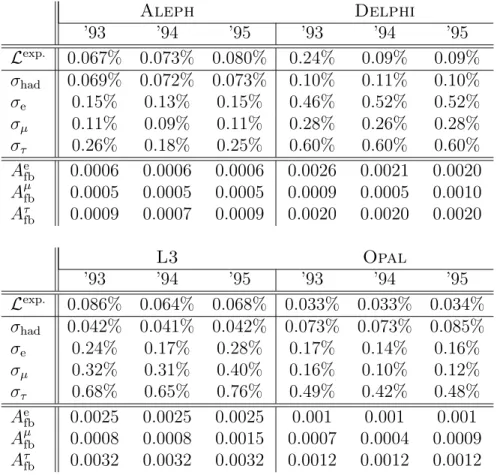
Aleph Delphi
’93 ’94 ’95 ’93 ’94 ’95
Lexp. 0.067% 0.073% 0.080% 0.24% 0.09% 0.09%
σhad 0.069% 0.072% 0.073% 0.10% 0.11% 0.10%
σe 0.15% 0.13% 0.15% 0.46% 0.52% 0.52%
σµ 0.11% 0.09% 0.11% 0.28% 0.26% 0.28%
στ 0.26% 0.18% 0.25% 0.60% 0.60% 0.60%
Aefb 0.0006 0.0006 0.0006 0.0026 0.0021 0.0020 Aµfb 0.0005 0.0005 0.0005 0.0009 0.0005 0.0010 Aτfb 0.0009 0.0007 0.0009 0.0020 0.0020 0.0020
L3 Opal
’93 ’94 ’95 ’93 ’94 ’95
Lexp. 0.086% 0.064% 0.068% 0.033% 0.033% 0.034%
σhad 0.042% 0.041% 0.042% 0.073% 0.073% 0.085%
σe 0.24% 0.17% 0.28% 0.17% 0.14% 0.16%
σµ 0.32% 0.31% 0.40% 0.16% 0.10% 0.12%
στ 0.68% 0.65% 0.76% 0.49% 0.42% 0.48%
Aefb 0.0025 0.0025 0.0025 0.001 0.001 0.001 Aµfb 0.0008 0.0008 0.0015 0.0007 0.0004 0.0009 Aτfb 0.0032 0.0032 0.0032 0.0012 0.0012 0.0012
Table 3: Experimental systematic errors for the analysis of the Z line shape and lepton forward-backward asymmetries at the Z peak. None of the common errors discussed in Section 5 are included here.
common parts, and therefore the use of a full correlation matrix is necessary. Assuming that all experiments contribute with the same weight allows all the Lep energy errors to be conveniently summarised in a single error matrix, common to all interaction points, as given in Table 4.
The energy of individual beam particles is usually not at the mean value considered above, but oscillates around the mean beam energy. Therefore observables are not mea- sured at a sharp energy,Ecm0 , but instead their values are averaged over a range in energies Ecm0 ±δEcm. With the assumption of a Gaussian shape of the energy distribution, the total cross-sections receive a correction proportional to δEcm2 and the second derivative of σ(Ecm) w.r.t. Ecm. AtLepI, typical values of the centre-of-mass energy spread are around 50 MeV. The effects of the correction lead to an increase of the cross-section at the peak of the Z resonance by 0.16% and a decrease of the width by about 5 MeV. The uncertainties on the energy spread, around±1 MeV in 1993–1995, constitute a negligible source of error common to all experiments.
In addition to the natural energy spread, changes in the mean beam energy due to
‘93 ‘93 ‘93 ‘94 ‘95 ‘95 ‘95
p-2 p p+2 p p-2 p p+2
‘93 p-2 3.42
‘93 p 2.76 6.69
‘93 p+2 2.59 2.64 2.95
‘94 p 2.25 2.38 2.16 3.62
‘95 p-2 1.29 1.14 1.23 1.23 1.78
‘95 p 1.19 1.20 1.25 1.30 1.24 5.39
‘95 p+2 1.20 1.15 1.33 1.24 1.22 1.34 1.68
Table 4: Signed square root of covariance matrix elements,(VE), inMeV, from the deter- mination of the centre-of-mass energies for the scan points in 1993–1995 [13]. Elements above the diagonal are left blank for simplicity. The errors for the earlier years may be found in References 10, 11.
changes of machine parameters have a similar effect. Periods of data taking with a very similar centre-of-mass energy were combined into a single energy point in the experimental analyses by performing a luminosity-weighted average. The additional energy spread re- sulting from this was only around 10 MeV, which adds in quadrature to the natural energy spread of the accelerator.
3 Parametrisation of the differential cross-section
The differential cross-section for fermion pair production around the Z resonance consists of three s-channel contributions: from Z exchange, photon exchange and from the interference between photon and Z diagrams, σ(s) =σz+σγ+σint. This can be cast into a Born-type structure with complex-valued, s-dependent form factors describing the couplings of the Z and the photon to fermions. In the Z pole approximation, valid for s ≃ m2Z, these are taken to be constants. Neglecting initial and final state photon radiation, final state gluon radiation and fermion masses, the electroweak kernel cross-section can thus be written as
2s π
1 Ncf
dσew
dcosθ(e+e− →ff) =
α(mZ)Qf2(1 + cos2θ)
| {z }
γ
−8 Renα∗(mZ)Qfχ(s)hGVeGVf (1 + cos2θ) + 2GAeGAf cosθio
| {z }
γ−Z interference
+16|χ(s)|2h(|GVe|2+|GAe|2)(|GVf |2+|GAf |2)(1 + cos2θ) +8 Re{GVeGAe
∗}RenGVf GAf
∗o
cosθi
| {z }
Z
with
χ(s) = GFm2Z 8π√
2
s
s−m2Z+ isΓZ/mZ
.
Hereα(mZ) is the electromagnetic coupling constant at the scale of the Z mass, GF is the Fermi constant, Qf is the charge of the final state fermion, and the colour factor Ncf is one for leptons (f=e,µ,τ) and three for quarks (f=u, d, s, c, b). The effective vector and axial vector couplings of fermions to the Z are denoted by GVf and GAf . χ(s) is the propagator term characterized by a Breit-Wigner denominator with an s-dependent width.
In Bhabha final states, e+e− → e+e−, the t-channel diagrams also contribute to the cross-sections, with a dominant contribution at large cosθ, i. e. in the forward direction.
This contribution, as well as its interference with thes-channel, add to the pures-channel cross-section for e+e−→e+e−.
The 1 + cos2θ terms in the above formula contribute to the total cross-section, whereas the terms multiplying cosθcontribute only to the forward-backward asymmetries for an ex- perimental acceptance symmetric in cosθ. The total cross-section is completely dominated by Z exchange. The γ−Z interference determines the energy dependence of the forward- backward asymmetries and dominates at off-peak energies, but the leading contribution from the real parts of the couplings vanishes at √
s=mZ.
The inclusion of higher-order electroweak corrections is absorbed in GA and GV with small imaginary parts arising from electroweak form factors. The experimental measure- ments do not allow a simultaneous extraction of the real and imaginary parts, and therefore the effective couplings to be determined are defined as gA = Re(GA) and gV = Re(GV).
The imaginary parts of GA and GV are explicitly accounted for in the fitting codes by setting them to their SM expectations. The effects of box diagrams are also taken into account at this level.
It is worth noting that the definitions of the mass and width with ans-dependent width term in the Breit-Wigner denominator are suggested by phase-space and the structure of the electroweak radiative corrections within the SM. They differ from other commonly used definitions, e. g. the real part of the pole position in the energy-squared plane, where the propagator term takes the functional form χ(s) ∝ s/(s−mZ2 +imZΓZ) . This gives an identical line shape if mZ and ΓZ are related to mZ and ΓZ by the multiplicative factor 1/q1 + Γ2Z/m2Z.
Photon radiation from the initial and final states, and their interference, is conveniently treated by convoluting the electroweak kernel cross-section, σew(s), with a QED radiator, HQEDtot ,
σ(s) =
Z 1
4m2f dz HQEDtot (z, s)σew(zs).
The difference between the forward and backward cross-sections entering into the determi- nation of the forward-backward asymmetries, σF−σB, is treated in the same way using a radiator function HQEDFB .
At the peak the QED de-convoluted total cross-section is 36 % larger than the measured one, and the peak position is shifted downwards by about 100 MeV. The estimated precision
of this important correction is discussed in Section 5.4.1.
The partial Z decay widths are defined inclusively, i. e. they contain QED and QCD final state corrections and the contribution from the imaginary parts of the effective couplings,
Γff =Ncf GFm3Z 6√
2π
|GAf|2RfA + |GVf |2RfV + ∆ew/QCD.
The radiator factorsRfV andRfAtake into account final state QED and QCD corrections as well as non-zero fermion masses; ∆ew/QCD accounts for non-factorizable electroweak/QCD corrections. The inclusion of the imaginary parts of the couplings in the definition of the leptonic width, Γℓℓ, leads to changes of 0.15 per-mil corresponding to only 15 % of the Lep-combined experimental error on Γℓℓ.
The total cross-section arising from the cosθ-symmetric Z production term can also be written in terms of the partial decay widths into the initial and final states, Γee and Γff,
σffz = σffpeak sΓ2Z
(s−m2Z)2+s2Γ2Z/m2Z, with σpeakff = 1
1 +δQED
σ0ff and σ0ff = 12π m2Z
ΓeeΓff Γ2Z .
The term 1/(1 +δQED) removes the final state QED correction included in the definition of Γee.
No distinction of the flavours of produced quarks is made, and therefore the overall hadronic cross-section is measured, and is parameterised in terms of the hadronic width given by the sum over all quark final states,
Γhad = X
q,q6=t
Γqq.
The decays of the Z to neutrinos are invisible in the detectors and give rise to the
“invisible width”, Γinv = NνΓνν, where Nν is the number of light neutrino species. The invisible width can be determined from the measurements of the decay widths to all visible final states and the total width, which is given by the sum over all partial widths,
ΓZ = Γee+ Γµµ+ Γτ τ + Γhad+ Γinv.
Because the measured cross-sections depend on products of the partial widths and also on the total width, the widths constitute a highly correlated parameter set. In order to reduce correlations among the fit parameters an experimentally-motivated set of six parameters is used to describe the total hadronic and leptonic cross-sections around the Z peak. These are
• the mass of the Z, mZ, and the total width, ΓZ;
• the “hadronic pole cross-section”,
σh0 ≡ 12π m2Z
ΓeeΓhad
Γ2Z ;
• the ratios
Re≡Γhad/Γee, Rµ ≡Γhad/Γµµ and Rτ ≡Γhad/Γτ τ.
The leading contribution fromγ-Z interference is proportional to the product of the vector couplings of the initial and final states and vanishes at √
s =mZ, but becomes noticeable at off-peak energies and therefore affects the Z mass. Because a determination of all quark couplings is not possible, the γ-Z interference term in the hadronic final state is fixed to its SM value. The implications of this are discussed in Section 6.4.
Three additional parameters are needed to describe the leptonic forward-backward asymmetries for the processes e+e− → e+e−, e+e− → µ+µ− and e+e− → τ+τ−. These are
• the “pole asymmetries”, A0,eFB, A0, µFB and A0, τFB.
Contrary to the partial widths, the pole asymmetries are defined purely in terms of the real parts of the effective Z couplings,
A0,FBf ≡ 3
4AeAf with Af = 2gfV/gfA 1 + gVf / gAf2
.
Due to the smallness of the leptonic forward-backward asymmetry at √
s = mZ, QED corrections are as large as A0, ℓFB itself. The product of the axial vector couplings of the initial and final states determines the leading contribution of the γ-Z interference. This can be fixed with sufficient precision together with the vector couplings from simultaneous fits to the measured forward-backward asymmetries and cross-sections, requiring SM input only for the imaginary parts of the couplings.
Differences between the pseudo-observables and the QED de-convoluted observables at
√s = mZ, arising from the interference between photon and Z diagrams and from the interplay between the real and imaginary parts of the photon and Z couplings, are small in the SM. σpeakff , given in terms of the partial decay widths, agrees to better than 0.5 per- mil for both hadrons and leptons with the QED de-convoluted cross-sections without the photon exchange contribution at √
s = mZ. This is only a small fraction of the Lep- combined experimental error. The difference between A0, ℓFB and the QED de-convoluted forward-backward asymmetry at the peak amounts to 0.0013, which is slightly larger than the Lep-combined error on A0, ℓFB. It is therefore important to treat the imaginary parts correctly, however, the measurements are not sensitive to variations of the imaginary parts within their SM expectation.
The pseudo-observables introduced above cannot be considered as truly model-indepen- dent, because imaginary parts of the couplings as well as theγ-Z interference in the hadronic
final state need to be fixed to their SM values. This leads to small “Standard Model rem- nants” in any attempted “model-independent” definition of the pseudo-observables. More details about the treatment of imaginary parts and SM remnants in the theory programs TOPAZ0 [14] and ZFITTER [15] are given in Reference 16. These computer codes make available the best current knowledge of QED and electroweak corrections within the min- imal Standard Model and also provide a (quasi) model-independent approach based on the parametrisation of the cross-sections and forward-backward asymmetries, as described above.
4 Experimental results
The experimental results presented here have been slightly modified from those published by the experiments [1–4] in order to facilitate the combination procedure. The four dedi- cated sets of experimental results for the combination are summarised in Table 5.
All fits are based on versions 6.23 of ZFITTER and 4.4 of TOPAZ0. The published Aleph results were derived using version 6.10 of ZFITTER, which did not yet contain the improved treatment of fermion pairs radiated from the initial state [17]. For the combination presented here, the ALEPH measurements were reanalysed using version 6.23 of ZFITTER.
Each experiment used the combined energy error matrix described above (Table 4).
This makes a small difference at the level of 0.1 MeV on mZ and ΓZ and their errors only for L3, where uncertainties arising from the modelling of the radio frequency cavities are largest.
In the Bhabha final state, the s-t interference has a small dependence on the value of the Z mass. Although practically negligible for a single experiment, a consistent treatment becomes important for the combination. Despite some different choices in the publications of the individual analyses, all experiments evaluate the t,s-t channel correction at their own value of the Z mass for the results presented here. The resulting interdependencies between the Z mass and the parameters from the Bhabha final state are explicitely included in the error correlation coefficients between mZ and Re or A0,FBe.
The Lep experiments agreed to use a standard set of parameters for the calculation of the Standard Model remnants in the theory programs. The important parameters are the Z mass,mZ = 91.187 GeV, the Fermi constant,GF = (1.16637±0.00001)×10−5GeV−2[18], the electromagnetic coupling constant,α(5)(mZ) = 1/128.877±0.0903)[19], the strong cou- pling constant, αs(mZ) = 0.119±0.002 [20], the top quark mass,mt = 174.3±5.1 GeV [21], and finally the Higgs mass,mH, which was fixed to 150 GeV. The dependence of the fit re- sults arising from the uncertainties in these parameters is almost negligible, as is discussed in Section 5.4.3.
3) α(5)(mZ) is the electromagnetic coupling constant at the scale of the Z mass for five quark flavours;
the value and error given correspond to a correction due to hadronic vacuum polarisation of ∆α(5)had = 0.02804±0.00065.
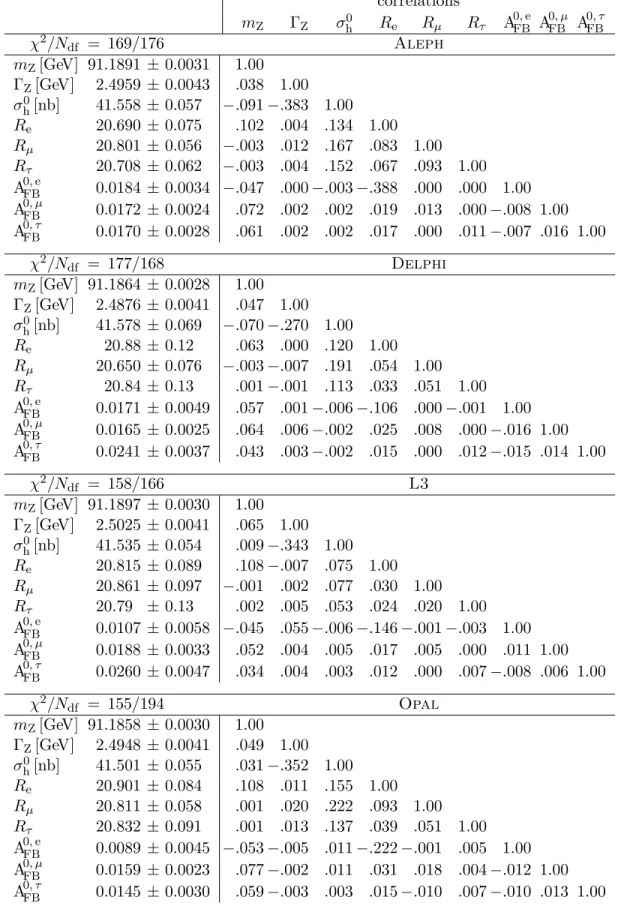
correlations
mZ ΓZ σh0 Re Rµ Rτ A0,FBe A0, µFB A0, τFB
χ2/Ndf = 169/176 Aleph
mZ[GeV] 91.1891 ±0.0031 1.00 ΓZ[GeV] 2.4959 ±0.0043 .038 1.00 σh0[nb] 41.558 ±0.057 −.091−.383 1.00 Re 20.690 ±0.075 .102 .004 .134 1.00 Rµ 20.801 ±0.056 −.003 .012 .167 .083 1.00 Rτ 20.708 ±0.062 −.003 .004 .152 .067 .093 1.00 A0,eFB 0.0184 ±0.0034 −.047 .000−.003−.388 .000 .000 1.00 A0, µFB 0.0172 ±0.0024 .072 .002 .002 .019 .013 .000−.008 1.00 A0, τFB 0.0170 ±0.0028 .061 .002 .002 .017 .000 .011−.007 .016 1.00
χ2/Ndf = 177/168 Delphi
mZ[GeV] 91.1864 ±0.0028 1.00 ΓZ[GeV] 2.4876 ±0.0041 .047 1.00 σh0[nb] 41.578 ±0.069 −.070−.270 1.00 Re 20.88±0.12 .063 .000 .120 1.00 Rµ 20.650 ±0.076 −.003−.007 .191 .054 1.00 Rτ 20.84±0.13 .001−.001 .113 .033 .051 1.00 A0,eFB 0.0171 ±0.0049 .057 .001−.006−.106 .000−.001 1.00 A0, µFB 0.0165 ±0.0025 .064 .006−.002 .025 .008 .000−.016 1.00 A0, τFB 0.0241 ±0.0037 .043 .003−.002 .015 .000 .012−.015 .014 1.00
χ2/Ndf = 158/166 L3
mZ[GeV] 91.1897 ±0.0030 1.00 ΓZ[GeV] 2.5025 ±0.0041 .065 1.00 σh0[nb] 41.535 ±0.054 .009−.343 1.00 Re 20.815 ±0.089 .108−.007 .075 1.00 Rµ 20.861 ±0.097 −.001 .002 .077 .030 1.00 Rτ 20.79 ±0.13 .002 .005 .053 .024 .020 1.00 A0,eFB 0.0107 ±0.0058 −.045 .055−.006−.146−.001−.003 1.00 A0, µFB 0.0188 ±0.0033 .052 .004 .005 .017 .005 .000 .011 1.00 A0, τFB 0.0260 ±0.0047 .034 .004 .003 .012 .000 .007−.008 .006 1.00
χ2/Ndf = 155/194 Opal
mZ[GeV] 91.1858 ±0.0030 1.00 ΓZ[GeV] 2.4948 ±0.0041 .049 1.00 σh0[nb] 41.501 ±0.055 .031−.352 1.00 Re 20.901 ±0.084 .108 .011 .155 1.00 Rµ 20.811 ±0.058 .001 .020 .222 .093 1.00 Rτ 20.832 ±0.091 .001 .013 .137 .039 .051 1.00 A0,eFB 0.0089 ±0.0045 −.053−.005 .011−.222−.001 .005 1.00 A0, µFB 0.0159 ±0.0023 .077−.002 .011 .031 .018 .004−.012 1.00 A0, τFB 0.0145 ±0.0030 .059−.003 .003 .015−.010 .007−.010 .013 1.00
Table 5: Results on Z parameters and their correlation coefficients.
5 Common uncertainties
Important common errors among the results from all Lep experiments arise from several sources. These are the calibration of the beam energy, the theoretical error on the cal- culation of the small-angle Bhabha cross-section used as the normalisation reaction for all cross-section measurements, the theoretical uncertainties in the t-channel and s-t in- terference contribution to the differential large-angle Bhabha cross-section, the theoretical uncertainties in the calculations of QED radiative effects and, finally, from small uncertain- ties in the parametrisation of the electroweak cross-section near the Z resonance in terms of the set of pseudo-observables the four collaborations agreed upon. These common errors are quantified in the following sub-sections and are used in the combination.
Other sources of common errors may arise from the use of common Monte Carlo gener- ators and detector simulation programs. However, each group uses its own tuning proce- dures and event selections which best suit their detector, and therefore the related errors are treated as uncorrelated among the experiments.
5.1 Common energy uncertainties
For the purpose of combining the experimental results at the parameter level, the errors on the centre-of-mass energy of each individual cross-section or asymmetry measurement, as given in Table 4, need to be transformed into errors on the extracted pseudo-observables.
The first step is to scale the energy errors by factors of 1±ǫ, while maintaining the exper- imental errors fixed. Typical values of ǫ used are between 5 % and 20 %. Performing the standard fits with these scaled errors generates two pseudo-observable covariance matrices, V±, from which the covariance matrix due to energy errors, VE, can be separated from the other errors, Vexp, using the relation (V±) = (1±ǫ)2(VE) + (Vexp). The validity of this pro- cedure was verified using a data set restricted to the hadronic cross-section measurements of the years 1993–1995, which were combined both at the cross-section level and at the parameter level.
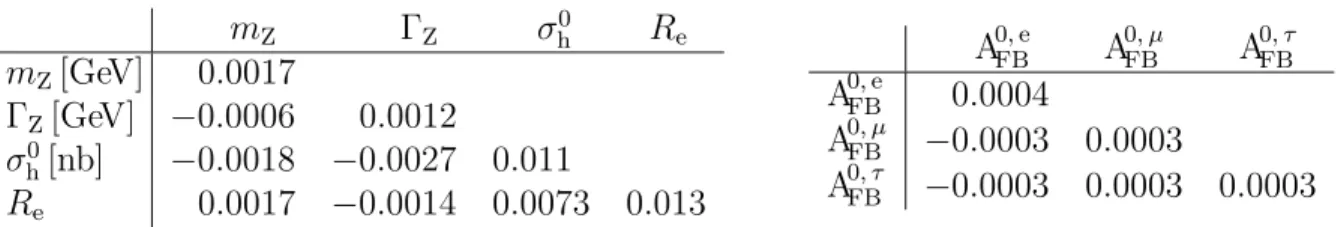
Table 15 and 16 in the appendix show the energy errors on the pseudo-observables extracted from the individual experimental data sets. The estimated energy errors differ slightly depending on which experimental data set is used to derive them. Combinations may be attempted based on each of them, or on the average. The central values and errors of each of the averaged parameters agree well to within 5 % of the error on that average. It is therefore most appropriate to take the average of the error estimates over the experiments as the common energy errors, which are shown in Table 6.
5.2 Common t-channel uncertainties
The t-channel and s-t interference contributions are calculated in the Standard Model using the program ALIBABA [22]. The s-t interference contribution to the t-channel correction in Bhabha final states depends on the value of the Z mass. For the purpose of this combination, all experiments parametrise the t and s-t contributions as a function of
![Table 4: Signed square root of covariance matrix elements, ( V E ), in MeV, from the deter- deter-mination of the centre-of-mass energies for the scan points in 1993–1995 [13]](https://thumb-eu.123doks.com/thumbv2/1library_info/3995208.1540006/9.918.243.664.161.354/table-signed-square-covariance-matrix-elements-mination-energies.webp)