NGC 4254 { a case study
C . HAPTER V
Basedon: \Probingfordarkmatterinspiralgalaxydisks"
Kranz,Slyz&Rix2001,ApJ,562,164
We 1
selected NGC4254 (Messier99) asthe rst galaxy from our sample to be analyzed,
because it shows a clear spiral structure with high arm-inter-arm contrast. NGC4254
is a bright Sc I galaxy located in the Virgo galaxy cluster with a recession velocity of
2453kms 1
adopted from the SIMBAD database. We assume a distance of 20Mpc to-
wards NGC4254, taken from the literature (Sandage & Tammann 1976; Pierce & Tully
1988;Federspiel,Tammann&Sandage1998). Ithasatotal bluemagnitudeofB
T
=10:2
and a diameter of 5.4 4.7 arcmin on the sky. At 20Mpc one arc second is 97 parsecs
in the galaxy which translates to 38.4 pc perdetector pixel. Our H rotation curve for
NGC4254 (see Figure 4.5) risessteeply out to 35 00
(3.4kpc)and thenattens at a ro-
tationvelocityof 155kms 1
. Thisagrees wellwith earlierestimates (Phookun,Vogel
&Mundy1993). Fromthekinematicsweknowthatthesouth-westernpartofthegalaxy
isapproaching. Ifwe assumetrailing spiralarmsthenthe galaxy rotates clockwisewhen
viewedfrom ourperspective.
IntheK-bandNGC4254showsveryprominenttwo-armspiralfeaturesatmostradii. The
northern arm bifurcates at R 4:5kpc, causing a three arm pattern in the outer disk.
Furthermore, the galaxy exhibits considerable lopsidedness. NGC4254 shows a strong
arm-interarmbrightnesscontrast, notedbySchweizer(1976)tobeeven strongerthanthe
one for NGC5194 (M51). Even in the K-band the brightness contrast is rather high,
more than one magnitude over a wideradial range. Gonzalez & Graham (1996) argued
that, combined with a usualdensity wave, some external mechanism is needed to invoke
such high contrasts. However, NGC4254 is well separated from any other galaxy in the
cluster. Phookun, Vogel & Mundy (1993) reported in their paper the detection of high
velocity HI clouds outside the disk's HI emission. The authors argue that in-fallingHI
gasmayberesponsiblefortheunusual"onearmed"outerstructureofthespiral. Inthat
casethespiralstructureofNGC4254 mayhave beenrecentlyreorganized, enhancingthe
southernarmorthearm-interarmmassdensitydistribution. Recentinteractionscouldin
principlecorrupttheproject'sassumptionof asteadystate spiralpattern. Butaswewill
ndfrom our fullanalysis, the steady state assumption is seemingly not far o on time
scales ofa fewdynamical periods.
NGC4254 harborsasmallbar-likestructureat itscenterwithamajoraxispositionangle
of40 Æ
(seeFigure5.1a). Frombothendsofthebartwo majorarmsemergewithathird
1
Theuseofpluralemergesfromthefact,thatthecontentofthisChapterwaspartiallycopiedfroma
multi-authorpaper.
3.5 3.1 g−K color 2.4 2.0
3 kpc 3 kpc
BAR
a) b)
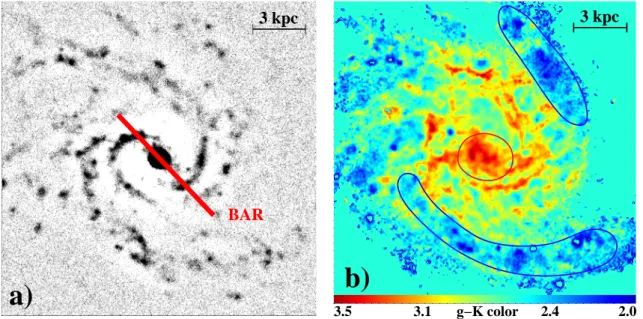
Figure 5.1 Properties ofNGC4254. Panel a)shows themorphology andthe positionof the small
bar. Theimage hasbeen treatedwith theunsharpmask subtractiontechniqueto enhance thespiral
features. b) shows the g K colormap of NGC4254. Thebulge exhibits a redder colorwhile the
spiralarmsappearbluer(circledareas).
arm splitting o the northern arm. By analyzing a g K color map of NGC4254 one
learns that this third arm, together with the southern strong arm, is signicantly bluer
thantheotherregionsofthegalaxyandthusconsistsofayoungerstellarpopulation. The
innersmallbulgeappears redinthe colormap(see Figure5.1b).
In the K-band the disk of NGC 4254 is well approximated by an exponential with a
scalelengthof R
exp 36
00
,corresponding to 3.5kpc ifabrightnessaverage of thearm
and interarm regions is considered and bright HII regions are removed from the image.
Except forthe very center, thewhole surfacebrightnessproleis well tted by a double
exponentialmodel withan inner'bulge' scalelengthof 0.6kpc.
5.1. Hydrodynamic simulations for NGC4254
To model the two-dimensional gas surface densities and velocity elds for NGC4254 we
carried out a set of simulations on a 201 by 201 evenly spaced Cartesian grid. Our data
for NGC4254 extendout to a radius of about 11.6kpc, hence on a 201 by201 grid this
givesaresolutionofabout116pc persideofagridcell, whichisconsiderablyhigherthan
theeective forcesmoothingof400pc.
The gastemperature proleis taken to be uniform and byimposingan isothermalequa-
tion of state throughout thesimulationwe assume that thegas instantaneously cools to
its initial temperature during each updating timestep. The initial density prole of the
gasisexponentialwitha scalelengthequaltoa thirdof thediskradius,namely3.86kpc.
We begineach simulation with the gasinitiallyin inviscid centrifugalequilibrium inthe
axisymmetricpotentialgivenby
?;ax and
halo
(see Section4.1.5). Followingtheinitial-
Table 5.1 Dark haloparameters.
f
d
R
c
v
1
2
=N
(M
D
=M
Dmax
) (kpc) (kms 1
)
0.2 1.08 155 2.45
0.4444 2.00 150 3.42
0.6 3.03 150 3.30
0.85 5.68 155 2.00
1.0 7.30 155 1.84
Note: Dark halo parameters used to generate
thepotentialsusedfor simulations. The 2
=N-
valuesrefertoanaxisymmetric model.
izationofthegasincentrifugalbalance,weslowlyturnonthenon-axisymmetricpotential
at a linear rate computed by interpolatingbetween the nal non-axisymmetricpotential
andtheinitialaxisymmetricpotentialsothatthepotentialis fullyturnedonbythetime
40 soundcrossingtimes of thecode have passed. Here thesound crossingtimeis dened
as the time it takes to traverse the length of the diagonal of a grid cell at sound speed.
Foran isothermal simulation witha soundspeedof10kms 1
thesound crossingtimeof
a cellin oursimulationis about16Myr,sothat by40 soundcrossing times, thegas has
evolved for640Myrwhichis about1.4 times thedynamical timeof thegalaxy measured
ataradiusof11.6kpc. Afterthenon-axisymmetricpartofthegravitationalpotentialhas
beenfullyturnedon,wecontinuetorunthesimulationforaboutanotherdynamicaltime.
Weranalargesetofsimulationsbothtounderstandthepowerandlimitationofourmod-
ellingingeneralandtomatchtheobservations. Simulationswereperformedforatotalof
vedierentfractionsf
d
ofthestellardisk: diskonly,i.e.f
d
=1,andf
d
=0.85,0.6,0.4444
and0.2, oraccordinglyf
d
isgiven inpercentfrom20%to 100%. Inallthecases thecore
radius and the asymptotic velocity of the pseudo-isothermal halo were adjusted to best
match theaveraged rotation curve,as summarizedin Table 5.1. The variations in 2
=N
betweenthelowmassdisksandthemassiveonesaremainlycausedbytheattempttokeep
R
c and v
1
at physicallyreasonablevalues. Thebumpat 20 00
to 40 00
(Figure4.5) istted
betterforthehighmassdisks,whichreducestheoverall 2
comparedtothelowmassdisks.
We have no secure prior knowledge of the spiral pattern speed
p
. We determine it by
assumingdierent valuesfor
p
and thencomparinga simulation to thedata. Forevery
simulation witha dierent stellar/dark halo combination, we get slightly dierent values
forthe best matching
p
or equivalentlyfor the corotationradius R
CR
. We covered the
completerange of reasonableR
CR
,i.e.from abouta diskscale lengthto welloutside the
disk. We even madesimulationsforthecaseof no spiralpattern rotation,R
CR
!1.
To testhowtheamplitudeof thevelocityperturbationsdependson theresponsivenessof
thegas,weransimulationsatavarietyoftemperatures correspondingtosoundspeedsc
s ,
of 10;15; 20and30kms 1
. In the followingSections we discusssome of the resultsfrom
thesimulations.
5.2. Results for NGC4254
5.2.1. Simulated GasDensity
Figure5.2showseightviewsofthesimulatedgasdensityfordierentpatternspeedsover-
plottedascontoursoverthedeprojected,colorcorrectedK-bandimageofNGC4254. The
simulatedgasdensityfollowsanoverallexponentialprolewithascalelengthof4:2kpc,
comparabletotheoneofthediskitself. ThecontoursintheFigurearechosentohighlight
thedensityenhancementsand locationsof thegas shockscaused bythespiralarms. For
almost all simulatedcases thestrong part of the galaxy's spiralstructure lieswellinside
corotation,wherethecircularvelocityislargerthanthespiralpatternspeed. Thegaswill
thus enter the spiralarms from their inward facing side, producingthe strongest shocks
there. Forawellmatchingsimulation,weexpecttheshockstobeneartheOBassociations
that tracethe spiralarms.
Itisremarkablehowwelltheoverallmorphology ofNGC4254 can be matchedbythegas
densitysimulations. Not only are the two major spiral armsclearly identiable inmost
simulationsbuttheless prominentnorthern armand thelocations wherethearmsbifur-
cate are reproduced in some cases well. For fast pattern speeds (R
CR
= 5:4 7:58kpc
in Figure 5.2) we nda strong shock in the northern part of the galaxy that cannot be
correlated with any mass feature. We believe it develops because the potential close to
theupperboundariesofthecomputationalgridisquitenon-axisymmetric,and thisleads
to a spuriousenhancement of a shock. The shock doesnot propagateinto regions inside
thecorotation radius,and therefore we refrainfrom smoothingthepotential.
It isimportant to notethat thesimulationsleadto a very stablegas densitydistribution
thatdoesnotchangemuchafterthenon-axisymmetricpotentialisfullyturnedon. When
the contributionof thedisk isincreased inthecombined potential, all spiralfeatures get
enhancedinthegasdensitybutthegalaxymorphologyisessentiallyunchanged. Within-
creasingpatternrotation(smallercorotationradiiinFigure5.2)wendthatthepredicted
spiralarmsbecome more and more tightlywound. Fora comparison to thestellar spiral
morphology we need to dene some criteria to pickthe right model. If the situation in
NGC4254 issimilarto NGC4321,whose gasand dustdistributionsand theirconnection
to star formingregionshave beendiscussedindetailbyKnapen &Beckman(1996), then
agoodmatchinggasmorphologyisone whereforradiismallerthanthecorotationradius,
the shocks in thegas densitylie on the inside of the stellarspirals. Shortlydownstream
from there, many star forming HII regions, triggered by gas compressions, should show
upaspatchesinthearms. Accordingto thesecriteria,thebestmatchingmorphologycan
be unambiguously identied to be produced by a simulation with R
CR
7:6kpc (Fig-
ure 5.2 upper right panel), corresponding to a pattern speed of
p
20kms 1
kpc 1
.
R
CR
=6:4kpc and R
CR
=8:3kpc enclose the rangeof possiblevalues. This corresponds
to an uncertaintyof 15% inthevalueof R
CR .
Our results were compared to values of R
CR
for NGC4254 from the literature, which
were determined bydierent means. The resultsR
CR
8.45kpc (Elmegreen et al. 1992)
andR
CR
=10.20.8kpc(Gonzalez&Graham1996),scaledtoourdistanceassumptions,
providelargerestimatesthanours. However,giventhepictureofnon-linearorbitalmodels,
wherethestrongpartofthestellarspiralisexpectedtoendinsidetheinner4/1resonance
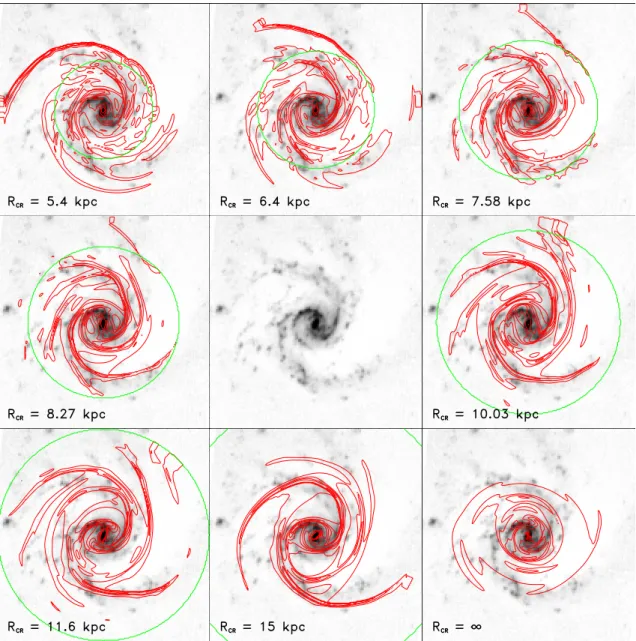
Figure 5.2 Simulation results of the gas density distribution over-plotted in red contours on the
deprojectedK 0
-band imageofNGC4254(center). From theimageanaxisymmetricradial brightness
prole hasbeen subtracted to enhance the contrastof the spiral arms. Theresults aredisplayed for
eightdierent assumptions for thepattern speed, respectively the corotationradius R
CR
. Thegreen
circle marks corotation. The range goes from fast rotationR
CR
= 5.4kpcto slow pattern rotation
R
CR
=15kpc,lyingmostlyoutsidetheimageframeandnallyfornopatternrotation. Displayedare
theresultsfromthef
d
=60% case.
(Patsisetal.1991)wendthatR
CR
7.6kpcisconsistentwiththegalaxy'smorphology.
In short, these simulated gas densities provide us with an excellent tool to determine
thepattern rotation speedof thegalaxy. Apart fromrequiringa constant global pattern
rotation our approach is independent of an underlying spiral density wave model. The
overallvery goodrepresentationofthewholespiralstructurebythesimulatedgasdensity
makesusrathercondent thatthesimulationsrenderrealisticprocessesaecting thegas.
5.2.2. Simulated GasVelocity Fields
Asanotheroutputofoursimulationswe getthetwo-dimensionalvelocityeldof thegas.
Asis evidentfrom a comparisonto thegasdensitydistribution,thevelocityjumpsare {
asexpected{at thelocations wherethedensitymapshows theshocks. They showupas
areas of lowerlocal circularvelocity compared to the elsewhere rather smoothly varying
gasvelocityeld. Thevelocitywiggles,aswellasthedensityshocksthemselves,havevery
tight prolesand thusareeven more narrowthanthephysicalextent ofthe stellararms.
Theyhave to becompared to theobserved kinematics.
5.2.2.1. The observed kinematics
Therotation curvesat the16slitpositionsfromtheobservationsare showninFigure5.3
asdatapoints. Itisapparentthatthelongslitspectraallowagoodvelocitycoveragealong
theslits. Almost allrotation curvesshowcontiguousdatapointsouttoaradiusof &1:
0
5.
The spectra exhibita lot of wiggles on a small spatialscale. Jumps of .30kms 1
on a
scale of 5 00
are common. The very prominent jumpsthat we observed in slit positions
22:
Æ
5 and 225 Æ
clearly exceedthe average wiggle sizes. Insideof about 0:
0
3 the smallbar
inuences thevelocityeld. Themostprominenttrace ofthebaroccursat itsminoraxis
at theslit positions of135 Æ
/157:
Æ
5and 315 Æ
/337:
Æ
5.
Thetraceofkinematicfeaturesintheouterdiskisnotconspicuousinsubsequentslits. The
eastern part of the disk(slit positions 45 Æ
{ 135 Æ
) displaysa quite smoothvelocityeld,
whilethewesternpartshowssome largescalevariations. Asidefrom theinter-armregion
between the inner disk and the southern arm where a 0:
0
5 wide depression is moving
outwardinsubsequentslits(positions247:
Æ
5) nosignicantfeatures areapparent inthe
outerdisk. Unfortunatelyinthisinter-armregiontheS=N isnotsogood. Doesthatmean
we donotseethetraceofthearmsinthevelocityeld,oristhesingleslitrepresentation
of the 2D velocity eld misleading and does not allow us to identify coherent features
in adjacent slits? Clearly, the wiggles associated with spiralarms in NGC4254 are not
nearly as strongas inM81 (Visser 1980), thustheir identicationis harder. A COmap
of NGC4254's center (Sakamoto etal. 1999) shows also no coherent wigglesacross spiral
armsandwedoubtthatitwouldbemuchdierenton aFabry-Perotimage. Ratherthan
beingconfusedbytheone dimensionalnature ofourrotation curve sliceswe believe that
thespiralfeaturesin thevelocityeld areintrinsicallyweak.
5.2.2.2. Overall Fit Quality
Figure 5.3shows the16 separate rotation curveswitha corresponding simulatedvelocity
eld over-plotted. The simulation used here for comparison is the one for which the gas
densitydistributionbest-ttheK-band image(displayed inFigure 5.2). It hasa corota-
tionradiusofR
CR
=7:58kpc{correspondingtoapatternspeedof
p
=20kms 1
kpc 1
{ and a stellar disk mass fraction f
d
of 60%. A gas sound speed of c
s
= 10kms 1
was
assumed here.
The general t quality is governed bythe eect that the projection of thesimulatedve-
locityeld introduces. The good overall match indicatesthatwequite reliablyfoundthe
right position angle and inclination for the galaxy. The simulated velocities align very
wellwith the measureddata points. In addition to the good overall match, the general
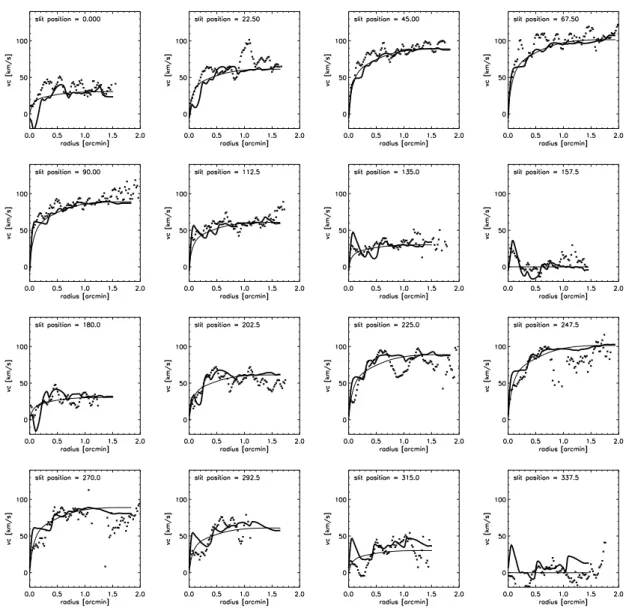
Figure 5.3Simulationresultsofthegasvelocityeldincomparisontotheobservedrotationcurves.
Displayedarethemeasuredrotationcurves(data points),theaxisymmetric model(thinline) andthe
rotationcurves from the hydrodynamical simulations (thickline) for all 16 slit position angles. The
parametersforthe simulationwere: f
d
of60% andR
CR
=7.58kpc. There areno errorbarsplotted
forthedata,buttheerrorscanbeestimated fromthepoint-to-pointscatterofthedata.
risingorfalling shape oftheseparate curvesisalso excellentlyreproducedbythesimula-
tions. The lopsidedness of the galaxy is reected in the shape of the rotation curves on
the receding and approaching side of the disk. At the receding side (67:
Æ
5) the rotation
curverisessteeplyandcontinuestoriseoutto 2 0
,whiletheapproachingside(247:
Æ
5)rises
less steeply but attens out or even drops beyond 0:
0
7. These characteristics are closely
reproducedbythemodels.
A close inspection of the two proles shows however that the overlap in the match of
thesimulatedvelocitieswiththemeasurementsisnotalways satisfactory. Theagreement
of local features in the simulations and the measured data is sometimes very good and
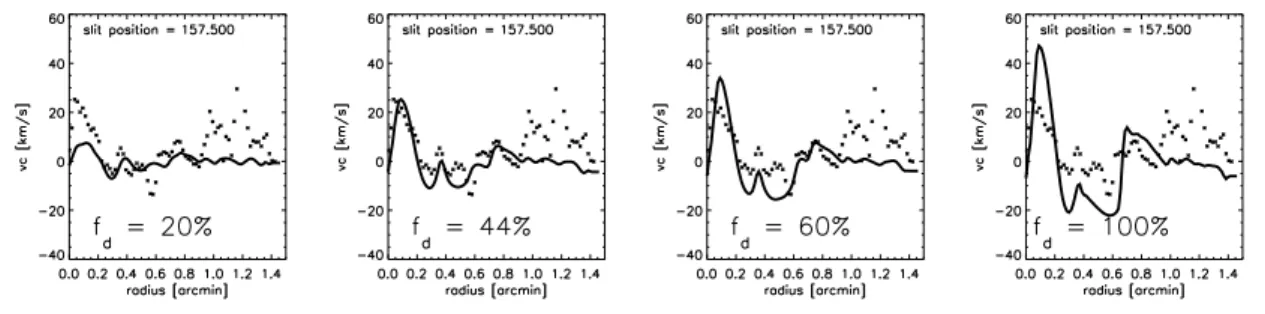
Figure 5.4 Comparisonof four simulationsfordierent fractions f
d
of the stellarmass component.
The simulation wasdone with a corotationradius of 7.58 kpc and a gassound speed of 10kms 1
.
Displayed is one of the 16 slit positions. Clearly thepredicted"wiggles" in the rotationcurve grow
muchstrongerforhigher diskmassfractions.
even occurs in subsequent slit positions. However, there are also many locations, where
the match is poor. This is particularlythe case in the innerregion of thegalaxy, where
thesmallbar dominatesthekinematics. Bothproles show strongwiggleswhere theslit
crossesthebar,especiallyclosetotheminoraxisofNGC4254'svelocityeld,whichisalso
close to the minor axis of thebar itself. While thesimulationsshow a rather symmetric
imprint,themeasurementsexhibitasignaturedierentfromthat, leadingtoa signicant
mismatchatseveralslitpositions,e.g.,292:
Æ
5and337:
Æ
5. Thismightbecausedbythebar,
havinga slightlydierent patternspeed. Inthe outer partsofthe rotation curvewe also
ndseveralwigglesintheobserveddatathathavenocorrespondencetothewigglesinthe
simulationsandviceversa. It isimportant tonotethatwedonotexpectto reproduceall
the wiggles inthe galaxy's rotation curves, since we are onlymodellingthose created by
thenon-axisymmetricgravitationalpotential. The wigglesoriginatingforanotherreason
{ like expanding SN gas shells { are not considered by the simulations and thus do not
show upin theresultingvelocity eld.
Anoverallt qualitygetsdetermined byaglobal 2
-comparisonofthesimulatedvelocity
eld to the actual observed velocity eld along the 16 measured slit positions. The 2
-
ttingexcludestheverycentralregionhostingthesmallbarbecause themodellingisnot
intended to t the central bar, which might have a dierent pattern speed. The total
numberofdata pointsincludedinthe 2
-tting is1077.
5.2.2.3. Varying the Stellar to Dark Matter Ratio
As already mentioned in Section 5.1, we performed simulations for ve stellar disk and
dark halocombinations,aslistedinTable 5.1. Since thenon-axisymmetricperturbations
are induced in the potential by the stellar contribution, we expect theamplitude of the
wiggles in themodelledrotation curvesto dependsignicantly on thenon-axisymmetric
contributionofthestellarpotentialwhereasweexpecttheradialdistributionofthewiggles
toberatherindependentofthestellarmassfraction. Asexpected,inthesimulationswith
the lightest disk, the wiggles look like modulations on the axisymmetric rotation curve.
In thecase ofthemaximumdisk, therotation curvesarestrongly non-axisymmetric(see
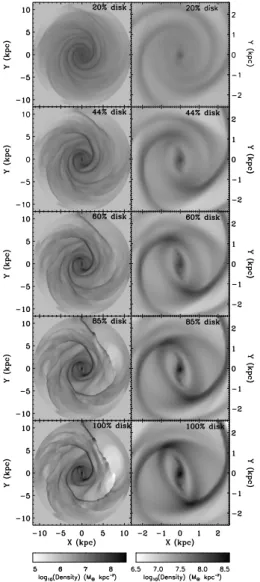
Figure5.4). Thisisalsovery evidentfrom Figure5.5,whichshowsthelogofthegasden-
sity forthe sequence of simulations. The density contrast betweenhigh and low density
regionsincreasesdramaticallyasthediskfractionincreases. Todescribethischaracteristic
more quantitatively, we learn from Figure 5.6 that the amplitude of the deviationsfrom
axisymmetryincreaseslinearlywiththemassfractionofthestellardisk,whichprovesthe
generalvalidityof theconcept withwhich we try to approachthisproblem.
Forthelowest diskfraction case (20%disk),
Figure 5.5Grey scaledmapsofthelogofthe
density from simulations on a 201201 grid,
withc
s
=10kms 1
, andR
CR
=7:58kpc,and
with increasing disk contribution to the total
galactic potential. The left column shows the
entire simulated region, and the right column
showsonlytheinner2.6kpc 2
region.
we ndthat thespiralarmsare mosttightly
wound and most smooth in their curvature.
Increasing the disk fraction to 44%, also in-
creasesthepitchangleofthespiralarms. The
overall morphology of the structure appear-
ingoverthefulldisk(11:6 2
kpc)ismostlyun-
changed once the disk fraction is 44% and
higher. There are slight dierences in the
details. As seen further from the right col-
umn of Figure 5.5, the barred structure in
the central region also grows stronger. In
fact, the strongest velocity wiggles arisingin
the modelledvelocity eldsaretheones con-
nected to the central bar-like feature. How-
ever,sinceherewearenotinterestedinmod-
elling the dynamics of the bar, we exclude
this inner part from the analysis. If we do
a formal 2
comparison of the models with
the observed data we nd that for most of
the sub-maximaldisks the t is considerably
better than for heavy stellar disks. By for-
mal, we mean that we use all data points
for the 2
-t, regardless of whether acertain
partmatcheswellornotwithtwoexceptions:
weexcludethevery centralpartwiththebar
and we correctfortheouterstrongshockap-
pearing in the fast rotating models(see Fig-
ure 5.2).
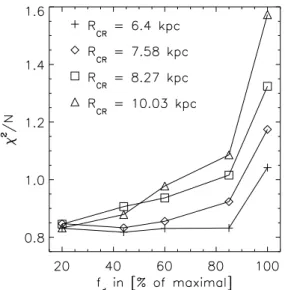
Theresultfromthis 2
-tispresentedinFig-
ure 5.7. In all cases, f
d
= 100% gives the
worstt to theobserved rotationcurves. For
thelowermassdisksitisvery hardto decide,
whether a particular disk mass is preferred.
For R
CR
= 6:4kpc we nd about the same
2
forallnon-maximaldiskmodels. Sincewe
cannotrejectdataonaphysicalbasis,wecan
stateonlyatrendat thispoint. Thus,ourconclusionfromthispartoftheanalysisisthat
thediskis mostlikelylessthan85%maximal.
Oneveryinterestingthingtomentionisthefactthattheformallypreferredaxisymmetric
maximum-disk decomposition(see Table 5.1) turnsoutto bethe mostunfavored model,
once the simulations were performed. This implies that even if an axisymmetric model
Figure 5.6Deviationofthesimulationfromax-
isymmetry. Displayed is theaverage deviationof
eachradial simulationbinfromtheaxisymmetric
rotationcurve. Itriseslinearlywiththestellardisk
masscontributionf
d .
Figure 5.7 Formal 2
-t of the gas velocity
simulationsfordierentstellarmasscontributions
f
d
, normalizedbythe 2
-tfortheaxisymmetric
modelrotationcurve. Displayedarecasesforfour
dierentvaluesofR
CR
. Fromthesimulationswe
canruleoutthecaseswiththehighestdiskmass.
prole provides a better t to a measured rotation curve, it does not necessarily mean,
that thiscombination provides thebestt when one considers the2Dnon-axisymmetric
gasevolution.
5.2.2.4. Varying the Gas Temperature
Thiskindofanalysismaybeverysensitivetothetemperatureofthegaswhichisassumed
forthe modelling. Highergastemperature corresponds to a highercloud velocitydisper-
sionc
s
andthustoareductionintheresponseofthegastoanyfeatureinthegravitational
potential.
Within the Milky Way Galaxy c
s
varies from 6kms 1
in the solar neighborhood to
25kms 1
in the Galactic center (Englmaier & Gerhard 1999). For simulations of a
galactic disk withan isothermalequation of state, themostcommonly usedvaluesforc
s
are 8 { 10kms 1
, corresponding to < 10 4
K in gas temperature (Englmaier & Gerhard
1999; Weiner et al. 2001a). In these simulations the authors make the statement that
within thereasonable limitsof c
s
= 5 30kms 1
the modelled gas ows across the pri-
maryshocks isnotconsiderably aected.
Only when modellingstrongbars in galaxies thesimulations might be dependent on the
choiceofthegassoundspeed(Englmaier&Gerhard1997). Forthemainsetofsimulations
wechosec
s
=10kms 1
,correspondingtoagastemperatureof7250K.Toprobetheeect
of thegas temperature, we performed simulationsforfour dierentgas soundspeeds,c
s ,
of10,15,20and30kms 1
. Theresultinggasdensitydistributionsforthehighresolution
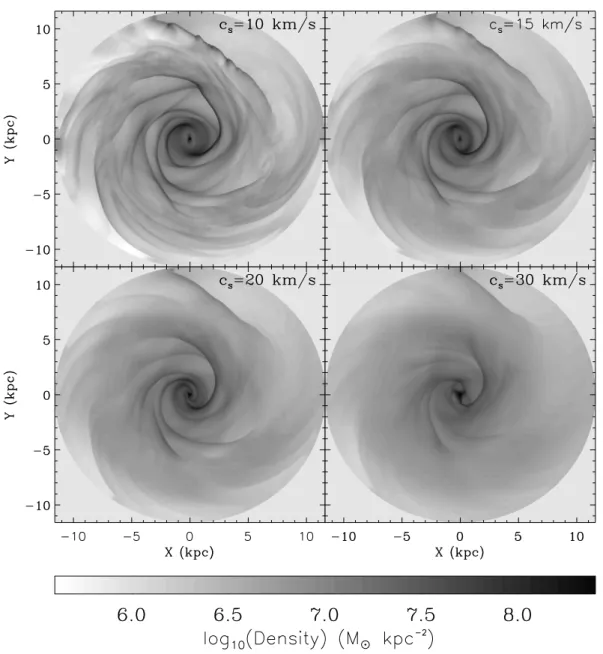
Figure5.8Grey scaledmapsofthelogofthegasdensityfromsimulationsona401401grid,with
60% diskfraction,R
c
=7:58kpc. Fourcasesaredisplayed withincreasingsoundspeedc
s
,of10,15,
20and30kms 1
. Theentiresimulatedregionis shown.
simulationaredisplayedinFigure5.8. Sinceathighersoundspeedsthepressureofthegas
becomesmoreimportant,thegasrespondslessstronglytothestellardensitywaveforcing.
This is obvious when one looks at gure 5.8where in a sequence of simulationsdiering
onlyintheirsoundspeedwe seethenon-axisymmetricfeatures inthegas graduallyfade
with increasing sound speed. By c
s
= 30kms 1
the spiralstructure does not extend as
farasitdoesinthecoldergascases eventhoughtherearestilltracesofsomeofthemajor
spiral features. However, a sound speed of c
s
= 30kms 1
impliesa gas temperature of
65:000K for a monatomic ideal gas. This is an extreme test case that doesnot apply
to real galaxies. Furthermore, the strength of the wiggles inthe velocity eld vary only
very littlebetweenc
s
=10 20kms 1
. Weconcludethat varyingthevalueforc
s
within
reasonable limits, the morphology and velocity elds of the simulations are aected not
enough tochange theconclusionsforthisgalaxy.
5.2.2.5. Varying the Grid Resolution
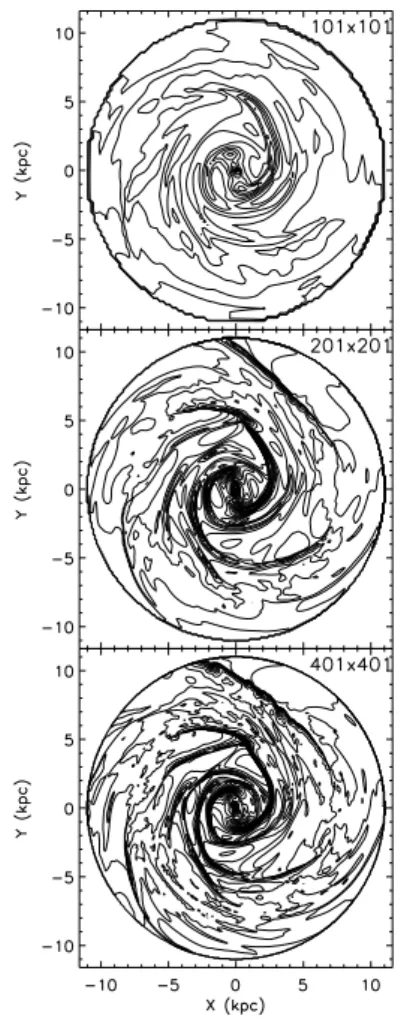
Figure5.9Contourmapsofthedensity
from simulations with c
s
= 10kms 1
,
60% diskfraction, R
CR
=7:58kpc,and
with increasinggrid resolution. Thefull
potential is turned on in 20 cell sound
crossingtimesforthe101101grid,40
t
s
for the 201201grid, and 80 t
s for
the 401401grid. Theresult is shown
after1590Myr(t
dyn
)have elapsed.
Thechoiceofthegridsizewasmainlymotivatedby
the desire to achieve reasonable computing times,
and not to exceed the seeing resolution. To check
thegrid cellsize'seect onthe results,forselected
cases we also ran simulations on grids with two
timeshigherresolution,401401cells,aswellason
gridswithtwotimeslowerresolutionona101101
grid.
Decreasingthegridresolution increasesthenumer-
ical diusivity of the code. One reason for this is
thatonacoarsergridonestoreshydrodynamicalin-
formationinlarger cells,meaningthat information
isaveragedoverlargerareas,thuscausinglossofin-
formationonnerscales. Figure 5.9shows howthe
shocktransitionsareincreasinglyblurredoncoarser
grids. Many features in the density map that ap-
pear for the 201201 and the 401401 grids are
not present at all on the101101 map. The mor-
phologyof the201201 mapontheother hand,is
very similarto the401401 grid.
Thenal 2
tdeviationbetweensimulationswith
dierentgridcellsrangesatabout6%anddoesnot
change the conclusions of this paper. Accordingly
we consider it safe to perform the simulations on
themediumresolution gridweused.
5.3. Discussion of possible caveats
A comparison of the observed and simulated kine-
matics has turnedout to bechallenging. Although
the overall shapes of the dierent rotation curves
werevery wellreproducedbythesimulations,some
smallscale structureremains unmatched. The for-
mal comparison of thegas velocity eld to theob-
served Hkinematicsfavorssimulationswithsmalldiskmassfractionsf
d
(see Figure5.7)
and correspondingly small values for the stellar mass-to-light ratio. With the K-band
mass-to-light ratio discussed in Section 4.1.5 our results yield an overall stellar M/L of
?
.0:5. Wecanestimatetherelativemassfractionsfromtheircontributionstothetotal
rotation velocity. At a radius of 2.2 uncorrected K 0
-band exponential disk scale lengths
(2:2R
exp 79
00
or7.7kpc), theindividualrotational supportof the stellarand dark halo
components for f
d
= 85% are v
?
= 125kms 1
and v
halo
= 86kms 1
. If a total mass is
estimated via
M(2:2R
exp )=
v 2
(2:2R
exp
)2:2R
exp
G
(5.1)
we nd that M
halo
0:47M
?
at R = 2:2R
exp
, or accordingly & 1=3 of the total mass
insideR
exp
isdark. Since ourcondencelimitsarenotvery tight,we cannotusethem to
test other authors' ndings indetail. Projects yielding resultsin favor of a sub-maximal
stellardiskusuallynda diskmassfraction lessthanourupperlimitestimate. Bottema
(1997)aswellasCourteau &Rix (1999)concludethatthecontributionofthestellardisk
to the total rotation is v
?
0:6v
tot
which translates to M
halo
0:6M
tot
. At thecurrent
state oftheprojectwe cannotexclude orconrmthese ndings. Thisissueis goingto be
discussedmore thoroughlyassoon aswehave a fewmore examples analyzed.
In the following Sections we will discuss the details that could cause deviations from a
perfectmatch betweenthesimulationsand themeasurements.
5.3.1. Is the ConceptReasonable?
If the self-gravity of the stellar mass in the disks of spiral galaxies plays an important
role then undoubtedly the potential becomes non-axisymmetric. The trajectory of any
kinematictracerinthegalaxy,suchasthegas, shouldbeaectedbythesepotentialmod-
ulations. But is the HII component of the gas the best choice for tracing the galaxy's
potential? Analytic calculations of gas shocks in the gravitational potential of a spiral
galaxy (Roberts 1969) tell us that we shouldexpect velocity wiggles with an amplitude
of 10 to 30kms 1
while crossing massive spiral arms. However, kinematic feedback to
the gas from regions of massive star formation, from expanding gas shells produced by
supernovaexplosionsandfromothersourcesofturbulence,introducessmall-scalerandom
noiseinthevelocityelds. These uctuationstypicallylieintherangeof 10to 15kms 1
(Beauvais&Bothun1999)and seemevenhigherinthecase ofNGC4254. Thekinematic
small-scalenoise could be increased ifthe dynamics of the brightest HII regions is kine-
maticallydecoupledfromtheglobalionizedgasdistribution. Tocheckthisweover-plotted
theH-intensity on therotation curvesto seeifthe star formationregions coincide with
the strongest wiggles in the rotation curves. There is, however, no discernible relation
betweentheamplitudeofa wiggleandtheintensityof theHII region,indicatingthatthe
deviationsarenotconned to compactHII regions(see Figure 5.10).
Asan alternative to observingthe ionizedphase of the hydrogen gas, one could consider
using HI radio observations. However, available HI data are limited by the larger size
of theradiobeam thatsmears outkinematicsmall-scalestructures in thegas. In princi-
ple,stellarabsorptionspectracould also providerelevantkinematicinformation,butthis
approach has two disadvantages compared to an approach using gas kinematics. First,
theacquisitionofstellarabsorptionspectrawithsuÆcient S/Nwouldtakeaprohibitively
largeamount oftelescopetime. Second,stellarkinematicscannotbeuniquelymappedto
a given potential; there are dierent sets of orbitsresulting in thesame observed surface
massdistributionand kinematics. Thus,despite its apparent shortcomingsHII measure-
ments seemto be themostpromisingmethodwith whichto approach theproblem.
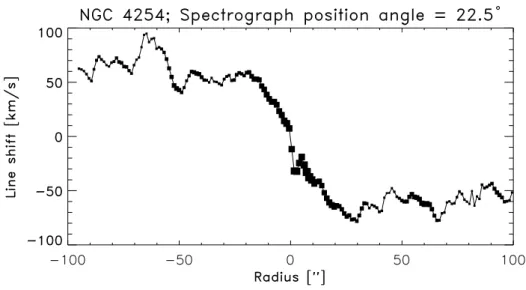
Figure5.10NGC4254rotationcurvefortheslitpositionangleof22:
Æ
5. Theplotsymbolsizesreect
theintensityoftheH-lineateachradius. Itisapparentthatstongwigglesarenotdirectlyrelatedto
singleHIIregions.
Could the discrepancies between modelled and observed kinematics be related to taking
the NIR K-band image of a galaxy as the basis to calculate its stellar potential? As
already discussed in Section 4.1.2 there are several factors which throw into question
whether theK-bandimageisa good constant mass-to-light ratiomap ofthestellarmass
distribution despite the color correction we applied. However, the two major factors {
populationeects and dust extinction { tend to aect the arm-interarm contrast, rather
thanthelocationoftheK-lightspiralarms. Dust lanesliepreferentiallyinsidethem=2
component of a galaxy's spiral (Grosbl,Block &Patsis 2000) absorbing interarm light,
while the red super giants may actually have their highest density in the spiral arms
directly,wheretheyemergedfromthefastestevolvingOBstars. Thiseectshouldbecome
apparent inthesimulationsasslightlywrongamplitudesofthe gaswiggles,leavingtheir
radial positionmostly unchanged. So even ifthe K-band images might actually include
unaccountedmass-to-lightratiovariations,theymostprobablyintroduceonlysmallerrors,
which shouldnot result in an overall mismatch of themodelswith the data. The color-
corrected K-band images should therefore reect the stellar mass accurately enough for
our analysis. Certainly, there appears to be no better practical mass estimate that we
could useforouranalysis.
5.3.2. Are thereSystematic Errors in the Modelling?
Themostcriticalpartofthisstudyaretheseveral modellingstepsrequiredtopredictthe
gas velocity eld for the comparison with the data. We apply a spatial lter to the K-
bandimage before calculatingthe diskpotentialto reduce the signicanceof theclumpy
HIIregions (asdescribedinSection4.1.4). Theresidualmapof thediscardedcomponent
shows all the bright HII regions in thedisk, giving us condencethat we have excluded
much of the structures that reect small-scale M/L variations. This correction removes
roughly 3.5%of thetotal K-band light and does not dependstrongly on the numberof
Fourier components used for the t. For two extreme decompositions employing 6 and
16 Fourier components, themean resultingrelative discrepancyinthe derived potentials
is only 10 6
. One remaining concern in calculating the potential might be that the
mass density map cuts at the border of the image. However, the galaxy completely ts
intheframe, fadinginto noisebefore theimageborder. Moreover, wedo notperformthe
simulationsforthecompletegalaxy,butonlyfortheinner11.6kpcinradius. Sotheedge
cuto eect isverysmalland aectsthepartof thepotentialwearelookingatevenless.
For the dark matter component we chose an isothermal halo with a core because of its
exibilityinttingrotation curves. The functionalformof thedark haloprolehasonly
a second order eect on the resultsof the simulationscompared to thevariations dueto
itstwobasicparametersR
c andv
1
. Wedecidednottodistinguishbetweendierentdark
haloproles forthepresent analysis.
The most complex step surely is the hydrodynamical simulation of the gas ow in the
galaxy'spotential. Beyondthetests ofthecodediscussedinSection4.2.2, itistheexcel-
lentmorphologicalagreementbetweenthesimulatedgasdensityprolesandtheobserved
spiral arms that gives credence to the results of the code. However, for NGC4254 and
other galaxies whose inclinationwith respect to the line-of-sight is relatively low, short-
comings inthe kinematics comparison may arisefrom the two dimensional nature of the
simulations. While insuch cases the observationsare rathersensitve to gas motionsper-
pendicularto theplane of thedisk, those velocity componentscannot be modelled. This
iscertainly a systematicerror thatmustbe keptinmind.
In a real galaxy the assumption of a global constant pattern rotation speed may not be
fullled. Inparticular,weshouldexpectthecentralbarto haveadierent patternspeed.
Also,thepattern mightbe windingslowly,ratherthanbeingxed inacorotating frame.
Furthermore, the gasmaynot have a uniform temperature. If these simplicationswere
relaxed,thelocationofthespiralarmsinthehydro-simulationswouldchange, andeven-
tually lead to a dierent overall t quality. Lacking any solid basis to constrain these
parameters, we are unable to implement these eects into the modelling procedure. Fi-
nally,thecodedoesnotincludegasself-gravity. Theeectofgasself-gravityisdiÆcultto
quantify without actually performing simulations, but from the literature we know that
ittends to amplifythe gasresponse. Gasself-gravityalso suppressesthetendency of the
gas to shock(Lubow, Balbus & Cowie 1986). Since we are interested in the strength of
thegasresponsetothegravitationalpotentialandwealready ndthatforhighdiskM/L
the response is too strong, we assume that our upper limit holds also if gas self-gravity
was included. Given the good morphological match, we maycondentlyassume that all
ourapproximations arenotfaro.
This leaves non-gravitationally induced gas motions and the fact that any gas motion
perpendicular to the plane of the disk cannot be reproduced by two dimensional gas
simulations as the main complications in the comparison of the modelsto the observed
kinematics. Eliminatingmismatchingwigglesfromtherotationcurveisnotpossiblesince
we have nomeansto reliablyidentifytheones thatarenon-gravitationally induced. Any
methodwe applytoexcluding partsofthedata willbe aectedbysome kindofbias 2
.
2
ThemethodthatwasdescribedinSection4.3.2.1wasdevelopedafterthispaperhavebeenpublished.
5.3.3. Is the Galaxy Suitedfor this Analysis?
Finallywe must considerthe possibilitythatthegalaxy we picked forouranalysis might
notbeas suitedasitappeared to be. NGC4254 is nottheprototype of aclassicalgrand
design spiral galaxy in optical wavelengths. However, as it can be seen in the central
frame of Figure 5.2, thegalaxy exhibits inthe M/L corrected K 0
-band image mainly an
m = 2 spiral pattern with a strong symmetric part, that ends at 5:5kpc and fainter
outer extensions. With its largeangular size and moderate inclination, NGC4254 seems
to beone ofthemostpromisingcandidatesforthiskindofstudyinoursample. However,
as discussedintherst paragraphof thisChapter,there are indicationsthatthis galaxy
might not be as isolated and undisturbed as one might expect. In fact, the morphology
itself implies some perturbative event in its recent evolution history: NGC4254 shows a
clearm=1 modeand alopsideddisk. Inthisrespectitwasargued earlierthatin-falling
HIgasclumps,whicharevisibleinradiodataanddonotemitinH,mightberesponsible
fortriggeringdeviationsfrom puregranddesignstructure(Phookunetal. 1993). So have
we reasonto believethatNGC4254 is farfrom equilibrium? This ishardto tell, because
on theother handwe ndplenty ofargumentsthat astable propagating densitywave in
NGC4254 is responsiblefor its morphology. This galaxy shows many similarities to the
spiralgalaxy NGC5247whosemorphologicaland dynamicalpropertieswerediscussedby
Patsis, Grosbl & Hiotelis (1997), based on SPH simulations. We note that in our best
model,thestrongbisymmetricpartoftheK 0
spiral,endswellinsidethecorotationradius,
althoughfainterextensionsreachoutto it. Thispictureisinagreementwiththe4/1SPH
modelsofPatsisetal. (1997). Assumingcorotationcloseto thecharacteristic bifurcation
ofthearmsat 5kpcontheotherhand,wedonotobtainsatisfactoryresults(upperleft
frame inFigure5.2). Based onthisisseems appropriatetoconcludethat NGC4254 isat
leastclose to anequilibriumstate and it shouldbe suitedfora casestudy.
5.4. Conclusions
We performed hydrodynamical simulations to predict the gas velocity eld in a variety
of potentials for thespiralgalaxy NGC4254 and compared them to observations. These
potentials consisted of dierent combinations of luminous(non-axisymmetric spiral) and
darkmatter(axisymmetric)components. Theresultinggasspiralmorphologyreectsvery
accurately themorphologyofthegalaxy andallows usto specifythecorotationradiusor
thepattern speedof thespiralstructurequite precisely. It is noteworthy thatwithinthe
errorrange given,thebestmatchingpattern speeddoesnotdependon themassfraction
of the stellar disk relative to the dark halo. For NGC4254 we nd that the corotation
lies at 7:51:1kpc, or at about 2.1 exponential K 0
-band disk scale lengths. From the
kinematicsofthegassimulationswecouldruleoutamaximaldisksolutionforNGC4254.
Within the half-light radius the dark matter halo still has a non-negligibleinuence on
the dynamics of NGC4254: specically, ourfraction f
d
.0:85 impliesthat &1=3 of the
total mass within2.2K-banddiskscale lengthsis dark. However, the comparisonof the
simulated gas velocity eld to the observed rotation curves turned out to be a delicate
matter. The observed rotation curves show a signicant number of bumps and wiggles,
presumablyresultingfromnon-gravitationalgaseects,thatcomplicatetheidentication
ofwigglesinducedbythemassivespiralarms. Therefore,beyondconcludingthatthedisk
islessthan85%ofmaximal,wewereunabletospecifyaparticularvalueforthediskmass
orto test the results from Bottema (1997) orCourteau &Rix (1999). But already with
thisstatement wedierfromtheconclusionsofDebattista&Sellwood(2000)and Weiner
etal. (2001b),who arguethat theirconclusions formaximaldisksof barredgalaxiesalso
hold fornon-barred spirals. Since we onlyanalyzed one galaxy so farit is inappropriate
to state here that the centers of unbarred spirals, what we still consider NGC4254 to
be despite its smallbar-like structure in thevery center, are generally governed bydark
matter.
In the next Chapter the results from more galaxies are presented. This will create a
broader basis to decide, whether single galaxies dier very much in their dark matter
content,or ifthebulkofthespiralsshowsimilarcharacteristics.