RV Poseidon Cruise Report POS497:
Seafloor acoustic ranging
across the North Anatolian Fault offshore Istanbul, Çanakkale – Izmir,
(12.4 – 15.4.2016)
Dietrich Lange and cruise participants
Kiel, August 2016
25.5˚ 26˚ 26.5˚ 27˚ 27.5˚ 28˚ 28.5˚ 29˚ 29.5˚
38.5˚
39˚
39.5˚
40˚
40.5˚
41˚
Network
Canakkale
Izmir
20 miles 12
3
1.) Introduction and Objectives of cruise POS497
The area around the Marmara Sea, one of the most densely populated parts of Europe, is subject to a high level of seismic hazard. The MARsite project proposes to identify the Marmara region as a ‘Supersite’ within European initiatives to aggregate on-shore, off-shore and space-based observations, comprehensive geophysical monitoring, improved hazard and risk assessments encompassed in an integrated set of activities to respond to all priorities identified in the ENV.2012.6.4-2 call. The overall project objectives of MARsite are to:
- Achieve long-term hazard monitoring and evaluation
- Improve existing earthquake early-warning and rapid-response systems - Improve ground shaking and displacement modelling
- Pursue scientific and technical innovation - Interact with end users
The MARSITE project includes 21 partners from Europe, under the coordination of KOERI. Ifremer coordinates Work Package 8 (WP8), the objective of which is to implement an integrated approach based on multiparameter seafloor observatories, to continuously monitor the micro-seismicity along with the fluid expulsion activity within the submerged fault zone. The geodetic and seismological networks are the long-term components of the MARSITE program. Within this program, the MARSITECRUISE was initiated and conducted. During research cruise with RV Poseidon (POS484, April 2015) the geodetic stations were serviced and the OBS stations equipped with new batteries and installed with a slightly larger aperture of 15 km designed to measure seismicity in the region of the geodetic array.
The geodetic installation and the OBS network installed to monitor micro-seismicity and deformation along the Marmara fault segment of the North Anatolian Fault Zone (NAFZ) (location of the working area is shown Figure 3 and in the figure on the front page) and contributes to the long-term hazard monitoring and evaluation objective of MARsite. The Marmara segment of the NAFZ is the only segment that has not been activated in the present series of major earthquakes and may have accumulated a slip deficit of up to 4-5 m since the last event in 1766.
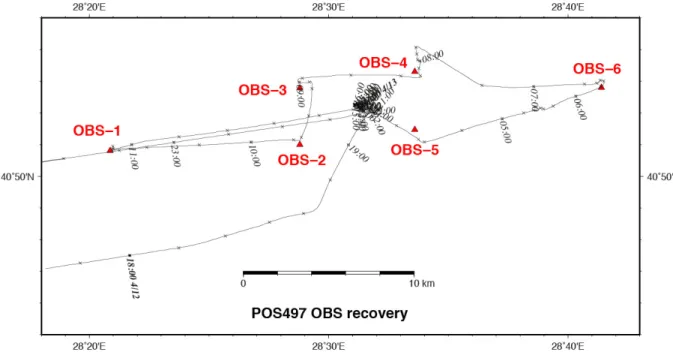
Objectives of the proposed cruise POS497 were to recover the small aperture array of 6 OBS stations (Figure 1 and 5) and to download the data from the 10 geodetic transponders (4 from the University of Brest, 6 from GEOMAR, Figure 2 and 4) using an acoustic modem. In order to obtain an independent estimate of the sound velocity, we proposed to make a CTD profile to measure salinity, pressure and temperature (e.g. no water samples were taken), which allows an independent
baseline length changes with an accuracy of ~6 mm. However, the internal sound- speed sensors of the geodetic transponders (manufactured by Valeport and mounted on all AMTs) shows long-term drifts and unexpected offsets after any major fluctuation in water temperature (Figure 7). Therefore we currently have to recalculate the sound speed using temperature and pressure measured by the AMTs and assuming a constant salinity. The sound speed is really the key information to convert the measured travel-times between beacons into distances.
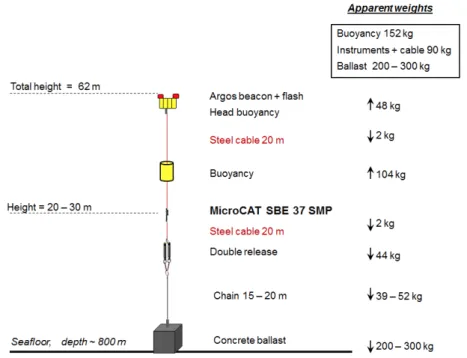
To overcome these difficulties (drifting and unstable sensors) and assumptions, we proposed and installed a long-term near-bottom CTD mooring (Figure 6) close to the geodetic array (Figure 4), to monitor the salinity (conductivity sensor) as well as the temperatures and pressures, as independent measurements with more robust sensors. The proposed instrument is a Seabird MicroCAT SBE 37 SMP (with temperature, pressure and conductivity sensors). The Seabird sensor is installed near the sea-bottom (~25m above) on a mooring line 62 m high. The mooring is composed of an expandable weight, an acoustic release, a cable with the sensor attached to it, and a flotation buoy immerged at about 750 m below sea-surface.
Figure 4 shows a sketch of the sub-surface CTD mooring installed during POS497.
2.) Narrative of cruise POS497
RV Poseidon left the harbour Catania (Italy) on Thursday April 7, 2016 at 09:00 local time for the transit to Çanakkale where Poseidon arrived on 12 April 02:32 local time at the entry to the Dardanelles. During the transit weather conditions were good with some strong wind in-between. After taking up the pilot at the western entrance of the Dardanelles three scientists (Jean-Yves Royer, Anina Timmermann and Dietrich Lange) and two observers (Eyyüp Özbek, Nuri Karaaslan) embarked with a small boat from the harbour of Kepez located 5 km southwest of Çanakkale on Tuesday, April 12 at 09:20 local time (equals 12:20 UTC time). Weather conditions during the whole cruise were good with very little wind and cloudy to sunny sky. After leaving the Dardanelles at 12:40 the ship continued to head to the East and arrived in the working area (Figure 1 and figure on front page) on 12.04.2016 at 21:50 LT. After meeting with the guard boat which is needed in the working area due to the ship traffic in the Marmara see, scientific work started at 22:30 LT on April, 12 2016.
The whole night until ~06:30 LT the ship was positioned above the geodetic array in order to read out the geodetic data from the instruments (on the seafloor) with an acoustic modem which was lowered from Poseidon to a depth of ~60 m. Data- download was first done for the GEOMAR stations where 99.3% of all data could be downloaded. In general the data-download took much longer then expected because connection to the instruments with the acoustic link was very unstable. At approx.
5:00 LT the download was continued with the University of Brest stations until 7:00 LT. The geodetic stations worked very well and most of the baselines had visibility and all sensors worked as expected. Furthermore the batteries oft the stations did discharge as expected.
In the morning Poseidon started to recover the 6 OBS stations. It took 6 hours to recover all 6 OBS stations due to the small aperture of the seismic array (Figure 1).
All releasers opened and stations could be recovered without problems. As the day before, the state of sea was very calm making it easy to find the OBS stations on the surface and to collect the stations with Poseidon. Poseidon started to pick up OBX5 (07:30 LT), followed by OBX6 (09:39 LT), OBX4 (11:04 LT), OBX3 (12:08 LT), OBX2 (12:43 LT) and OBX1 (13:46LT).
Then, Poseidon returned to the geodetic network to perform a CTD profile, which was planned to calibrate the data for the CTD mooring. However, the CTD profile could not be measured due to a problem with the electric connection of the CTD at the winch entry point and the CTD was lifted back on board after 1 minute in the water. Then, the CTD mooring of the University of Brest was installed by a free fall installation between 13:30 and 13:58 LT. Drop positions are listed in Table 3.
After repairs of the winch, the second part of the download of the geodetic beacons from the University of Brest started and continued until 01:10 LT on April, 14 2016. Thereafter, research work was ended and Poseidon headed to the direction of the Dardanelles. The pilot entered Poseidon 10:50 and left on 13:55 after passing the Dardanelles. In-between the observer Nuri Karaaslan disembarked with a small boat in Kepez (5 km southwest of Çanakkale). Finally, Poseidon arrived safely in the port of İzmir at 09:48 local time on April 15, 2016.
Figure 1: Map of the OBS deployment together with the cruise track. Figure from Jean-Ives Royer.
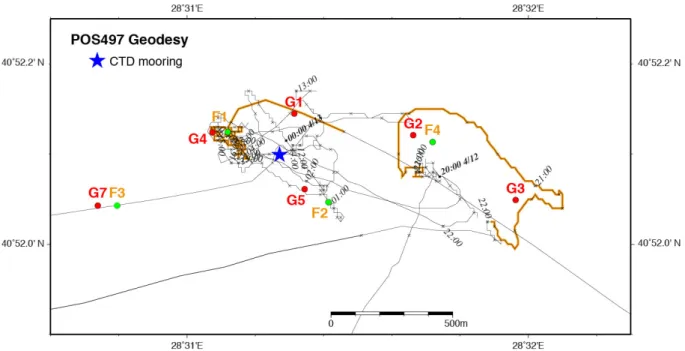
Figure 2: Map of the geodetic stations together with the cruise track. Figure from Jean-Ives Royer.
3.) Location and station maps
Detailed maps of recovered, serviced and redeployed equipment are shown in Figures 1,2,4 and 5.
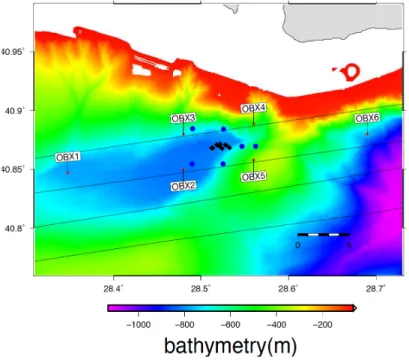
Figure 3: Location of the offshore geodetic network (white star) on the Istanbul-Silivri segment in the Kumburgaz Basin (KB). The North Anatolian Fault trace is indicated by black lines. Arrows with 95% confidence ellipses represent the velocity field derived from permanent GPS stations, relative to stable Eurasia. Figure from Sakic et al. (2016).
Figure 4: Geodetic transponders are shown with black circles. The white lines and red lines show the baselines measured for the two set of geodetic transponders. Location of the moored long-term CTD is indicated by a red star.
Figure 5: Station configuration of the 6 deinstalled OBS instru- ments (red points labelled with station name). The station geometry (April 2015 until April 2016) was optimized for detection of local seismicity along the NAF. The geodetic trans- ponders are shown with black circles and OBS stations for the first phase (November 2014 until April 2015) are indicated with blue circles.
28.51˚ 28.52˚ 28.53˚
40.865˚
40.866˚
40.867˚
40.868˚
40.869˚
40.87˚
40.871˚
40.872˚
40.873˚
40.874˚
−800 −750
bathymetry(m)
CTD1
G2307
G2305
G2303 G2304
G2301
G2302
F1 F3
F4 F2
0.5 km
Figure 6: Sketch showing the near-bottom CTD mooring (with temperature, pressure and conductivity sensors) installed within the geodetic array. The CTD instrument is a Seabird MicroCAT SBE 37 SMP (with temperature, pressure and conductivity sensors). The total height of the mooring is 62 m, with the sensor 25 m above seafloor.
The flotation buoy is located at about 750 m below sea-surface.
Location of the CTD mooring is shown in Figure 4,
4.) Coordinates
Table 1: Coordinates of the geodetic stations. Water depths of the geodetic stations refer to the seafloor and were taken from the AUV bathymetry.
Name longitude longitude latitude latitude depth Looger ID
(°) min (°) min (from AUV)
Geomar stations:
G7 28 30.7380 40 52.0860 827 G2307
G4 28 31.0740 40 52.2480 813 G2304
G5 28 31.3440 40 52.1220 804 G2305
G2 28 31.6620 40 52.2420 805 G2302
G3 28 31.9620 40 52.0980 779 G2303
G1 28 31.3140 40 52.2900 807 G2301
University of Brest Stations:
F1 28 31.1475 40 52.2189 796.00 F2001
F2 28 31.4426 40 52.0654 800.00 F2002
F3 28 31.7371 40 52.2149 810.00 F2003
F4 28 30.7976 40 52.0884 785.00 F2004
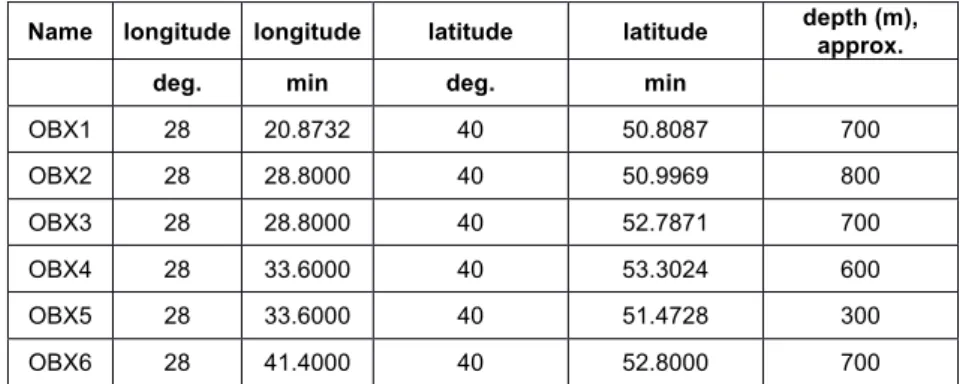
Table 2: Coordinates for the recovered OBS stations (drop positions from POS484). All stations were recovered on 13 April 2016 between 06:50 and 11:00 local time. Water depths of the OBS refer to the echosounder data and are approximate only.
Name longitude longitude latitude latitude depth (m), approx.
deg. min deg. min
OBX1 28 20.8732 40 50.8087 700
OBX2 28 28.8000 40 50.9969 800
OBX3 28 28.8000 40 52.7871 700
OBX4 28 33.6000 40 53.3024 600
OBX5 28 33.6000 40 51.4728 300
OBX6 28 41.4000 40 52.8000 700
Table 3: Drop position of the long-term near-bottom CTD mooring installed during POS497. The CTD mooring will be deployed for at least a year and, if proven useful, will be redeployed as long as the geodetic beacons are operational. Location of the CTD mooring is shown in Figure 4,
Instrument type Station Name
Tentative Recovery
date longitude latitude depth
deg. min deg min (m)
MicroCAT SBE 37 CTD1 2017 28 31.31 40 52.21 795
5.) Crew, POS 497
5.1 Ship’s crew
No. Rank Name Given name
1 Captain Von Staa Friedhelm
2 1. Off. Griese Theo
3 2. Off. Pengel Sebastian
4 Chief. Ing. Freund Hans-Jörg
5 2nd Engineer Pieper Carsten
6 Electrician Blunck Volker
7 Motorman Engel Rüdiger
8 Bosun Mischker Joachim
9 SM Meyer Felix
10 SM Meiling Ralf
11 SM Schröer Jannes
12 SM Heyne Roland
13 Seaman Von Keller Magnus
14 Cook Wieden Wilhelm
15 Steward Gerischewski Bernd
5.2 Scientific crew
1. Dietrich Lange GEOMAR Chief Scientist
2. Jean-Yves Royer CNRS & University of Brest Scientist 3. Eyyüp Özbek Directorate of Mineral Research Observer
and Exploration, Ankara
4. Nuri Karaaslan Office of Navigation, Hydrography
and Oceanography (ONHO) Observer
5. Florian Petersen GEOMAR Student
6. Anina Timmermann GEOMAR Student
6.) Acquired data
1.) 71 MB acoustic measurements from geodetic station network since installation in November 2014 (~46 MB from French Stations, ~38 MB from GEOMAR stations). All stations were running constinously. The data from station F4 could only partially downloaded from the instrument but responded to incomming requests (registered on the other stations) during the whole deployment time.
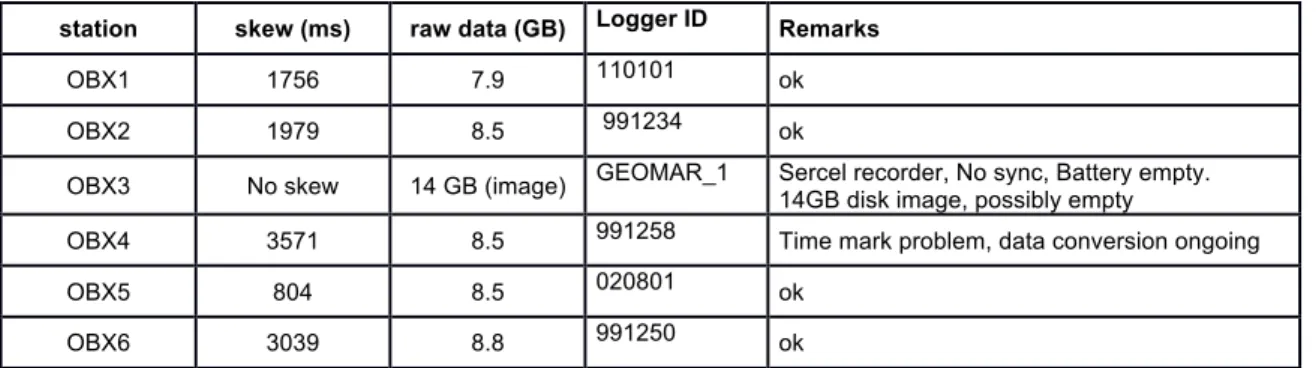
2.) Data records from 6 Ocean-Bottom seismometers (~54 GB image data). Details see Table 5.
Table 5: Details of acquired OBS data. Clock skews are positive and relative large since the skew includes a leap second (+1 s) on 30 June 2015
station skew (ms) raw data (GB) Logger ID Remarks
OBX1 1756 7.9 110101 ok
OBX2 1979 8.5 991234 ok
OBX3 No skew 14 GB (image) GEOMAR_1 Sercel recorder, No sync, Battery empty.
14GB disk image, possibly empty
OBX4 3571 8.5 991258 Time mark problem, data conversion ongoing
OBX5 804 8.5 020801 ok
OBX6 3039 8.8 991250 ok
7.) Data examples and data processing
7.1.) OBS data.
During the cruise all OBS stations could be recovered without problems. Four of the six OBS stations were running constantly since April 2015 and time could be synchronized. A detailed list of registered OBS data is listed in Table 5. OBS4 has some problems with the time marks and the data of the OBS could not be converted completely. OBS3 has a different recorder (SERCEL) and was not running after recovery due to low voltage of the battery. Visual inspection of detected events resulted in a very small amount of local seismicity. A revision of detected events suggests absence of seismicity in the close vicinity (~10 km) of the OBS network (estimated from P-S times).
7.2.) Geodetic data
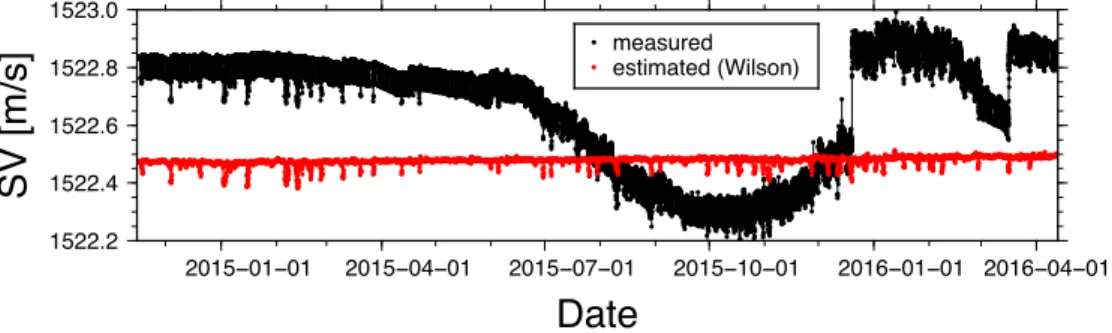
The geodetic array was installed in November 2014 and is designed to measure deformation across the NAF for up to 5 years. All instruments logged sound speed, temperature, pressure and baselines with a sample rate of 2 hours. The local sound speed sensors (located at each transponder) show a long time drift and jumps in water sound speed data. These apparent sound speed changes (Figure 7, black line) are not real and originate from a long term drift of the Valeport sensors, installed in each unit. For further processing of baselines, we therefore use the assumption of a constant salinity, together with the measured temperature (Figure 9) and pressure (Figure 8) to calculate sound speed for each baseline endpoint using the equation by Wilson (Figure 7, red line). To acquire reliable SV velocities the permanent CTD station was installed during POS497.
temperatures, interrupted with short periods of “cold water” events (Figure 9).
Figure 10 shows all baseline measurements since November 2014 for baseline 2301-2302, located on the northern side of the NAF fault trace.
We find similar repeatability (around 5 mm) for short time scales of days to weeks.
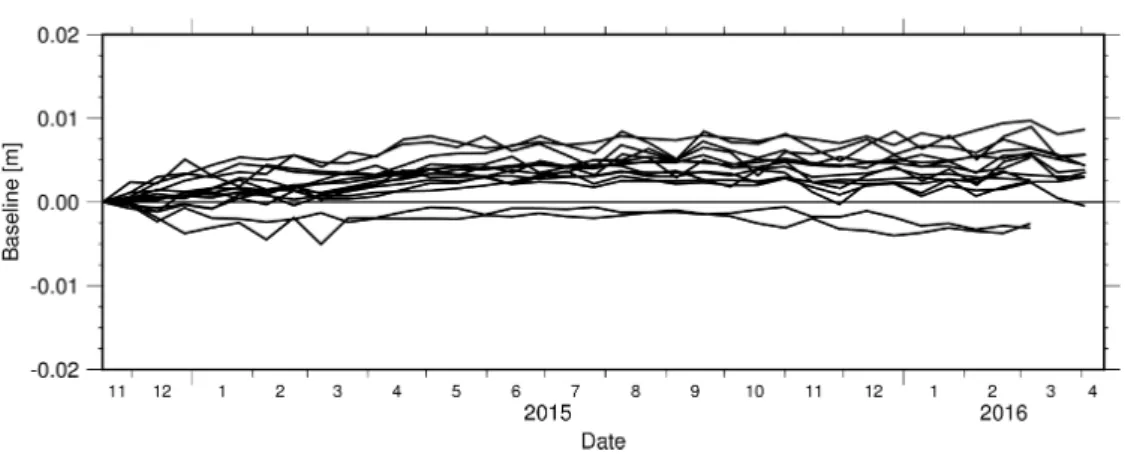
However, for the whole deployment time most baselines show the tendency of succesively increasing lengths (Figure 12) which originates from the increase of temperature during the deployment (Figure 9). The seafloor deformation of a pure strike-slip behaviour results in lengthening of half of the baselines crossing the fault should and shortening of the other half. For deformation completely localized along the fault, baselines on one side of the fault are expected not to change.
By inverting 6 months of data Sakic et al. (2016) (manuscript attached in the Appendix) find that the deformation signal (approx. 2 cm/yr) is smaller than the baseline resolution (ranging between 1.5 and 2.5 mm). The updated data of 15 months leads to the same result, which is that no deformation above the resolution of the network can be resolved. Sakic et al. (2016) conclude that little or no deformation by surface creep occurred across the fault during the period of observation. For a fault moving in steady state the accumulated signal of 15 months should be 2.5 times larger in comparison to the signal of 6 months used by Sakic et al. (2016). Therefore, the dataset of 15 months strongly supports the findings of Sakic et al. (2016) and the absence for deformation during 15 months installation supports an even higher locking degree of the fault.
Due to the capability of the geodetic network measuring for a maximal period up to 4 years (GEOMAR instruments) and 5 years (Univ. Brest instruments) the geodetic network will further provide globally unique long-term data for geodetic in-situ information along a submarine fault of high scientific value. During the POS497 cruise the batteries at each station had more than 50% capacity left allowing for such long measurement times.
Figure 7: Sound speed changes for station 2301. Black line shows the measured water sound speed from the Valeport sensors with their long- term drift and jumps, which are instrumental artefacts and the reason for the permanent CTD mooring installed during POS497. For data- processing we use the equation by Wilson to calculate local sound speed for each instrument from the measured temperatures, pressure and a constant salinity (red line). Figure prepared by F. Petersen, GEOMAR.
1522.2 1522.4 1522.6 1522.8 1523.0
SV [m/s]
2015−01−01 2015−04−01 2015−07−01 2015−10−01 2016−01−01 2016−04−01
Date
measured estimated (Wilson)
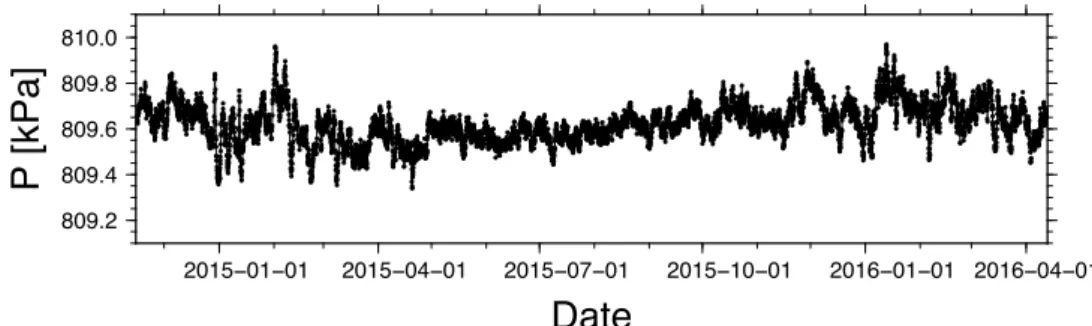
Figure 8: Measured pressure for transponder 2301. All transponders show similar pressure measurements. Figure prepared by F. Petersen, GEOMAR.
Figure 9: Timeseries of Temperature for station 2301. A small amount of averaging has been applied to smooth out the mostly quantisation noise.
It can be seen in the plots that the data suggests a long-term increase of ~0.01°C during the 15 months of deployment. Figure prepared by F.
Petersen, GEOMAR.
Figure 10: Baseline example showing the distance between station 2301 and 2302 (Figure 4). Due to the long term drift of the local sound speed sensor sound speed was calculated from pressure, temperature and a (assumed) constant salinity. The amount of measurements for a given baseline is colour coded, the mean (approx.. 60 samples each) is shown with black dots and the standard derivation with thin black lines.
Fig. prepared by K. Hannemann, GEOMAR.
809.2 809.4 809.6 809.8 810.0
P [kPa]
2015−01−01 2015−04−01 2015−07−01 2015−10−01 2016−01−01 2016−04−01
Date
14.48 14.50 14.52
T [°C]
2015−01−01 2015−04−01 2015−07−01 2015−10−01 2016−01−01 2016−04−01
Date
499.96 499.97 499.98 499.99
[m]
2015−01−01 2015−04−01 2015−07−01 2015−10−01 2016−01−01 2016−04−01
Date
3 6 9
measurements
Figure 11: Baseline G1-G2 showing the transient increase of baseline length. However, this effect is suggested to originate from the increasing temperature during the deployment (Figure 9) and not resulting from seafloor deformation. Lines show a 14-day moving average. Figure prepared by F. Petersen, GEOMAR.
Figure 12: Comparison of relative length changes of all measured baselines relative to the start of the deployment (e.g. the relative baselines start with zero length with the deployment in November 2014).
The lines represent a 14-day moving average extracted from the single baselines (e.g. Figure 10 and 11). As discussed most baselines become longer, presumably due to the steady increase of temperature (Figure 9).
Therefore only relative length changes should be interpreted. Figure prepared by F. Petersen, GEOMAR.
References:
Sakic, P., Piété, H., Ballu, V., Royer, J.-Y., Kopp, H., Lange, D., Petersen, F., Özeren, M.S., Ergintav, S., Geli, L., Henry, P., Deschamps, A., 2016. No significant steady state surface creep along the North Anatolian Fault offshore Istanbul: Results of 6 months of seafloor acoustic ranging. Geophys. Res. Lett. (43), doi:10.1002/2016GL069600.
Acknowledgments
We thank Master and crew of the RV Poseidon cruise POS497 for excellent sea-going support and a great working environment.