1. Introduction
The creation of new crust in the rear of back-rolling subduction zones is characterized by the interaction of tectonic and magmatic processes. This interaction is particularly complex during the early stages of back- arc basin formation, when extension zones are still in proximity to the volcanic arc (Martínez et al., 1995;
Tontini et al., 2019). The typical evolution of back-arc extension zones includes an early phase of rifting that is followed by a gradual development of seafloor spreading (Dunn & Martinez, 2011; Martinez & Tay- lor, 2002; Taylor et al., 1996). This gradual development is commonly inferred to extend over timescales of several thousand to million years and is associated with a steady opening of the extension zone from the active volcanic arc (Martínez et al., 1995; Tontini et al., 2019). The transitional phase is associated with fundamental changes in the processes of melting and melts supply to the back-arc extension zone (Sleeper et al., 2016). During the early evolutional phase, when the back-arc extension zone is still in proximity to the volcanic arc front, the melt supply is strongly influenced by hydrous flux melting associated with the yield of fluids from the sinking slab (Eason & Dunn, 2015; Langmuir et al., 2006; G. F. Zellmer et al., 2015).
Plate-driven mantle advection and associated decompression melting gain importance for the melt supply as the back-arc extension zone moves away from the volcanic arc front (Dunn & Martinez, 2011). Eventual- ly, fully developed seafloor spreading will set in (Eason & Dunn, 2015). The interaction of magmatism and tectonics during the early development of back-arc extension zones in the proximity to volcanic arcs is still poorly known to date and will be investigated in this study.
The Fonualei Rift and Spreading Center (FRSC) in the eastern Lau Basin is a back-arc extension zone in the rear of the active Tonga Trench subduction zone (Figure 1). The Tonga Trench is currently retreating east- wards, with respect to the Australian Plate, at rates increasing from 77 mm yr−1 near 21°S to 157 mm yr−1 near 16°S (Philips, 2003; K. Zellmer & Taylor, 2001). The FRSC represents the plate boundary between the Niuafo’ou Microplate and the Tonga Plate. A recent plate kinematic model presented by Sleeper and Martinez (2016) predicts opening rates decreasing from 32 mm yr−1 near the northern end of the FRSC to
Abstract
Spreading centers in the proximity of back-rolling subduction zones constitute an ideal natural laboratory to investigate the interaction of magmatism and tectonism during the early evolution of back-arc basins. Using 32 days of ocean bottom seismometer data, we located 697 micro-earthquakes at the southern Fonualei Rift and Spreading Center (S-FRSC). The majority of epicenters concentrate along the central region of the axial valley, marking the active ridge axis. Only odd events were associated with the prominent faults bounding the axial valley. About 450 events are spatially clustered around 17°42′S and their waveforms show a pronounced similarity. Most of these events are associated with a 138 h lasting earthquake swarm. The tectonic structure of the ridge axis in the S-FRSC resembles a series of left-stepping en echelon segments, expressed at the seafloor by numerous volcanic ridges. The recorded earthquake swarm is located at the stepover of two en echelon segments suggesting that the earthquake swarm is mainly tectonically driven. The events directly beneath our seismic network indicate a maximum depth of brittle faulting down to about 14 km below the seafloor. This is within the maximum depth range of brittle faulting at ultraslow mid-ocean ridges. Since the thickness of the brittle lithosphere is mainly controlled by temperature, our results suggest a sub-axial thermal structure similar to that of ultraslow mid-ocean ridges of similar opening rates.© 2021. The Authors.
This is an open access article under the terms of the Creative Commons Attribution License, which permits use, distribution and reproduction in any medium, provided the original work is properly cited.
Rift and Spreading Center in the Lau Basin
F. Schmid1 , M. Cremanns1,2, N. Augustin1 , D. Lange1 , F. Petersen1 , and H. Kopp1,2
1GEOMAR Helmholtz Centre for Ocean Research Kiel, Kiel, Germany, 2Institute for Geosciences, Christian-Albrechts- University of Kiel, Kiel, Germany
Key Points:
• Microseismicity is focused in the axial valley along the spreading axis and coincides with volcanic ridges and lava flows
• An earthquake swarm is located at the stepover of two en echelon segments. The swarm is mainly controlled by tectonism
• The brittle axial lithosphere is about 14 km thick, which is in agreement with mid-ocean ridges of similar spreading rates
Supporting Information:
Supporting Information may be found in the online version of this article.
Correspondence to:
F. Schmid, fschmid@geomar.de
Citation:
Schmid, F., Cremanns, M., Augustin, N., Lange, D., Petersen, F., & Kopp, H.
(2021). Microseismicity and lava flows hint at magmato-tectonic processes near the southern tip of the Fonualei Rift and spreading center in the Lau Basin. Journal of Geophysical Research:
Solid Earth, 126, e2020JB021340.
https://doi.org/10.1029/2020JB021340 Received 11 NOV 2020
Accepted 12 MAR 2021
8 mm yr−1 near the southern tip of the FRSC (Figure 1b). The FRSC started to open ∼1.5 Ma ago and is still in an early evolution phase (Sleeper & Martinez, 2016; Sleeper et al., 2016; K. Zellmer & Taylor, 2001). It represents an ideal natural laboratory to investigate the relations of magmatic and tectonic processes dur- ing the early stages of back-arc extension. Here, we present the results from a 32 days long microseismicity experiment in the southern part of the FRSC. The deployment site was motivated by the location of a re- fraction seismic profile, crossing the FRSC at 17°20′S (Schmid et al., 2020). We relate the located epicenters with the distributions of volcanic ridges and recent lava flows at the seafloor inside the FRSC to investigate the current mode of extension and melt supply.
2. Tectonic Setting of the Fonualei Rift and Spreading Center (FRSC)
Based on axial seafloor morphology the FRSC can be divided into two major parts, with the dividing bound- ary located around 17°10′S (indicated by the dashed red line in Figure 1c; Sleeper et al., 2016). This bound- ary is mainly defined by a bending and shallowing of the rift axis. Hereafter, we refer to the FRSC north of this boundary as the N-FRSC and to the FRSC south of this boundary as the S-FRSC. The N-FRSC is char- acterized by an almost continuous axial ridge, marking a neovolcanic zone that is, at least in some parts, associated with a central magnetic anomaly (Sleeper & Martinez, 2016). Across the 17°10′S boundary the axial volcanic ridge diminishes and the maximum seafloor depth inside the FRSC increases (Figure 1c). The S-FRSC is characterized by two major isolated volcanic cones (marked by the yellow 1.8 km depth contours in Figure 1c). Basaltic glasses dredged from the axial region of the S-FRSC show a geochemical signature that is almost identical to the geochemical signature of basalts recovered from the volcanoes J South, I, and H on the nearby volcanic arc (Figure 1c) (Escrig et al., 2012; Keller et al., 2008). Keller et al. (2008) postulate that the arc volcanoes J South, I and H are currently inactive, based on the presence of carbonate crusts on top of the volcanic edifices. Keller et al. (2008) and Sleeper et al. (2016) hypothesize that melt from under- neath these arc volcanoes is flowing toward the volcanic centers in the S-FRSC in the sub-crustal domain.
We indicate this melt flow with the black arrows in Figure 1c. Such a pattern of melt flow in the sub-crustal domain would supply the S-FRSC volcanic centers with a surplus of melt and cause a melt deficit in the re- gions that lie between the volcanic centers, where local depressions in the seafloor occur (Figure 1c; Sleeper et al., 2016).
Schmid et al. (2020) presented a 2D P-wave velocity (Vp) model along an east-west oriented geophysical transect crossing the S-FRSC at 17°20′S (Figure 1c). Vp versus depth profiles extracted from the 2D model indicate that the rift shoulders on both sides of the S-FRSC are of similar, volcanic arc-like, composition implying that the S-FRSC has rifted into the arc crust. Vp values of the crust inside the S-FRSC are sig- nificantly faster than in the crust constructing the rift shoulders but still slower than in typical oceanic crust, suggesting a composition that is intermediate between arc crust and typical oceanic crust (Schmid et al., 2020). Magnetic anomaly data from a profile crossing the S-FRSC at 17°20′S show a single positive peak near the center of the axial valley but no reversals inside the S-FRSC (Hannington et al., 2019; Schmid et al., 2020). Based on the seismic velocities in the S-FRSC crust, intermediate between the andesitic rift shoulders and typical oceanic crust, and the lack of geomagnetic reversals. Schmid et al. (2020) proposed that until recently the extensions processes at the S-FRSC were dominated by rifting of arc crust and fo- cused seafloor spreading was not yet active. The overarching research question addressed here is how the
Figure 1. (a) Map of the southwestern Pacific region surrounding the Lau Basin. The red rectangle represents the perimeter of (b). (b) Tectonic overview of the northern Lau Basin with plate boundaries as blue lines, volcanic centers of the Tofua Volcanic Arc plotted as red triangles and areas shallower than 1.6 km water depth shaded in gray. The red rectangle indicates the perimeter of (c). Small black crosses show epicenters of local earthquakes from Conder and Wiens (2011). A, Australian plate; N, Niuafo’ou Microplate; T, Tonga Plate; P, Pacific Plate; LETZ, Lau Extensional Transform Zone; FRSC, Fonualei Rift and Spreading Center; MTJ, Mangatolu Triple Junction. The yellow star shows the location of the Euler pole for the N-T plate boundary (FRSC) from Sleeper and Martinez (2016). (c) Bathymetry of the southern FRSC (S-FRSC). Black arrows indicate potential sub-crustal melt flow from the volcanoes on the Tofua Arc to the volcanic centers at the S-FRSC, proposed by Sleeper et al. (2016). The 2.75 km depth contours (solid red lines) highlight two depressions in the valley floor.
The 1.8 km depth contours (solid yellow lines) highlight the location of two major volcanic cones in the axial valley. White crosses are dredge locations yielding basalts or basaltic andesites from Keller et al. (2008). Dashed black lines indicate rift shoulders. The dashed red line indicates a change in the FRSC's axial morphology from a continuous volcanic ridge in the north to deep depressions and isolated volcanic cones in the south. Dashed white gives the location of a geophysical transect presented in Schmid et al. (2020). White triangles are locations of ocean bottom seismometers (OBS) recording microseismicity presented in this study.
distribution of seismic activity and magmatism vary along the axis of the southwards propagating S-FRSC and how they interact.
Conder and Wiens (2011) presented a catalog of regional-scale seismicity in the Lau Basin, based on a 3-month long deployment of ocean bottom seismometer (OBS). However, the seismicity catalog of Conder and Wiens (2011) suffers from a sparse distribution of stations in the FRSC region and hypocenter depths are poorly constrained since depth uncertainties are larger than 10 km, hampering a detailed geological interpretation of the events inside the FRSC and motivating us to conduct a local deployment of OBS′ in late 2018 (Figure 1).
3. Data and Methods
3.1. Ocean Bottom Seismological Experiment at the FRSC
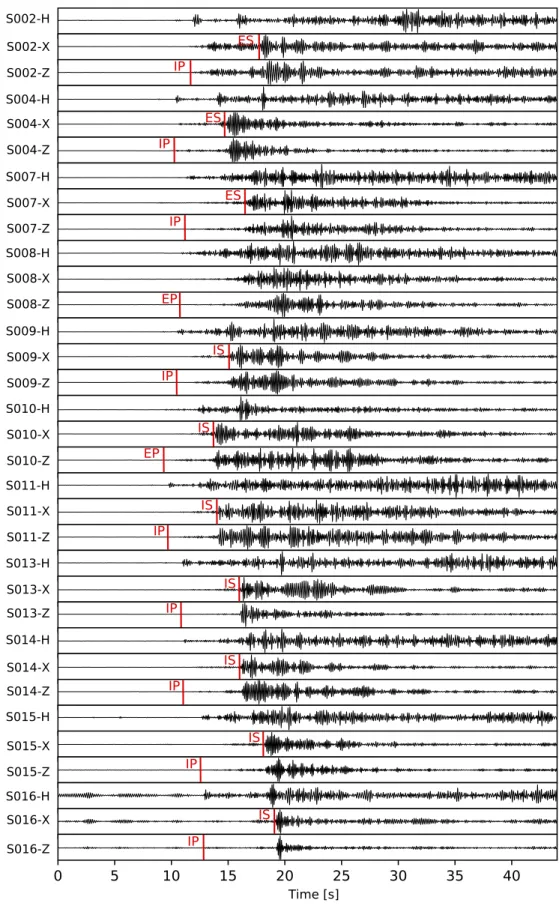
We deployed a network of 15 OBS at the S-FRSC from the 19th of December 2018 to the 20th of January 2019 during expedition SO276 of RV Sonne (Figure 1c; Hannington et al., 2019). Placing the OBS nearby to the refraction seismic profile has the advantage of robust velocity-depth information, which is important in the earthquake location process to achieve stable results. Apart from the scattered local earthquakes re- corded by Conder and Wiens (2011) there was no further a priori knowledge about microseismicity at the FRSC, to guide the OBS network deployment. Each OBS was equipped with a three-component short-peri- od geophone of 4.5 Hz corner frequency and a HiTech Inc. hydrophone. The OBS recorded continuous data at a sample rate of 250 Hz. We used a short-term-average versus long-term-average trigger to detect seismic events in the continuous seismograms. Trigger settings are provided in the supporting information. We manually picked the onsets of P and S phase arrivals after applying a 3–15 Hz bandpass filter to the wave- forms. Waveforms of a typical local event recorded by the network are shown in Figure 2. P-phase onsets were mostly picked on the hydrophone channel where they are clearest and picked on the vertical channel otherwise. S-phase onsets were picked on either one of the horizontal channels. The picking uncertainties were estimated by picking the arrivals a second time for the first 50 events in our data set on unfiltered waveforms and then calculating the average time difference of individual picks resulting from filtered and unfiltered seismograms. Picking uncertainties range between 0.06–0.12 s for P phases and 0.08–0.15 s for S phases. The largest picking uncertainties were later included in the hypocenter location process. The data processing, picking, and database management was performed with the SEISAN software of Havskov and Ottemoeller (1999).
3.2. Hypocenter Location and Determination of Magnitudes
We used the non-linear location software NonLinLoc (Lomax et al., 2000) which includes an efficient Oct- tree grid-search algorithm (Lomax & Curtis, 2001) for the location of hypocenters.
Due to the strong topography and heterogeneity in the subsurface below the OBS network, station cor- rection terms are essential to achieve robust location results. In areas of pre-dominant 2D structure (such as subduction zones or mid-ocean ridges) a 1D velocity model with station corrections represents a good approximation of the 3D structure (Kissling, 1988). To estimate the station correction terms, we performed a repeated location of selected events with a GAP (=largest azimuth range with no observations) smaller than 200° and include more than 16 phase onset picks. This subset of events was located several times. Af- ter each iteration the average travel-time residuals for each station and phase were calculated and used as station correction terms for the consecutive iteration. After six iterations the average residuals did no longer decrease significantly in comparison to the previous iteration. The average phase residuals after the sixth iteration were then used as station correction terms in the hypocenter location of the entire microseismicity data set. Absolute values of station correction terms are provided in Table S2. The 1D velocity model used for event location was extracted from a west-east oriented 2D refraction seismic profile crossing our OBS network at 17°20′S (Schmid et al., 2020; profile location is shown in Figure 1c). The 1D velocity model was constructed by horizontally averaging the velocities from the 2D seismic profile (see Figure S1 for more details). The 1D velocity model includes a Moho interface at 7 km depth below the seafloor. To assess the quality of the 1D velocity model, we compared the location results for three different velocity models representing the average model minus and plus the Vp uncertainty yielded by the 2D tomography model.
Figure 2. Seismograms of a local earthquake in the S-FRSC region recorded by the OBS network. All traces are bandpass filtered at 3–15 Hz. IP, impulsive P-wave onset; EP, emergent P-wave onset; IS, impulsive S-wave onset; H, hydrophone channel; Z, vertical seismometer channel; X, one of the two horizontal seismometer channels.
We provide the results of this comparison in Table S3 and show that the average model (used for the final location of events) returns the smallest mean RMS and smallest mean lengths axes in the confidence ellipsoids.
We used the hydrophone channels to determine magnitudes, following the approach of Tilmann et al. (2008). After removing the instrument response from raw data it was multiplied with the sound velocity of 1.5 km s−1 and with the density of water, 1,030 kg m−3. The output signal represents an approximation of vertical displacement at the seafloor for a vertically arriving phase with a negligible impedance contrast at the sediment water interface. This approximation is justified by the observa- tion that surficial sediments are highly water saturated and the recorded earthquake phases (P and S) typically arrival with near-vertical angles at the OBS stations. The advantage of using the hydrophone channel instead of the short-period seismometer data is the higher sensitivity at frequencies lower than 4.5 Hz. In particular stronger events carry signif- icant energy at frequencies <1.0 Hz. We used the displacement spectra of the micro-earthquake phase arrivals to calculate moment magnitudes, ranging between 0.5 and 5.3 Mw. For this task, we closely followed the methodology described in Ottemöller and Havskov (2003). This method iteratively searches for an optimal combination of the seismic moment and corner frequency to fit the displacement signal spectrum. The dis- placement signal spectrum is calculated for a 80 s long window that in- cludes the S-phase onset. Two earthquakes in our catalog are also includ- ed in the bulletin of the International Seismological Center (ISC; www.
isc.ac.uk). We compared our moment magnitudes with the moment mag- nitudes in the ISC bulletin. Our magnitudes deviate by 0.1 units from the values in the ISC bulletin (Figure S7).
3.3. Cross-Correlation of Phase Onsets and Double Difference Locations
Our NonLinLoc location results indicate a substantial spatial and temporal clustering of the micro-earth- quakes, see Sections 4.1 and 4.2. This motivated us to perform a cross-correlation of P and S phase onset waveforms for all possible event pairs. The resulting plot of correlation coefficients (Figure 3) showed that for a large number of event pairs the correlation coefficient exceeds 0.85. Figure S2 shows an example of very similar waveforms recorded at station S010 that stem from four local events, occurring south of the network in close spatial proximity and within a time window of 4 h on the 8th of January 2019. The iden- tified similarity in the phase onset waveforms suggests that these events are physically related. For event pairs with a correlation coefficient higher than 0.85 we used differential travel-times based on the peak in the correlation function. We used the differential travel-times as input information for a relative location of the physically related events. We used the HYPODD double-difference location software of Waldhauser and Ellsworth (2000) to relocate events in the southern cluster. The input information used for the relocation procedure with HYPODD included differential travel-times calculated from the catalog of picked P and S phase arrivals and differential travel-times calculated from cross-correlation of waveforms for P and S phases. In the relative location process with HYPODD, we used the same 1D velocity model as in the initial location run with HYPODD.
3.4. Determination of Focal Mechanisms
Focal mechanisms reveal information about the local stress field in the lithosphere, motivating us to deter- mine best-fitting double-couple source mechanisms. Non double-couple focal mechanisms were not con- sidered. The determination of robust focal mechanism solutions is limited to events with a GAP smaller than 180° and clear P phase onsets at more than eight stations. We used first motion polarities of P phase onsets as input information to compute best-fitting double couple focal mechanisms with three different software tools. These tools included the FOCMEC software (Snoke et al., 1984), the FPFIT software (Reasen- Figure 3. Plot of average cross-correlation coefficients after correlating
the P and S phase onset waveforms of all possible event pairs. An increase in the correlation coefficient on the 7th of January is associated with the onset of swarm activity in the southern cluster. The cross-correlation was performed for 4 s window around the phase onsets, separately for P and S phases. Waveforms were 3–15 Hz bandpass filtered prior to cross-correlation.
berg & Oppenheimer, 1985) and the PINV software (Suetsugu, 1998). We compared the best-fitting dou- ble-couple solutions from all three tools and only retained events where all three solutions show a deviation in the strike, dip and rake values of less than five degrees.
3.5. Acoustic Backscatter Mapping
For the identification of recent volcanic activity in the neovolcanic zone of mid-ocean ridges (MOR) we can use geomorphological aspects (geometry and appearance of volcanoes in bathymetry) as well as multi- beam-backscatter data because relatively sediment-free, rough lava flows yield a strong backscatter signal often associated with a sharp termination against the surrounding areas (Augustin et al., 2016). The backs- catter signal was derived from the Kongsberg EM122 multibeam raw-files and geometrically corrected and mosaiced with the FMGeocoder software. Gaps in the backscatter data, caused by the lack of raw-multi- beam data, were interpolated based on the available information combined with the interpretation of sea- floor features. A map with the extent of backscatter data is provided in Figure S6. We manually mapped two different types of seafloor features, on the basis of available shipboard multibeam bathymetry. We created slope maps to highlight linear structures. The first feature type represents volcanic ridges, which are char- acterized by an elongated elevation at the seafloor and increased backscatter intensity. Such volcanic ridges are most abundant at the bottom of the axial valley. The second feature type represents fault scarps, which are typically characterized by steps in the morphology.
4. Results
4.1. Spatial Distribution of Microseismicity
Our final microseismicity catalog spans a period of 32 days and includes 711 local events. All events with less than two S-phase readings were excluded from the final catalog, since such event locations which are merely based on P-phase readings tend to have unstable hypocenter locations (Gomberg et al., 1990). A map including all events, regardless of location uncertainty, is provided in Figure S3. Since we focus on the seismic and tectonic activity in the lithosphere of the upper plate we reject all events that are deeper than 40 km below sea level and related to the subducting Pacific Plate. After rejecting all events deeper than 40 km below sea level our final catalog still contained 697 events.
We introduce three selection criteria in order to make the location uncertainties accessible to the reader and to omit events with spurious locations. The selection criteria include the root mean square misfit of theoret- ical and observed travel-times (RMS), the distance between the expectation hypocenter and the maximum likelihood hypocenter (DIFF) and the vertical location error (Verr), listed in Table 1. We formulate three quality classes A to C corresponding to different thresholds of the three-abovementioned selection criteria.
An event has to fulfill all three criteria to become a member of a class. If one of the three criteria is violated the event is downgraded to a lower class. A similar approach of grouping NonLinLoc location results into different quality classes was previously used by Husen and Smith (2004).
Defining parameters of quality classes Statistics of quality classes Quality
class RMS
[s] DIFF
[km] Verr [km] No
events Mean number of
defining phases Mean
RMS [s] Mean DIFF
[km] Mean
Verr [km]
Mean Herr
[km]
A <0.2 <3 <4 70 10.0 0.11 0.7 2.5 1.2
B 0.2–0.5 3–5 4–7 267 14.1 0.18 2.5 4.8 1.5
C >0.5 >5 >7 374 12.1 0.19 8.3 6.6 2.1
Note. RMS, root mean square misfit of theoretical and observed travel-times; DIFF, distance between the expectation hypocenter and the maximum likelihood hypocenter; Verr, vertical location error; Herr, horizontal location error. Note that all class C events were excluded from the interpretation of location results.
Table 1
Summary of Location Uncertainty Criteria Thresholds Used to Sort the Location Results Into Three Quality Classes (A–C) and Average Statistical Parameters Events in These Classes
For class A events, we consider the epicenter location and hypocenter depth as trustworthy and robust for interpretation. For class B events, the epicenter location is trustworthy but the estimated focal depth is not trustworthy as the depth uncertainty in many cases exceeds 5 km. The location and focal depths of class C events were rejected from the interpretation since the event locations are associated with significant uncertainties. Figure 4a shows the final selection of location results for quality classes A and B and Fig- ure 4b shows the HYPODD relocation results together with the NonLinLoc results of events that were not relocated.
The majority of events in our catalog are located outside the OBS network. Most of these events are asso- ciated with an event-cluster in the south (between 17°36′S and 17°48′S) with magnitudes of 1.0–5.3 Mw, which we will refer to as the southern cluster. While the geometry of sources and receivers is not ideal in the southern cluster, the epicenter location results can still be regarded as robust and trustworthy, support- ed by the following considerations. Average horizontal location uncertainties reveal a moderate difference Figure 4. Overview of microseismicity location results. (a) Map with NonLinLoc located epicenters. Blue beach balls represent focal mechanisms from this study. Black beach balls represent centroid moment tensors from the global CMT catalog of Ekström et al. (2012) between 2005 and 2016. The size of the beach balls does not correspond to magnitude. Global CMT catalog events have magnitudes larger than 5.0 while blue beach balls correspond to events weaker than magnitude 3.0. (b) Same map as (a) but with HYPODD relocated epicenters in green. For events that could not be relocated, the NonLinLoc result is plotted.
Note, no event is plotted twice. Relocated solution has been removed from the NonLinLoc results in this panel. Dashed black lines indicate the locations of cross-sections in panels (c and d). (c) South-north section crossing the FRSC valley at 17°20′S, in the center of the OBS network. All events closer than 5 km from the section are projected. Gray bars indicate depth uncertainties. The solid green line indicates the depth of the Moho interface from the refraction seismic model of Schmid et al. (2020). Dashed red lines show anticipated major boundary faults. (d) West-east oriented section along the center of the S-FRSC with all events projected that are closer than 5 km from the section. Symbols are identical with panel (b) Note the vertical gap in the hypocenter distribution in the southern cluster of events between 11 and 14 km is below sea level. This gap is likely an artifact introduced by the large azimuthal station gap at this site and the step in the 1D velocity model at the Moho interface.
between events in the southern cluster (1.42 km) and events below the OBS network (0.96 km). A map with horizontal location uncertainties is provided in Figure S4. On the contrary, average vertical location uncer- tainties increase from 1.42 km for events below the network to 5.02 km for events in the southern cluster.
The comparably small horizontal location uncertainties in the southern cluster are associated with a gener- ally higher number of defining phases of these events, indicated by the larger number of defining phases for class B than for class A (Table 1). This discrepancy in the number of defining phases is further illustrated in Figure S5 showing the numbers of defining phases for individual events. The increased number of defining phases in the southern cluster coincides with numerous events of magnitudes larger Mw = 2.5 yielding clear phase onsets with a high signal-to-noise ratios at most of the stations.
A large number of events in the southern cluster returned cross-correlation coefficients of 0.85 or higher (Figure 3) allowing the calculation of differential travel-times for the relevant event pairs. The relocation of events in the southern cluster, based on these differential travel-times, slightly pulled the epicenters in the southern cluster together but did not cause a significant change to the location and extent of this cluster.
The most notable changes after relocation were associated with the vertical distribution of hypocenters. The NonLinLoc results show a bimodal distribution of hypocenter depths in the southern cluster (Figure 4c), which is likely caused by the 1D velocity model used for the location process. The 1D velocity model in- cludes a step in the P-wave velocity near the Moho reflector at 7 km depth below the seafloor. This coincides with the vertical gap in the hypocenter distribution (Figure 4c). We assume that this vertical gap in the NonLinLoc location results represents an artifact introduced by the 1D velocity model and the unfavorable geometry of sources and receivers. Therefore, we refrain from interpreting the NonLinLoc focal depths in the southern cluster. However, we point out that all hypocenters relocated with HYPODD concentrate be- tween the seafloor and 6 km depth below the seafloor (Figure 4c). This indicates that most of the seismicity associated with the southern cluster occurred in the crust.
Generally, focal mechanisms of micro-earthquakes below our OBS network yield normal faulting solutions or solutions with a strong normal faulting component (Figure 4a). Similarly, focal mechanism of teleseismic events from the global centroid-moment-tensors catalog (Ekström et al., 2012), near the southern tip of the FRSC, show exclusively normal faulting mechanisms (Baxter et al., 2020).
4.2. Temporal Distribution of Microseismicity and Identification of an Earthquake Swarm Figure 5 illustrates the temporal distribution of earthquakes. Between December 19, 2018 and January 7, 2019 the event rate remains within 0–10 events per 6 h. Then, a period of increased seismicity started on January 7, 2019, that lasted ∼138 h (5.75 days). Around 450 events (with magnitudes of 1.0–5.3 Mw) were recorded during this period resulting in event rates up to 42 events per 6 h. The majority of events in this period were part of the southern cluster (Figure 5c). The strongest increase in the event rate is observed on January 8, 2019 around 3 p.m. and, coincides with the strongest event in the cluster (Mw = 5.3, marked by a red star in Figures 5b and 5c) in the center of the southern cluster. The cross-correlation of waveforms showed that a majority of the events within the period January 7th–13th show strong similarity in their waveforms (event numbers 220–670 in Figure 3, with cross-correlation coefficients larger than 0.8), suggest- ing a similar source mechanism of the events (Deichmann & Garcia-Fernandez, 1992).
4.3. Distribution of Volcanic Ridges and Recent Lava Flows Inside the S-FRSC
In general, we observe that the distribution of lava flows narrows toward the southern end of the FRSC, as the FRSC itself (Figure 6c). The largest and widest area of recent lava is visible north of the central volcano at about 17°33′S. Even though the largest gap in the backscatter data set occurs in this region, it is reasona- ble to assume that the two large areas of bright backscatter are connected due to numerous uneroded, fresh looking axial volcanoes in this area (Figures 6 and S6). Toward the southern end of the rift the bright backs- catter areas become smaller and more scattered. However, the overall estimation of volcanic activity solely based on the backscatter map likely underestimates the total volcanic activity in this area. Some of the axial volcanic cones do not yield the same strong backscatter response as the lava flows but look uneroded and rather young in the bathymetry data. The reason for this lower backscatter reflectivity can be slope effects
but also the presence of loose, vesicular material like scoria, pumice and ashes (e.g., Keller et al., 2008). Such rocks attenuate the acoustic signal due to their higher porosity resulting in a lower backscatter response.
The area of the local seafloor depression between 17°45′S and 17°38′S is occupied by several volcanic ridges striking in south-north direction, most of which are associated with high backscatter intensity, which is indicative for fresh lava flows. These volcanic ridges roughly coincide with the location of the southern earthquake cluster (Figure 6).
5. Discussion
5.1. Origin of the Recorded Earthquake Swarm
Earthquake swarms are typically characterized as a sequence of events in which the number and magni- tude gradually increase with time and decrease after a certain period (Mogi, 1963). The spatial (Figure 7) and temporal (Figure 5) clustering of events in the southern cluster as well as their increased similarity of Figure 5. Temporal evolution of recorded seismicity. (a) Blue bars show the number of events per 6 h bin. The red curve shows the cumulative number of events. (b) Temporal distribution of moment magnitudes. Red stars in panels (b and d) show the strongest event in the swarm (MW = 5.3) which coincides with the strong increase in the event rate. (c) Magnitude frequency distribution of the entire data set. (d) Time versus latitude distribution of epicenters. The swarm activity in the southern cluster (around 17°42′S) can be occurred between 2019/01/07 and 2019/01/13. We excluded all events that occurred deeper than 40 km or outside the region shown in Figure 4a.
waveforms after cross-correlation (Figure 3) impart that we captured an earthquake swarm. The distribu- tion of event numbers and magnitudes could not be fitted with the Omori law (Utsu et al., 1995), speaking against a mainshock-aftershock sequence. The map of HYPODD relocated epicenters and time versus lati- tude/longitude distribution of swarm events suggests the presence of two subclusters I and II in the swarm (Figure 7). Subcluster I is located in the south and includes the first events of the swarm. Events within sub- cluster I show a migration from south to northwest (Figure 7b). Subcluster II is located north of subcluster I and includes the majority of swarm events (Figure 7b). The large vertical location uncertainty of events in the southern cluster (on average 5 km) prevented the analysis of vertical migration patterns.
We identified two faults on the seafloor, near the western limit of the swarm area, close to the western valley wall of the S-FRSC (Figure 7a). Major parts of the seafloor in the swarm area are covered by south-north striking volcanic ridges (Figure 7a). The distribution of volcanic ridges in the S-FRSC reveals four left-step- ping en echelon magmatic segments indicated by heavy dashed lines in Figure 8b. Noteworthy is the lo- cation of the southern earthquake cluster at the step over between two en echelon segments (Figure 8b).
The LETZ is constructed of several left-stepping en echelon segments as well (Sleeper & Martinez, 2016).
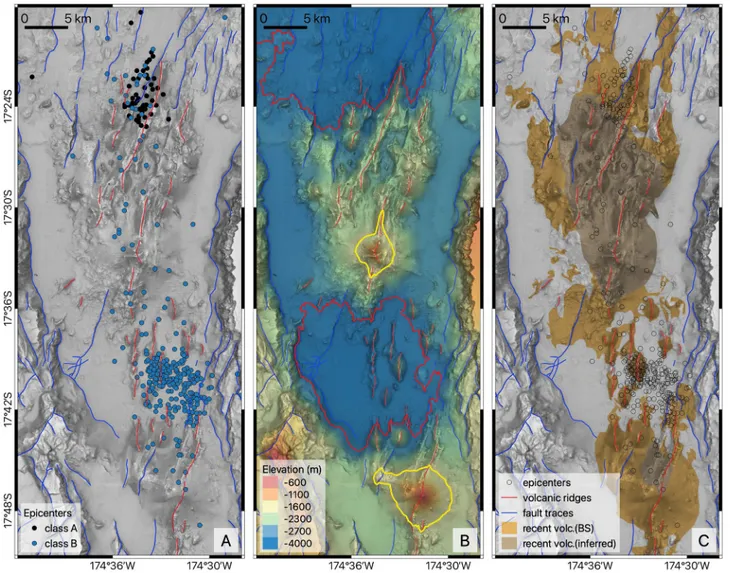
Figure 6. Distribution of microseismicity, elongated volcanic features and recent lava flows at the seafloor inside the S-FRSC. (a) Shaded bathymetry with red lines highlighting the crests of volcanic ridges. Epicenters of earthquakes are indicated by circles and color-coded according to quality classes. (b) Color-coded bathymetry. The 2.75 km depth contour (solid red line) indicates two local depressions on the valley floor. The 1.8 km depth contour (solid yellow line) indicates two major volcanic cones in the axial valley. (c) Shaded bathymetry with recent lava flows mapped based on backscatter intensity detected by multibeam echosounder data. We show examples of backscatter data in Figures 7a, 9a, and S6. Shading in all three panels was enhanced with the terrain-texture shader (Anderson et al., 2016).
Conder and Wiens (2011) and Eguchi et al. (1989) found numerous swarms of micro-earthquakes along the LETZ with a typical duration of less than 24 h. Those swarms are considered as being related to tectonic activity at the en echelon segments along the LETZ. Accordingly, the S-FRSC and the LETZ share some similarities in their tectonic structure and microseismicity patterns. However, en echelon segments along the LETZ have a larger overlap than those at the S-FRSC (Figure 8c). Also, the deviation of the spreading direction from the orthogonal of the ridge axis is larger at the LETZ than at the S-FRSC, resulting in a higher level of tectonic complexity at the LETZ. This is supported by the frequent occurrence of strike-slip focal mechanisms along the LETZ (Baxter et al., 2020). No strike slip events have been identified along the S-FRSC. If we consider a purely tectonic origin of the recorded earthquake swarm, the initial sequence of events in subcluster I may have triggered the earthquakes in subcluster II (Figure 7). The complex migration pattern of epicenters in subcluster II may likewise result from sequential triggering of nearby faults. What supports such a scenario is the evolution of magnitudes over time during the swarm period (Figure 5). The swarm begins with Mw ≤ 2.5 events in subcluster I, followed by the strongest events in the swarm (ranging Figure 7. Spatiotemporal distribution of HYPODD relocated earthquakes in the southern cluster between 2019 January 7th and 12th. (a) Map of backscatter intensity (bright = high intensity, dark = low intensity) with epicenters color coded according to time after the swarm onset. Black crosses show the relative location uncertainties of individual events. The location of this map is indicated in Figures 4a and 4b, Hill shading map with epicenters and symbols equal to panel (a) Dashed lines indicate extent of identified subclusters I and II. (c) Plot of time versus latitude for all events plotted in panel (a). Colors indicate the time in hours after swarm onset. Crosses show latitudinal location uncertainty of individual events. (d) Plot of longitude versus time. Symbols and events are the same as in panels (a and b). Black arrows in panels (a–c) indicate identified migration pattern of seismicity. Possible relations of swarm events to tectonism.
between Mw = 3.5–5.3 Mw) in subcluster II (Figure 7). Subsequently, the magnitudes become smaller than Mw = 3.0 again. The strongest event of the entire swarm (Mw = 5.3) marks the onset of seismicity in sub- cluster II (Figure 7).
5.1.1. Possible Relations of Swarm Events to Magmatism
Earthquake swarms of similar characteristics were previously recorded at active MOR (Dziak, 2004; Tan et al., 2016; Tolstoy et al., 2006) and in continental rifting zones (Belachew et al., 2011; Illsley-Kemp et al., 2018; Key et al., 2011; Wright et al., 2012) and have been attributed to magma movement (dike intru- sions) in the crust. The Red Sea Rift in Ethiopia, which is regarded as a nascent oceanic rift (Ayele et al., 2009), is one of the sites where dike intrusions and associated earthquake swarms have been investigated in detail.
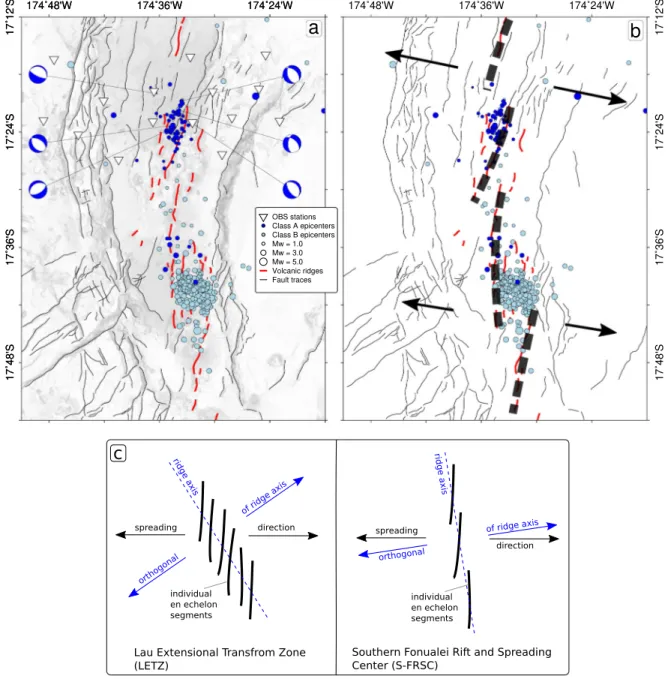
Figure 8. (a) Tectonic map of the S-FRSC with identified fault traces and volcanic ridges. Background shading represents topographic slope of the seafloor.
NonLinLoc located epicenters (classes A + B) are plotted as blue dots. (b) The same map as (a) with heavy dashed lines highlighting the location of four left-stepping en echelon magmatic segments and arrows indicating the opening direction of the S-FRSC. Note that the southern event cluster is located at the stepover between two en echelon segments. (c) Comparison of tectonic fabric at the LETZ (Figure 1) and S-FRSC, both of which include en echelon magmatic segments.
There, dike intrusions lasted between 12 and 140 h (Belachew et al., 2011) and dike intrusions at the East Pacific Rise lasted between 1 and 170 h (Dziak et al., 2009), which is a similar duration as the seismic swarm we observed. The magnitude versus time distribution in several earthquake swarms related to dike intrusions in the Red Sea Rift, Ethiopia, indicated that small-magnitude events, associated with the dike tip are followed by the largest magnitude events in the swarm (Belachew et al., 2011). The swarm in the southern event cluster begins on 7 January with Mw ≤ 2.5 events and commences after 8 January with the strongest event in the swarm of Mw = 5.3 (Figures 5b and 7c). Typically, earthquake swarms associated with dike intrusions show a migration pattern. The HYPODD relocation solutions, with their improved relative location accuracy, allow the inspection of horizontal epicenter migration (Figure 7). During the first 48 h of the swarm (7th and 8th of January) a migration of epicenters from south toward north-east is present in subcluster I (Figure 7a). After that, no clear migration trend is visible speaking against a relation of the swarm seismicity to diking in the crust.
However, the proximity of the swarm earthquakes with several volcanic ridges of 0.5–4.5 km length and 0.1–0.6 km height (Figure 7a) suggests that this area has been magmatically active in the past. These volcan- ic ridges show increased acoustic backscatter indicating they are young volcanic features, although detailed knowledge about their absolute age is missing. A similar coincidence of swarm seismicity with volcanic structures at the surface has been found in a number of active rifts and spreading centers. For example, in the Hengill volcanic area in Iceland seismic swarms occurred near the base of the seismogenic zone (Feigl et al., 2000). Related calculations of Coulomb failure stress suggest that the injection of magma at ∼7 km depth triggered the swarm activity in the overlying crust (Feigl et al., 2000). An experiment in the Main Ethiopian rift found that microseismicity is concentrated along left-stepping en echelon magmatic segments and seismic swarms are considered to be triggered by melt injection in the lower crust (Keir et al., 2006). We conclude that the recorded earthquake swarm was not associated with active diking in the crust but appears tectonically controlled by the ridge axis tectonic structure of left-stepping en echelon segments.
In addition to tectonic and magmatic activity, fluids can play a significant role in the triggering of earthquake swarms as has been demonstrated in several cases (De Barros et al., 2019; Hainzl, 2004; Shelly et al., 2013).
We cannot fully rule out the influence of fluids in triggering the recorded earthquake swarm. However, we have no additional constraints, for example porosity and permeability measurements of the faulted rocks, to adequately discuss the role of fluids here.
5.2. Relations of Microseismicity Below the OBS Network to Volcanic Structures and Faults at the Seafloor
Due to the small azimuthal gap in station coverage and the proximity to the seismic refraction profile yield- ing the velocity model for hypocenter location, the location uncertainties below the network are compa- rably small (class A events in Table 1). The relatively short event-to-station distances also results in a low magnitude of completeness (Mc ∼ 0.8 Mw). Figure 9 shows the distribution of micro-earthquakes, lava flows and volcanic ridges below the OBS network. The event distribution reveals an ∼4 km wide zone of seismic activity in the axial valley. This zone is overlain by several volcanic ridges (highlighted by red lines in Fig- ure 9a) and extensive flows of high backscatter intensity. All estimated fault plane solutions indicate normal faulting (Figure 9a). The strike directions in five out of six fault plane solutions show a SSE-NNW orienta- tion but the nearby volcanic ridges and surface fault scarps show a SSE-NNW strike direction (Figure 9a).
We can only speculate about the cause of this discrepancy in strike direction. The hypocenters are located at 5–14 km depth and may not necessarily relate to surface fault traces. The larger scale axial segmentation suggests that this area is located in at the stepover of two en echelon magmatic segments (Figure 8b). The mismatch in strike directions of focal mechanisms and fault traces could possibly reflect the tectonics of this stepover region. We anticipate that the events below the network represent tectonic background seismicity along the ridge axis, supported by a constant event rate of ∼1 event per 6 h during our experiment.
5.3. Thickness of the Brittle Axial Lithosphere in Comparison to Active Mid-Ocean Ridges The thickness of the brittle lithosphere has a profound impact on the mechanical strength and tectonic deformation in extension zones. Typically, the thickness of the brittle lithosphere is considered to coincide
with the maximum depth of micro-earthquake foci (Déverchère et al., 2001). Grevemeyer et al. (2019) pre- sented a compilation of maximum focal depths versus the spreading rate along the global MOR system. The maximum depth of faulting decreases with increasing spreading rates, a relation which was previously sug- gested by Chen and Molnar (1983). This relation is mainly attributed to systematic thermal variations in the lithosphere at MOR (Chen & Molnar, 1983; Grevemeyer et al., 2019). At the S-FRSC the hypocenter depths are best constrained for class A events below the OBS network where the spreading rate approximates 12 mm yr−1 (Sleeper & Martinez, 2016). Our results indicate brittle faulting down to about 14 km below the seafloor in the region of the OBS network (Figures 9b and 9c). The global compilation of Grevemeyer et al. (2019) indicates a maximum depth of brittle faulting to 11 km below the seafloor for ridges spreading at 12 mm yr−1. A recent, 1-year long segment-scale microseismicity study at the ultraslow Knipovich Ridge indicated that the brittle-ductile transition shows considerable variation, between 12 and 18 km, along Figure 9. Spatial distribution of NonLinLoc located earthquakes and seafloor backscatter intensity in the axial valley below the OBS network. (a) Map of backscatter intensity (bright = high intensity, dark = low intensity) with interpreted lava flows enclosed by orange polygons. No backscatter data is available for the white patch near the lower left map corner. Thin black lines represent depth contours at 50 m intervals. Dashed green lines highlight major volcanic features at the seafloor. Blue circles show epicenters, scaling with magnitude. The location of this map is indicated in Figures 4a and 4b, south-north cross-section with projected hypocenters and depth uncertainties indicated by gray bars. Dashed black line shows the inferred depth of the brittle-ductile transition. (c) West-east cross-section with projected hypocenters and depth uncertainties. Dashed black lines show the locations of anticipated faults. Other symbols are identical to panel (b).
160 km of the ridge axis (Meier et al., 2021). The S-FRSC reveals a similar magmatic segmentation as the Knipovich Ridge (Section 5.4) suggestion that the brittle-ductile transition depth may not be constant along the S-FRSC. In this light, the identified value of 14 km may not be valid for the entire S-FRSC and the region where we have robust focal depths covers merely 12 km of the ridge axis (Figure 9). The maximum depth of brittle faulting is mainly controlled by temperature and is typically considered to locate around the 650°C isotherm (McKenzie et al., 2005). We conclude that thickness of the brittle lithosphere at the S-FRSC is within the observed thickness range of this layer at ultraslow MOR, implying that the thermal structure at the ridge axis is also comparable to ultraslow MOR.
5.4. Similarity in the Microseismicity Distribution With Ultraslow MOR
To explore any similarities of the S-FRSC with MOR systems and to put our findings in a broader context, we compare the seismicity distribution at the S-FRSC with the eastern part of the Southwest Indian Ridge (SWIR) and the Knipovich Ridge (KR). The anticipated opening rates of 8–12 mm yr−1 at the S-FRSC (Sleep- er & Martinez, 2016) are similar to the opening rates of the SWIR and KR (DeMets et al., 2010). Both, the easternmost portion of the SWIR and KR exhibit an along-axis segmentation of isolated volcanic centers and intermediate regions receiving less mantle melt (Cannat et al., 2008) which is in some parts similar to the S-FRSC. Microseismicity surveys at the easternmost SWIR and KR showed that micro-earthquakes are most frequent under the axial rift valley where they form spatial clusters, some of which include seismic swarms (Katsumata et al., 2001; Meier et al., 2021; Schlindwein & Schmid, 2016; Schmid et al., 2017). The micro-earthquake distribution at the easternmost SWIR as well as along the KR is strongly related to the magmatic segmentation of the ridges. While the lithosphere underneath axial volcanoes produces less fre- quent seismicity, the adjacent and less magmatic areas show more frequent seismic activity down to larger depths (Meier et al., 2021; Schmid et al., 2017). The frequent of occurrence of earthquakes implies elevated temperatures in the lithosphere underneath the volcanic centers, reducing the occurrence of brittle failure (Meier et al., 2021; Schmid et al., 2017). A similar but less pronounced pattern in the seismicity distribution along the ridge axis was identified at the S-FRSC axial valley (Figures 10a and 10b). Only sparse earthquake foci are present underneath the volcanic center near 17°33′S. In comparison, more frequent seismicity is present in the segments immediately north and south of the 17°33′S volcanic center. This pattern in the along axis rate of micro-earthquakes supports a potential similarity of the S-FRSC with ultraslow spreading MOR. Such a similarity in the S-FRSC segmentation with ultraslow MOR was previously postulated by Sleeper et al. (2016). However, our seismicity catalog spans only 32 days and may therefore not provide an exhaustive representation of the microseismicity at the S-FRSC. The earthquake swarm may bias the picture and it is adequate to elaborate the networks capability to detect background seismicity in the area around the 17°33′S volcanic center. Figure 5c shows that odd events as far as 17°46′S in the period before the swarm were recorded, suggesting that our network is actually capable of detecting background seismic- ity at the 17°33′S volcanic center.
It should be noted that ultraslow MOR shows a much larger variety in axial environments than the S-FRSC.
Detachment bearing segments where mantle rocks are exposed to the seafloor and the magma-budget is strongly reduced are also found at the easternmost SWIR. They locate in-between segments of typical mag- matic crustal generation (Cannat et al., 2006, 2019). The S-FRSC does not reveal any signs of detachment faulting, which is typically associated with core complexes that can easily be identified in shipboard ba- thymetry data (Escartín et al., 2017). The available rocks sampling at the S-FRSC did not return a single rock that exhibits the composition of mantle rocks (Keller et al., 2008), which is likely attributed to the ample supply of hydrous melts from the near volcanic arc and the young age of this spreading system (Figure 10c;
Sleeper et al., 2016). The similarity of both systems is, therefore, limited to magma-rich axial portions of ultraslow ridges.
6. Conclusions
Our analysis of 697 micro-earthquakes recorded during 32 days lasting experiment at the S-FRSC reveals distinct patterns in the spatial and temporal distribution of earthquake foci at this relatively young back- arc extension zone. The majority of recorded earthquakes are concentrated near the center of the axial rift valley. Only sparse seismicity occurs associated with the prominent faults bounding the axial valley. Instead,
the microseismicity is concentrated in a ∼4 km wide zone in the center of the axial valley that delineates the active spreading axis at the S-FRSC. The seismically active zone is possibly exploited by ascending magma, as it correlates with the occurrence of extensive lava flows and densely spaced volcanic ridges at the seafloor.
The best-fitting focal mechanisms of recorded micro-earthquakes show exclusively normal faulting, which is in agreement with focal mechanisms of teleseismic events in this region and with the extensional tecton- ics at the S-FRSC. About 450 events are spatially clustered around 17°42′S and show pronounced similarity in their waveforms. The majority of these events are related to a 138 h lasting earthquake swarm. The earthquake swarm is located in the stepover region between to en echelon magmatic segments. We subdi- vided the swarm seismicity into two spatially separated clusters. The swarm activity initiates in the smaller, southern subcluster and possibly triggered faulting in the larger, northern subcluster. The larger, northern subcluster starts out with the strongest event of the swarm.
Although any relations to magmatic activity cannot fully be ruled out, we conclude that this swarm is pri- marily controlled by the regional scale tectonics at the S-FRSC. The present tectonic fabric of en echelon segmentation shows some similarity with the Lau Extensional Transform Zone, located to the west of the S-FRSC. Both spreading centers are constructed of en echelon segments, which are associated with mi- croseismicity swarms. The Lau Extensional Transform Zone shows a higher obliquity with regards to the spreading direction, which results in a higher tectonic complexity that is manifested in strike slip events. No strike slip focal mechanism has been recorded at the S-FRSC.
We compare the identified microseismicity distribution at the S-FRSC with the ultraslow spreading South- west Indian Ridge and the Knipovich Ridge that open at a similar spreading rate. The brittle lithosphere is about 14 km thick at the S-FRSC, which is within the thickness range of this layer at ultraslow spreading Figure 10. Interpretation sketch outlining the relations of microseismicity with the axial segmentation of the S-FRSC. (a) Shaded bathymetry with epicenters and OBS locations. The 2.75 km depth contour (solid red line) highlights local depressions on the valley floor. The 1.8 km depth contour (solid yellow line) indicates the location of two major volcanic cones. (b) South-north cross-section along the axial valley with projected hypocenters. Gray bars indicate depth errors. The dashed black line indicates the inferred brittle-ductile transition (BDT) below the OBS network. Red shaded areas indicate the magmatic centers, which are expressed by major volcanic cones at the valley floor. (c) Schematic map (modified from Sleeper et al., 2016) illustrating the inferred relations of magmatic centers on the volcanic arc with volcanic centers at the S-FRSC. Light gray shading indicates hydrous (hot) fingers of mantle melt flow from the arc toward the FRSC.
ridges with similar opening rates. The maximum depth of faulting is mainly controlled by temperature. This suggests that the sub axial thermal structure at the S-FRSC is comparable to evolved mid-ocean ridges of similar opening rates.
Data Availability Statement
Raw seismic data, travel time picks, bathymetry, and backscatter data are available from PANGAEA (https://
doi.org/10.1594/PANGAEA.929706).
References
Anderson, M. O., Hannington, M. D., Haase, K., Schwarz-Schampera, U., Augustin, N., McConachy, T. F., & Allen, K. (2016). Tectonic focusing of voluminous basaltic eruptions in magma-deficient backarc rifts. Earth and Planetary Science Letters, 440, 43–55. https://doi.
org/10.1016/j.epsl.2016.02.002
Augustin, N., van der Zwan, F. M., Devey, C. W., Ligi, M., Kwasnitschka, T., Feldens, P., et al. (2016). Geomorphology of the central Red Sea Rift: Determining spreading processes. Geomorphology, 274, 162–179. https://doi.org/10.1016/j.geomorph.2016.08.028
Ayele, A., Keir, D., Ebinger, C., Wright, T. J., Stuart, G. W., Buck, W. R., et al. (2009). September 2005 mega-dike emplacement in the Man- da-Harraro nascent oceanic rift (Afar depression). Geophysical Research Letters, 36(20), L20306. https://doi.org/10.1029/2009GL039605 Baxter, A. T., Hannington, M. D., Stewart, M. S., Emberley, J. M., Breker, K., Krätschell, A., et al. (2020). Shallow seismicity and the
classification of structures in the Lau Back-Arc Basin. Geochemistry, Geophysics, Geosystems, 21(7), e2020GC008924. https://doi.
org/10.1029/2020GC008924
Belachew, M., Ebinger, C., Coté, D., Keir, D., Rowland, J. V., Hammond, J. O. S., & Ayele, A. (2011). Comparison of dike intrusions in an incipient seafloor-spreading segment in Afar, Ethiopia: Seismicity perspectives. Journal of Geophysical Research, 116, 1–23. https://doi.
org/10.1029/2010JB007908
Cannat, M., Sauter, D., Bezos, A., Meyzen, C., Humler, E., & Le Rigoleur, M. (2008). Spreading rate, spreading obliquity, and melt supply at the ultraslow spreading Southwest Indian Ridge. Geochemistry, Geophysics, Geosystems, 9, Q04002. https://doi.org/10.1029/2007gc001676 Cannat, M., Sauter, D., Lavier, L., Bickert, M., Momoh, E., & Leroy, S. (2019). On spreading modes and magma supply at slow and ultraslow
mid-ocean ridges. Earth and Planetary Science Letters, 519, 223–233. https://doi.org/10.1016/j.epsl.2019.05.012
Cannat, M., Sauter, D., Mendel, V., Ruellan, E., Okino, K., Escartin, J., et al. (2006). Modes of seafloor generation at a melt-poor ul- traslow-spreading ridge. Geology, 34, 605. https://doi.org/10.1130/g22486.1
Chen, W.-P., & Molnar, P. (1983). Focal depths of intracontinental and intraplate earthquakes and their implications for the thermal and mechanical properties of the lithosphere. Journal of Geophysical Research, 88, 4183. https://doi.org/10.1029/JB088iB05p04183 Conder, J. A., & Wiens, D. A. (2011). Shallow seismicity and tectonics of the central and northern Lau Basin. Earth and Planetary Science
Letters, 304(3–4), 538–546. https://doi.org/10.1016/j.epsl.2011.02.032
De Barros, L., Baques, M., Godano, M., Helmstetter, A., Deschamps, A., Larroque, C., & Courboulex, F. (2019). Fluid-induced swarms and coseismic stress transfer: A dual process highlighted in the aftershock sequence of the 7 April 2014 earthquake (Ml 4.8, Ubaye, France).
Journal of Geophysical Research: Solid Earth, 124(4), 3918–3932. https://doi.org/10.1029/2018JB017226
Deichmann, N., & Garcia-Fernandez, M. (1992). Rupture geometry from high-precision relative hypocentre locations of microearthquake clusters. Geophysical Journal International, 110(3), 501–517. https://doi.org/10.1111/j.1365-246X.1992.tb02088.x
DeMets, C., Gordon, R. G., & Argus, D. F. (2010). Geologically current plate motions. Geophysical Journal International, 181, 1–80. https://
doi.org/10.1111/j.1365-246X.2009.04491.x
Déverchère, J., Petit, C., Gileva, N., Radziminovitch, N., Melnikova, V., & San'Kov, V. (2001). Depth distribution of earthquakes in the Baikal rift system and its implications for the rheology of the lithosphere. Geophysical Journal International, 146, 714–730. https://doi.
org/10.1046/j.0956-540x.2001.1484.484.x
Dunn, R. A., & Martinez, F. (2011). Contrasting crustal production and rapid mantle transitions beneath back-arc ridges. Nature, 469, 198–202. https://doi.org/10.1038/nature09690
Dziak, R. P. (2004). Evidence of a recent magma dike intrusion at the slow spreading Lucky Strike segment, Mid-Atlantic Ridge. Journal of Geophysical Research, 109, B12102. https://doi.org/10.1029/2004jb003141
Dziak, R. P., Bohnenstiehl, D. R., Matsumoto, H., Fowler, M. J., Haxel, J. H., Tolstoy, M., & Waldhauser, F. (2009). January 2006 sea- floor-spreading event at 9°50′N, East Pacific Rise: Ridge dike intrusion and transform fault interactions from regional hydroacoustic data. Geochemistry, Geophysics, Geosystems, 10, Q06T06. https://doi.org/10.1029/2009gc002388
Eason, D. E., & Dunn, R. A. (2015). Petrogenesis and structure of oceanic crust in the Lau back-arc basin. Earth and Planetary Science Letters, 429, 128–138. https://doi.org/10.1016/j.epsl.2015.07.065
Eguchi, T., Fujinawa, Y., & Ukawa, M. (1989). Microearthquakes and tectonics in an active back-arc basin: The Lau Basin. Physics of the Earth and Planetary Interiors, 56(3–4), 210–229. https://doi.org/10.1016/0031-9201(89)90158-1
Ekström, G., Nettles, M., & Dziewoński, A. M. (2012). The global CMT project 2004–2010: Centroid-moment tensors for 13,017 earth- quakes. Physics of the Earth and Planetary Interiors, 200–201, 1–9. https://doi.org/10.1016/j.pepi.2012.04.002
Escartín, J., Mével, C., Petersen, S., Bonnemains, D., Cannat, M., Andreani, M., et al. (2017). Tectonic structure, evolution, and the nature of oceanic core complexes and their detachment fault zones (13°20′N and 13°30′N, Mid-Atlantic Ridge). Geochemistry, Geophysics, Geosystems, 18, 1451–1482. https://doi.org/10.1002/2016GC006775
Escrig, S., Bézos, A., Langmuir, C. H., Michael, P. J., & Arculus, R. (2012). Characterizing the effect of mantle source, subduction input and melting in the Fonualei Spreading Center, Lau Basin: Constraints on the origin of the boninitic signature of the back-arc lavas.
Geochemistry, Geophysics, Geosystems, 13(10), Q10008. https://doi.org/10.1029/2012GC004130
Feigl, K. L., Gasperi, J., Sigmundsson, F., & Rigo, A. (2000). Crustal deformation near Hengill volcano, Iceland 1993–1998: Coupling be- tween magmatic activity and faulting inferred from elastic modeling of satellite radar interferograms. Journal of Geophysical Research, 105(B11), 25655–25670. https://doi.org/10.1029/2000JB900209
Gomberg, J. S., Shedlock, K. M., & Roecker, S. W. (1990). The effect of S-wave arrival times on the accuracy of hypocenter estimation.
Bulletin of the Seismological Society of America, 80(6A), 1605–1628.
Acknowledgments
We are grateful to the officers and crew of RV Sonne for their support during expedition SO267. We acknowledge the chief scientist M. Hannington and all scientists contributing to the operation of OBSs and acquisition of bathymetry data. We acknowledge the constructive feedback of the editors I. Manighetti, F. Illsley-Kemp, and two anonymous referees, who helped to improve this manuscript. This study was supported by the German Ministry of Science and Education (BMBF, grants 03G0267A and 03G0267B) and the GEOMAR Helmholtz Centre for Ocean Research, Kiel. Figures were created with the Ge- neric Mapping Tools software (Wessel et al., 2013). Open access funding ena- bled and organized by Projekt DEAL.