https://doi.org/10.1007/s00300-019-02537-w ORIGINAL PAPER
Effects of kelp canopy on underwater light climate and viability of brown algal spores in Kongsfjorden (Spitsbergen)
Philipp Laeseke1 · Inka Bartsch2 · Kai Bischof1
Received: 23 April 2018 / Revised: 3 July 2019 / Accepted: 8 July 2019
© Springer-Verlag GmbH Germany, part of Springer Nature 2019
Abstract
Spores represent the most vulnerable life history stage of kelps. While UV-induced inhibition of spore germination has been readily documented, the impact of in situ underwater radiation below kelp canopies has been largely overlooked. We determined spectral composition and intensity of underwater radiation along a density gradient in an Alaria esculenta kelp forest at 3 m depth in Kongsfjorden, Svalbard. Accordingly, we set up a laboratory experiment simulating five different radiation conditions corresponding to irradiances under very dense to no canopy cover on a cloudless summer day. Spore responses (photosynthetic quantum yield, pigment and phlorotannin contents, swimming activity, and germination success) were determined after 4, 8, 16, and 24 h of exposure. In situ spectral radiation composition differed strongly from condi- tions applied in previous studies, which underestimated photosynthetically active radiation and overestimated UV-radiation effects. Furthermore, spore solutions differed significantly in quantum yield, pigment, and phlorotannin contents upon release. Nevertheless, spores reacted dynamically to different radiation conditions and exposure times. Highest radiation (PAR 61.8 W m−2, 1.9 W m−2 UVA, 0.01 W m−2 UVB) caused photodamage after exposure for ≥ 8 h, while intermediate radiation led to photoinhibition. Lowest radiation (PAR 0.23 W m−2, 0 W m−2 UVA, 0 W m−2 UVB) caused inconsistent reactions. There was a reduction of absolute pigment content in all treatments, but reduction rates of photosynthetic pigments were significantly different between radiation treatments. Soluble phlorotannin content decreased under all conditions but was not significantly affected by experimental conditions. High radiation reduced swimming activity of spores, but experimental conditions had almost no effect on germination success. Consequently, it seems unlikely that in situ radiation conditions negatively affect spores in present and future radiation scenarios.
Keywords UV-radiation · Arctic · Laminariales · Photosynthetically active radiation · Germination
Introduction
Climate change will affect polar environments faster and more severely than other regions on earth (Mann et al. 1998;
Tokinaga and Xie 2011; Larsen et al. 2014). During the recent years, a severe sea-ice retreat has been observed in the Arctic due to increasing temperatures, and a nearly sea-ice- free Arctic may be expected by 2037 (Wang and Overland
2009). An earlier and prolonged sea-ice-free period might have strong implications for the Arctic marine flora and fauna due to a prolonged exposure to solar radiation (Larsen et al. 2014). In 2011, the first record of ozone depletion comparable to Antarctic ozone loss was detected over the Arctic (Manney et al. 2011), and it is likely that such condi- tions may occur more often in future (Dameris et al. 2014).
Therefore, it is plausible to assume that organisms will have to cope with higher UV-radiation (UVR) throughout longer sea-ice-free seasons.
Kelp forests provide invaluable ecosystem services to coastal temperate and Arctic environments (see, e.g. Christie et al. 2003), but diverse negative impacts of enhanced UVR on kelp spores have been reported by Wiencke et al. (2000), Wiencke et al. (2004), Roleda et al. (2006a, b), Wiencke et al. (2007a), Steinhoff et al. (2008), Müller et al. (2008, 2009), Fredersdorff et al. (2009). These range from direct
* Philipp Laeseke
philipp.laeseke@uni-bremen.de
1 Marine Botany, University of Bremen, Leobener Straße NW2, 28359 Bremen, Germany
2 Section Functional Ecology - Rocky Shore Ecology, Alfred-Wegener-Institute, Helmholtz-Centre
for Polar- and Marine Research, Am Handelshafen 12, 27570 Bremerhaven, Germany
effects on physiological parameters such as photosynthetic quantum yield to integrated parameters such as germina- tion success, making spores the most vulnerable life his- tory stages of kelps (Roleda et al. 2006c). Hence, the former authors concluded that declining ozone concentrations and concomitant higher UVR exposure could negatively affect recruitment in Arctic kelp forests. Most of these studies were performed under laboratory conditions or just below the water surface. Already Wiencke et al. (2006) pointed out that artificial and natural irradiance conditions differ strongly in intensity as well as spectral composition, challenging the transferability of experimental findings to natural ecosys- tems. Furthermore, the protection of kelp spores from harm- ful UVR doses by parental canopies is unknown. Pearse and Hines (1979), Gerard (1984), Santelices and Ojeda (1984a, b) and Pavlov et al. (2019) described the strong decrease of incoming radiation though kelp canopies.
In this study, we thus aimed at quantifying the protec- tion of spores by a parental canopy for the first time. We investigated the capability of spores of an Arctic kelp species (Alaria esculenta) to biochemically acclimate to radiation conditions mimicking different kelp canopy den- sities. We simulated the radiation regime in the laboratory according to in situ radiation measurements and quanti- fied physiological responses (photosynthetic quantum yield), biochemical acclimation (phlorotannin and pigment adjustments), as well as germination success of A. escu- lenta spores after exposure to the respective experimental conditions. We hypothesized that parental kelp canopies alter the incoming radiation sufficiently to provide shelter from harmful (excessive) UVR and high photosynthetically active radiation (PAR) for spores within the kelp forest to ensure recruitment.
Material and methods
Alaria esculenta (Linnaeus) Greville dominates the sublit- toral zone of Kongsfjorden (79°N, 12°E) below 2.5 m down to 15 m depth together with the kelps Saccharina latissima, Laminaria digitata, Saccorhizadermatodea and Laminaria solidungula (Hop et al. 2002; Bartsch et al. 2016).
Preliminary light regime measurements
Solar radiation was measured in-air on the coast of Kongs- fjorden on June 16, 2015 at noon and under clear sky con- ditions with a TriOS RAMSES spectroradiometer (TriOS RAMSES, type SAM ACC UV/VIS; TriOS GmbH, Rast- ede, Germany; software msda_xe version 7.0; cosine sensor;
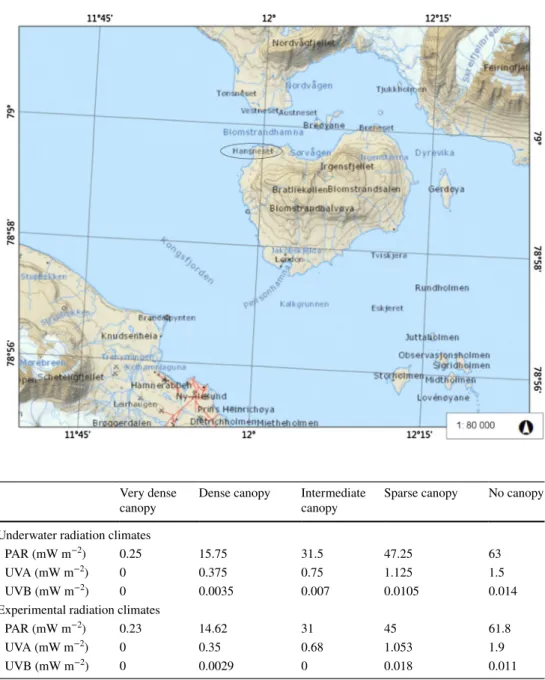
spectrum from 280 to 700 nm wavelength; calibrated for in-air measurements). These measurements provided the basis for laboratory simulations of high radiation condi- tions simulating clear days. To determine the underwater radiation regime, the same measuring device (calibrated for underwater measurements) consecutively was placed outside and inside a A. esculenta dominated kelp forest at 3 m depth by SCUBA divers on June 17, 2015 under homogenously cloudy conditions off Hansneset, Kongsfjord (N 78°59′05.6″, E 011°57′48.7″, Fig. 1). The sensor was kept vertically.
Simultaneously, in-air measurements were conducted with a second device as reference for fluctuations in radiation.
Radiation was measured under different kelp densities, rang- ing from no kelp canopy (outside the kelp forest) to a very dense canopy.
To be able to compare field conditions with other studies, vertical attenuation coefficients (Kd) were calculated accord- ing to Kirk (2011):
Kd=ln(
Ed(z2)∕Ed (z1)
)
⋅
(z1−z2)−1
, with Ed being radiation at depths z1 (just below the water surface) and z2 (3 m depth).
Experimental setup
The in situ radiation measurements served as reference to adjust experimental radiation conditions in the labora- tory. First, we calculated UVB—(280–320 nm), UVA—
(320–400 nm), and PAR—(400–700 nm) specific attenu- ation from the light spectra measured in situ on June 17, 2015. We then applied these coefficients to the radiation values recorded on June 16, 2015 to simulate underwater irradiance conditions on a sunny day along a gradient of five different kelp canopy densities. Experimental radiation conditions are summarized in Table 1. Reduction of incom- ing radiation under no canopy (nc), intermediate canopy (ic), and very dense canopy (vdc) were directly measured in situ, while sparse- (sc) and dense-canopy (dc) radiation climates were linearly extrapolated. For detailed informa- tion on kelp forest density in Kongsfjorden, see Bartsch et al. (2016).
All radiation climates were simulated in a walk-in climate chamber at 4 °C using adjustable computer-controlled white- light LEDs (SolarStinger SunStrip, Econlux GmbH, Köln, Germany) and UV fluorescent tubes (UVA 340, Q-Panel, Ohio, USA) with cutoff filter foils (Schott-WG 280 and 320, Schott, Mainz, Germany; Ultraphan 295, Digefra GmbH, München, Germany; Folex 320, Folex GmbH, Köln, Ger- many) and black net gauze. During the setup, we used inte- grated values for UVB, UVA, and PAR, as calculated by the TriOS RAMSES software msda_xe (version 7.0, underwater
calibration) as reference. Calculated and achieved radiation regimes are summarized in Table 1. Alaria esculenta spores were then exposed to the different radiation conditions for 4, 8, 16, or 24 h.
Spore release
Fertile specimens of A. esculenta were collected by SCUBA divers from 3 m depth off Hansneset and transferred to the laboratory in light-tight barrels filled with fjord water. For the ten consecutive experiments, new specimens were col- lected weekly from the same site between June 24 and July
18, 2015. The kelps were stored in tanks with running ambi- ent seawater from the fjord under low light conditions. About 40 sporophylls from 10 to 15 randomly selected specimens were mixed to harvest spores not only from single individual sporophytes but to represent the investigated population.
For spore release, the sporophylls were processed as fol- lows: After thoroughly wiping the tissue with dishtowels to remove epiphytes, the sporophylls were kept for 24 h in a humid chamber at 4 °C in darkness. Spore release was induced by submerging the sporophylls in temperate (10 °C) filtered seawater (Durapore 0.22 µm Hydrophylic Polyvi- nylidene Fluoride Membrane Filter, Millipore Corporation
Fig. 1 Study area. All experi- ments were conducted at the laboratory in Ny-Ålesund.
Alaria esculenta sporophytes were collected by SCUBA divers off Hansneset. At the same location, the underwa- ter light measurements were conducted. Map © Norwegian Polar Institute (CC BY-NC 4.0)
Table 1 Radiation conditions:
Underwater radiation climates as on a sunny day in 3 m depth off Hansneset, Spitsbergen
Experimental radiation climates are conditions as applied in the laboratory experiments. To calculate natu- ral underwater radiation climates, attenuation for incoming radiation was measured in situ for UVB, UVA, and PAR under no to very dense kelp canopies. These rates were then applied to in-air radiation measure- ments on a sunny day to calculate the underwater light regime as under sunny day conditions
Very dense
canopy Dense canopy Intermediate
canopy Sparse canopy No canopy Underwater radiation climates
PAR (mW m−2) 0.25 15.75 31.5 47.25 63
UVA (mW m−2) 0 0.375 0.75 1.125 1.5
UVB (mW m−2) 0 0.0035 0.007 0.0105 0.014
Experimental radiation climates
PAR (mW m−2) 0.23 14.62 31 45 61.8
UVA (mW m−2) 0 0.35 0.68 1.053 1.9
UVB (mW m−2) 0 0.0029 0 0.018 0.011
Massachusetts) for 15 min in light on the window board. To calculate spore concentration of the stock solution, a repre- sentative subsample was killed with ethanol and counted in a Neubauer “improved” hemocytometer (depth 0.1 mm, small- est grid 0.0025 mm2, Assistent, Sondheim v. d. Rhön, Ger- many). To achieve the desired concentrations for the experi- ments, the stock solutions were diluted with filtered fjord water. Solutions were immediately used in the experiments.
Spore responses
Spore solutions of 1.17 × 10⁶ to 1.78 × 10⁶ spores mL−1 were exposed to the five radiation conditions for 4, 8, 16, or 24 h to investigate effects on photosynthetic quantum yield (Fv/Fm), and pigment and phlorotannin contents. Ten con- secutive experiments with unique combinations of radiation and exposure time were conducted (Tables 2, 3, alphabetical indices of incubated spore solutions follow the chronological order of the experiments). If not indicated otherwise, all vari- ables were measured in four independent samples, except for post-treatment Fv/Fm which was measured in three independ- ent samples. Each measurement was conducted in triplicate.
For Fv/Fm measurements, 20 mL spore solution was put into 5.4-cm-diameter plastic petri-dishes. Measure- ments were conducted as triplicates using a Water PAM chlorophyll fluorometer with a WATER-FT flow-through emitter–detector (Walz GmbH, Effeltrich, Germany) at the beginning of the experiment (initial), directly after radiation exposure (treatment effect), as well as 2 h and 24 h after exposure (recovery). Recovery was allowed under dim radia- tion at 4 °C. For determination of pigment and phlorotannin contents, 40 mL of the spore solution was transferred to 8.5-cm-diameter petri-dishes. Immediately after exposure to experimental conditions, the volume was filtered onto 47-mm-diameter Whatman® GF/C filters, frozen in liquid nitrogen, and stored at − 80 °C until further processing.
Initial samples were taken from the diluted stock solution and preserved in the same manner as at the start of the experiment. The deep-frozen samples were transported to the laboratory at the University of Bremen in a precooled dry-shipper.
Pigment and phlorotannin analysis
Prior to extraction and analysis of pigment content, the fil- ters were lyophilized for 24 h. Subsequently, they were cut into narrow strips, put into 2-mL vials and treated as follows.
All values were determined as triplicates.
Pigment analysis
Extraction was performed in 2 mL 90% Acetone (Merck, Darmstadt) at 1.5 °C in darkness overnight. Afterward, the
samples were centrifuged for 5 min at 13,000 rpm (rcf = 13,792.77) and 4 °C and the solution was filtered through 45 µm nylon syringe filters (Nalgene®, Nalge Nunc Inter- national, Rochester, NY, USA). Subsamples of the pigment extract were analyzed in the High-Performance Liquid Chro- mathography (LaChromElite® with L-2200 autosampler and DAD detector L-2450 by VWR-Hitachi International GmbH, Darmstadt, Germany). For separation of pigments, a Spher- isorb® ODS-2 column (25 cm × 4.6 mm, 5-µm particle size;
Waters, Milford, MA, USA) with a LiChrosphere® 100-RP- 18 guard cartridge was used. Pigment peaks were recorded at 440 nm, and identification and quantification were per- formed by co-chromatography with standards for Chl a and β-Carotene (DHI Lab Products, Hørsholm, Denmark) using the software EZChrom Elite ver. 3.1.3. (Agilent Technolo- gies, Santa Clara, CA, USA). Gradients used for identifica- tion of pigments were according to Wright et al. (1991). All work steps were performed under dark conditions, and the samples were stored on dry ice between the steps.
Phlorotannin analysis
For phlorotannin analysis, the method described in Cruces et al. (2012) was applied. 2 mL of 70% Acetone (Merck, Darmstadt) was added to the strips, and extraction was conducted by shaking at 0 °C for 24 h in darkness. After- ward, the samples were centrifuged for 10 min at 2500×g, and 50 µL of the supernatant was transferred into a new Eppendorf Cup. Immediately, 250 µL dH2O, 200 µL 20%
NaCO3, and 100 µL 2 N Folin-Ciocalteu (Sigma-Aldrich, Steinheim, Germany) were added, and the cups stored for 45 min at room temperature in darkness. After centrifugation for 3 min at 2000 g, 250 µL of the supernatant was trans- ferred to microwell plates for photometric absorbance meas- urements at 730 nm (FLUOStar OPTIMA; BMG Labtech GmbH; Ortenberg, Germany). A calibration curve was cre- ated with Phloroglucinol (Sigma-Aldrich, Seelze, Germany) as standard.
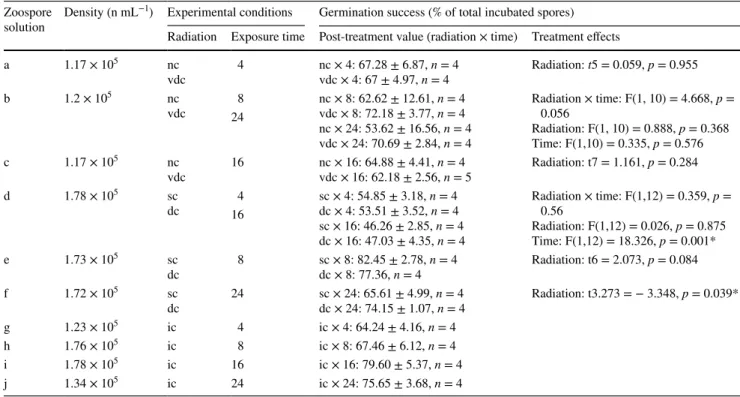
Germination success
Germination success was examined using solutions of 1.17
× 105 to 1.78 × 10⁵ spores mL−1. 20 mL of the solution was transferred to petri-dishes of 5.4 cm diameter with a cover slip placed at the bottom. During and after experimental treatments, spores were allowed to settle and germinate under dim radiation at 4 °C for 3 days. Subsequently, 300 spores were counted on each coverslip with a microscope to calculate the ratio of germinated-to-not-germinated spores.
Spores with a germination tube were considered germi- nated. No differentiation was made between dead and liv- ing spores without tube which were both classified as “not- germinated.” To distinguish radiation effects from intrinsic
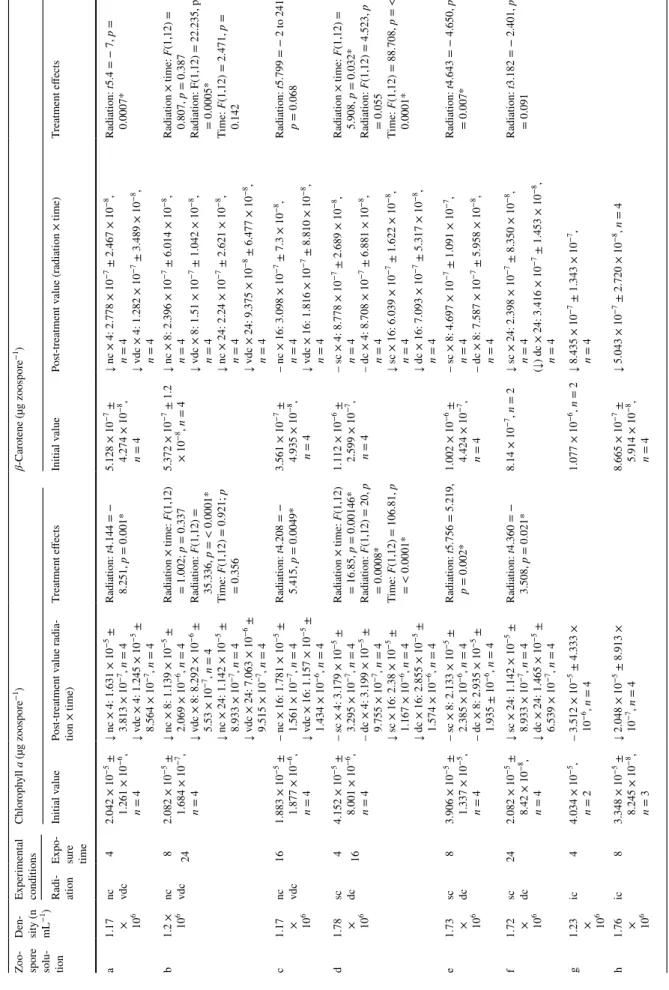
Table 2 Initial and response summaries (Fv/Fm and phlorotannin content): Initial and post-treatment Fv/Fm and phlorotannin measurements for each conducted experiment with results from sta- tistical tests (t test or ANOVA, asterisks = significant effects) Arrows (↓,↑) indicate significant decreases and increases of post-treatment values compared to initial values (= no change) Mean ± SD, n number of replicates, nc no canopy, sc sparse canopy, ic intermediate canopy, dc dense canopy, vdc very dense canopy
Zoospore solutionDen-
sity (n mL
−1)
Experimental conditionsFv/FmPhlorotannins (µg zoospore−1) radia- tionExpo- sure time
Initial valuePost-treatment value radiation × time)Treatment effectsInitial valuePost-treatment value (radia- tion × time)Treatment effects a1.17 × 106
nc vdc
40.378 ± 0.028, n = 3↓ nc × 4: 0.094 ± 0.026, n = 3 ↑ vdc × 4: 0.524 ± 0.006, n = 3Radiation: t2.216 = 27.653; p = 0.0007*9.639 × 10−7 ± 1.436 × 10⁻⁷, n = 3nc × 4: not measured – 0 × 4: 6.871 × 10⁻⁷ ± 7.473 × 10⁻⁸, n = 4 b1.2 × 106
nc vdc
80.313 ± 0.009, n = 3↓ nc × 8: 0.019 ± 0.002, n = 3 ↓ vdc × 8: 0.273 ± 0.009, n = 3 ↓ nc × 24: 0.018 ± 0.003, n = 4 ↓ vdc × 24: 0.246 ± 0.089, n = 4
Radiation × time: (F(1,10) = 0.114; p = 0.742 Radiation: F(1,10) = 583.95; p = < 0.0001* Time: F(1,10) = 0.968; p = 0.348 (2-way ANOVA on log-trans- formed data)
4.577 × 10⁻⁷ ± 1.919 × 10⁻⁸, n = 3↓ nc × 8: 3.727 × 10⁻⁷ ± 4 × 10⁻⁸, n = 4 ↓ vdc × 8: 3.624 × 10⁻⁷ ± 2.367 × 10⁻⁸, n = 3 – nc × 24: 4.103 × 10⁻⁷ ± 1.622 × 10⁻⁷, n = 4 ↓ vdc × 24: 3.501 × 10⁻⁷ ± 3.662 × 10⁻⁷, n = 4
Radiation × Time: F(1,11) = 2.365, p = 0.152 Radiation: F(1,11) = 4.998, p = 0.047* Time: F(1,11) = 0.809, p = 0.388
24 c1.17 × 106
nc vdc
160.358 ± 0.004, n = 3↓ nc × 16: 0.022 ± 0.002, n = 3 ↑ vdc × 16: 0.429 ± 0.017, n = 3Radiation: t2.031 = 40.244; p = 0.0006*9.369 × 10−7 ± 1.436 × 10⁻⁷, n = 3– nc × 16: 9.701 × 10⁻⁷ ± 1.701 × 10⁻⁷, n = 4 – vdc × 16: 7.255 × 10⁻⁷ ± 1.249 × 10⁻⁷, n = 4
Radiation: t4.921 = 0.100, p = 0.924 d1.78 × 106
sc dc
40.215 ± 0.004, n = 4↓ sc × 4: 0.022 ± 0.001, n = 3 ↓ dc × 4: 0.168 ± 0.02, n = 3 ↓ sc × 16: 0.037 ± 0.032, n = 5 ↓ dc × 16: 0.073 ± 0.062, n = 3
Radiation × time: F(1,10) = 5.386; p = 0.043* Radiation: F(1,10) = 35.506; p = 0.0001* Time: F(1,10) = 3.809; p = 0.08
1.361 × 10⁻⁶ ± 6.730 × 10⁻⁸, n = 4↓ sc × 4: 7.83 × 10⁻⁷ ± 2.648 × 10⁻⁸, n = 4 ↓ dc × 4: 8.557 × 10⁻⁷ ± 1.437 × 10⁻⁷, n = 4 ↓ sc × 16: 6.865 × 10⁻⁷ ± 8.503 × 10⁻⁸, n = 4 ↓ dc × 16: 6.973 × 10⁻⁷ ± 8.766 × 10⁻⁸, n = 4
Radiation × Time: F(1,12) = 0.114, p = 0.742 Radiation: F(1,12) = 0.013, p = 0.914 Time: F(1,12) = 5.053, p = 0.044*
16 e1.73 × 106
sc dc
80.202 ± 0.003, n = 4↓ sc × 8: 0.03 ± 0.02, n = 3 ↓ dc × 8: 0.038 ± 0.015, n = 3Radiation: t3.735 = − 0.565; p = 0.6041.105 × 10−6 ± 1.849 × 10⁻⁸, n = 3↓ sc × 8: 6.887 × 10⁻⁷ ± 3.901 × 10⁻⁸, n = 4 ↓ dc × 8: 7.588 × 10⁻⁷ ± 5.423 × 10⁻⁸, n = 4
Radiation: t5.449 = − 2.098, p = 0.085 f1.72 × 106
sc dc
240.248 ± 0.005, n = 3↓ sc × 24: 0.02 ± 0.002, n = 3 ↓ dc × 24: 0.019 ± 0.002, n = 3Radiation: t4 = 0.802; p = 0.4689.790 × 10−7 ± 2.894 × 10⁻⁸, n = 3↓ sc × 24: 7.165 × 10⁻⁷ ± 2.539 × 10⁻⁸, n = 3 ↓ dc × 24: 6.375 × 10⁻⁷ ± 7.179 × 10⁻⁸, n = 4
Radiation: t3.920 = 2.038, p = 0.113 g1.23 × 106ic40.233 ± 0.003, n = 3↓ 0.021 ± 0.004, n = 31.199 × 10⁻⁶ ± 3.159 × 10⁻⁸, n = 3↓ 7.482 × 10⁻⁷ ± 2.357 × 10⁻⁸, n = 3 h1.76 × 106ic80.246 ± 0.004, n = 4↓ 0.022 ± 0.002, n = 39.729 × 10⁻⁷ ± 3.000 × 10⁻⁸, n = 3↓ 6.660 × 10⁻⁷ ± 2.364 × 10⁻⁸, n = 4 i1.78 × 106ic160.318 ± 0.003, n = 3↓ 0.022 ± 0.003, n = 38.037 × 10⁻⁷ ± 3.958 × 10⁻⁸, n = 3− 5.785 × 10⁻⁷ ± 2.929 × 10⁻⁸, n = 3 j1.34 × 106ic240.288 ± 0.006, n = 4↓ 0.022 ± 0.004, n = 37.433 × 10⁻⁷ ± 6.077 × 10⁻⁸, n = 3↓ 5.933 × 10⁻⁷ ± 7.046 × 10⁻⁷, n = 4
Table 3 Initial and response summaries (pigment contents): Initial and post-treatment Chl a and β-Carotene contents for each conducted experiment with results from statistical tests (t test or ANOVA, asterisks = significant effects) Zoo- spore solu- tion
Den-
sity (n mL
−1)
Experimental conditionsChlorophyll a (µg zoospore−1)β-Carotene (µg zoospore−1) Radi- ationExpo- sure time
Initial valuePost-treatment value radia- tion × time)Treatment effectsInitial valuePost-treatment value (radiation × time)Treatment effects a1.17 × 106
nc vdc
42.042 × 10⁻⁵ ± 1.261 × 10⁻⁶, n = 4
↓ nc × 4: 1.631 × 10⁻⁵ ± 3.813 × 10⁻⁷, n = 4 ↓ vdc × 4: 1.245 × 10⁻⁵ ± 8.564 × 10⁻⁷, n = 4
Radiation: t4.144 = − 8.251, p = 0.001*5.128 × 10−7 ± 4.274 × 10⁻⁸, n = 4
↓ nc × 4: 2.778 × 10⁻⁷ ± 2.467 × 10⁻⁸, n = 4 ↓ vdc × 4: 1.282 × 10⁻⁷ ± 3.489 × 10⁻⁸, n = 4
Radiation: t5.4 = − 7, p = 0.0007* b1.2 × 106
nc vdc
82.082 × 10⁻⁵ ± 1.684 × 10⁻⁷, n = 4
↓ nc × 8: 1.139 × 10⁻⁵ ± 2.069 × 10⁻⁶, n = 4 ↓ vdc × 8: 8.292 × 10⁻⁶ ± 5.53 × 10⁻⁷, n = 4 ↓ nc × 24: 1.142 × 10⁻⁵ ± 8.933 × 10⁻⁷, n = 4 ↓ vdc × 24: 7.063 × 10⁻⁶ ± 9.515 × 10⁻⁷, n = 4
Radiation × time: F(1,12) = 1.002; p = 0.337 Radiation: F(1,12) = 35.336, p = < 0.0001* Time: F(1,12) = 0.921; p = 0.356
5.372 × 10⁻⁷ ± 1.2 × 10⁻⁸, n = 4↓ nc × 8: 2.396 × 10⁻⁷ ± 6.014 × 10⁻⁸, n = 4 ↓ vdc × 8: 1.51 × 10⁻⁷ ± 1.042 × 10⁻⁸, n = 4 ↓ nc × 24: 2.24 × 10⁻⁷ ± 2.621 × 10⁻⁸, n = 4 ↓ vdc × 24: 9.375 × 10⁻⁸ ± 6.477 × 10⁻⁸, n = 4
Radiation × time: F(1,12) = 0.807, p = 0.387 Radiation: F(1,12) = 22.235, p = 0.0005* Time: F(1,12) = 2.471, p = 0.142
24 c1.17 × 106
nc vdc
161.883 × 10⁻⁵ ± 1.877 × 10⁻⁶, n = 4
– nc × 16: 1.781 × 10⁻⁵ ± 1.561 × 10⁻⁷, n = 4 ↓ vdc × 16: 1.157 × 10⁻⁵ ± 1.434 × 10⁻⁶, n = 4
Radiation: t4.208 = − 5.415, p = 0.0049*3.561 × 10−7 ± 4.935 × 10⁻⁸, n = 4
– nc × 16: 3.098 × 10⁻⁷ ± 7.3 × 10⁻⁸, n = 4 ↓ vdc × 16: 1.816 × 10⁻⁷ ± 8.810 × 10⁻⁸, n = 4
Radiation: t5.799 = − 2 to 241, p = 0.068 d1.78 × 106
sc dc
44.152 × 10⁻⁵ ± 8.001 × 10⁻⁶, n = 4
– sc × 4: 3.179 × 10⁻⁵ ± 3.295 × 10⁻⁷, n = 4 – dc × 4: 3.199 × 10⁻⁵ ± 9.755 × 10⁻⁷, n = 4 ↓ sc × 16: 2.38 × 10⁻⁵ ± 1.167 × 10⁻⁶, n = 4 ↓ dc × 16: 2.855 × 10⁻⁵ ± 1.574 × 10⁻⁶, n = 4
Radiation × time: F(1,12) = 16.85, p = 0.00146* Radiation: F(1,12) = 20, p = 0.0008* Time: F(1,12) = 106.81, p = < 0.0001*
1.112 × 10−6 ± 2.599 × 10⁻⁷, n = 4
– sc × 4: 8.778 × 10⁻⁷ ± 2.689 × 10⁻⁸, n = 4 – dc × 4: 8.708 × 10⁻⁷ ± 6.881 × 10⁻⁸, n = 4 ↓ sc × 16: 6.039 × 10⁻⁷ ± 1.622 × 10⁻⁸, n = 4 ↓ dc × 16: 7.093 × 10⁻⁷ ± 5.317 × 10⁻⁸, n = 4
Radiation × time: F(1,12) = 5.908, p = 0.032* Radiation: F(1,12) = 4.523, p = 0.055 Time: F(1,12) = 88.708, p = < 0.0001*
16 e1.73 × 106
sc dc
83.906 × 10⁻⁵ ± 1.337 × 10⁻⁵, n = 4
– sc × 8: 2.133 × 10⁻⁵ ± 2.385 × 10⁻⁶, n = 4 – dc × 8: 2.935 × 10⁻⁵ ± 1.935 ± 10−6, n = 4
Radiation: t5.756 = 5.219, p = 0.002*1.002 × 10−6 ± 4.424 × 10⁻⁷, n = 4
– sc × 8: 4.697 × 10⁻⁷ ± 1.091 × 10⁻⁷, n = 4 – dc × 8: 7.587 × 10⁻⁷ ± 5.958 × 10⁻⁸, n = 4
Radiation: t4.643 = − 4.650, p = 0.007* f1.72 × 106
sc dc
242.082 × 10⁻⁵ ± 8.42 × 10⁻⁸, n = 4
↓ sc × 24: 1.142 × 10⁻⁵ ± 8.933 × 10⁻⁷, n = 4 ↓ dc × 24: 1.465 × 10⁻⁵ ± 6.539 × 10⁻⁷, n = 4
Radiation: t4.360 = − 3.508, p = 0.021*8.14 × 10−7, n = 2↓ sc × 24: 2.398 × 10⁻⁷ ± 8.350 × 10⁻⁸, n = 4 (↓) dc × 24: 3.416 × 10⁻⁷ ± 1.453 × 10⁻⁸, n = 4
Radiation: t3.182 = − 2.401, p = 0.091 g1.23 × 106
ic44.034 × 10−5, n = 2– 3.512 × 10⁻⁵ ± 4.333 × 10⁻⁶, n = 41.077 × 10⁻⁶, n = 2↓ 8.435 × 10⁻⁷ ± 1.343 × 10⁻⁷, n = 4 h1.76 × 106
ic83.348 × 10−5 ± 8.245 × 10⁻⁸, n = 3
↓ 2.048 × 10⁻⁵ ± 8.913 × 10⁻⁷, n = 48.665 × 10⁻⁷ ± 5.914 × 10⁻⁸, n = 4
↓ 5.043 × 10⁻⁷ ± 2.720 × 10⁻⁸, n = 4
Arrows (↓,↑) indicate significant decreases and increases of post-treatment values compared to initial values (– = no change) Mean ± SD, n number of replicates, nc no canopy, sc sparse canopy, ic intermediate canopy, dc dense canopy, vdc very dense canopy
Zoo- spore solu- tion
Den-
sity (n mL
−1)
Experimental conditionsChlorophyll a (µg zoospore−1)β-Carotene (µg zoospore−1) Radi- ationExpo- sure time
Initial valuePost-treatment value radia- tion × time)Treatment effectsInitial valuePost-treatment value (radiation × time)Treatment effects i1.78 × 106
ic163.522 × 10−5 ± 3.874 × 10⁻⁶, n = 4
↓ 2.180 × 10⁻⁵ ± 1.825 × 10⁻⁶, n = 49.621 × 10⁻⁷ ± 1.285 × 10⁻⁷, n = 4
↓ 5.689 × 10⁻⁷ ± 5.791 × 10⁻⁸, n = 4 j1.34 × 106
ic242.532 × 10−5 ± 3.177 × 10⁻⁶, n = 4
↓ 1.120 × 10⁻⁵ ± 7.135 × 10⁻⁶, n = 45.877 × 10⁻⁷ ± 7.063 × 10⁻⁸, n = 4
↓ 2.612 × 10⁻⁷ ± 1.sc0 × 10−7, n = 4
Table 3 (continued)
effects, a dim radiation control was set up where spores were incubated for 3 days in dim radiation without prior experi- mental treatment.
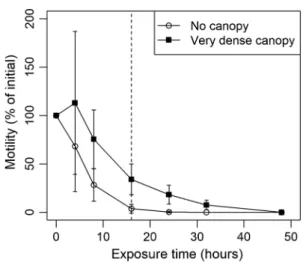
Motility of spores
To examine motility of spores over time, suspensions of 8.17 × 10⁶ spores mL−1 were transferred to 8.5-cm-diameter petri-dishes and exposed to vdc and nc conditions. Motility was determined upon release as well as after 4, 8, 16, 24, 32, and 48 h of exposure to the respective radiation treatments.
To do so, a subsample of the suspension was transferred into a Neubauer “improved” hemocytometer (specifications as above). One line of 1 mm length within the hemocytom- eter was determined at random for the respective counting session, and for 3 min each, crossing of this line by spores was counted directly in the microscope. If a spore swam in a narrow circle on the line, only one crossing was counted.
Results are presented as percent of initial activity.
Statistical analysis
All statistical analyses were performed using the software
“R” (version 3.5.2; R Core Team 2018) with the respec- tive packages. Shapiro–Wilk Test for normality (r-core) and Levene Test for homoscedasticity (“car” package: Fox and Weisberg 2011) were performed prior to test statistics. Sub- sequently, Welch’s t test or ANOVAs (one-way or two-way according to the respective experimental setup) was applied with radiation and exposure times as independent variables and the respective response parameter as dependent variable.
For recovery of Fv/Fm, repeated measure ANOVAs were executed to identify significant recovery effects. As post-hoc test, the Tukey’s HSD Test (“agricolae” package: de Mend- iburu 2015; “DTK” package for unequal sample sizes: Lau 2013) was executed for identifying significantly different subsample groups. For all analyses, the significance level was set at α ≤ 0.05. Graphics presented in this text were created with the “Hmisc” package (Harrell 2015) in addition to base graphics. In the following, data are presented as ± standard deviation.
Results
In situ light climate
On June 16, 2015, 165.66 W m−2 PAR, 25.31 W m−2 UVA, and 0.47 W m−2 UVB was measured in-air at noon under clear-sky conditions. At noon of June 17, 2015, in- air radiation measurements was 58.6 ± 5.2 W m−2 PAR, 7.8 ± 0.7 W m−2 UVA, and 0.3 ± 0.02 W m−2 UVB. Kd- coefficients were 1.67 m−1 for UVB, 1.42 m−1 for UVA, and
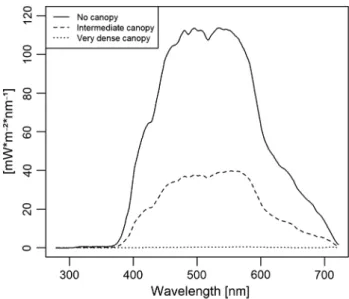
0.36 m−1 for PAR. Kelp cover strongly reduced the incoming radiation at 3 m depth (Fig. 2). At 3 m depth without kelp canopy, 22.8 W m−2 PAR, 0.5 W m−2 UVA, and 0.006 W m−2 UVB was recorded. Under a very dense kelp canopy, almost no remaining radiation was measured (0.1 W m−2 PAR, 0.001 W m−2 UVA, and 0 W m−2 UVB). Intermedi- ate kelp canopy reduced in-air radiation to 7.7 W m−2 PAR, 0.15 W m−2 UVA, and 0.002 W m−2 UVB.
Response variables
Upon release, spore solutions differed significantly from each other in Fv/Fm values, Chl a, β-Carotene, and phloro- tannin content (Figs. 3, 4 and Tables 2, 3). Because of these significant differences between initial values, responses were examined for each single spore solution and parameter with- out pooling the results.
Photosynthetic quantum yield
Initial Fv/Fm values ranged from 0.202 ± 0.003 to 0.378 ± 0.028. Significant photoinhibition was observed in all treat- ments directly after light exposure, except for two vdc simu- lations (4 and 16 h of exposure; Fig. 3a, Table 2). In general, Fv/Fm showed significant interaction between radiation and exposure time, as well as significant radiation effects. In one experiment, there was a significant interaction effect of exposure time and radiation (solution d, sc, vs, dc simula- tions with 4 and 16 h exposure times). Here, less exposure time under dc conditions led to higher remaining Fv/Fm. Radiation significantly affected Fv/Fm in four experiments with vdc, dc, sc, and nc simulations (solutions a–d). In all
cases, Fv/Fm was significantly lower after exposure to higher radiation. Under nc conditions, reduction of Fv/Fm values varied from 0.3 to 0.094 ± 0.026 (n = 3) after 4 h of expo- sure and to 0.02 after longer exposure times, respectively.
After exposure to vdc conditions, the responses were incon- sistent: After 4 and 16 h of exposure times, Fv/Fm increased to significantly higher values than the initial ones (4 h: from 0.378 ± 0.028 to 0.524 ± 0.006; 16 h: from 0.358 ± 0.004 to 0.429 ± 0.017; n = 3). In contrast, after 8 and 24 h, Fv/Fm was significantly reduced to lower values than the initial one (8 h: from 0.313 ± 0.009 to 0.273 ± 0.009; 24 h: from 0.313 ± 0.009 to 0.246 ± 0.089; n = 3, 4). After exposure to nc conditions, full recovery was only apparent in the 4 h experiment (Fig. 3b). After 8 and 24 h, no recovery was observed, while after 16 h, there was a partial recovery of Fv/Fm. In the vdc experiments, the pattern observed directly after light exposure remained the same throughout the recov- ery time with increased Fv/Fm in the 4 and 16 h experiments and reduced Fv/Fm in the 8 and 24 h experiments (Fig. 3 f).
In experiments with dc and sc conditions, there was a significant interaction effect of radiation and exposure time, with higher radiation and longer exposure times leading to higher reductions in Fv/Fm. In addition, radiation had a sig- nificant effect on Fv/Fm. Higher radiation led to significantly stronger decrease in Fv/Fm in one experiment (4 h of expo- sure, sc conditions: reduction from 0.215 ± 0.004 to 0.022
± 0.001; dc conditions, n = 4: reduction from 0.215 ± 0.004 to 0.168 ± 0.02; n = 3). In two experiments (exposure times of 8 and 24 h), no effects were detected. After all treatments with dc or sc conditions, full recovery to initial values was achieved, latest after 24 h. Only spores subjected to sc condi- tions for 8 h just showed a partial recovery (initial: 0.358 ± 0.006, after treatment: 0.236 ± 0.044). All ic treatments sig- nificantly decreased their Fv/Fm values to 0.02, irrespective of initial values. Similar to the sc and dc simulations, full recovery was accomplished in all cases but one (just partial recovery after 24 h in ic conditions; initial value: 0.288 ± 0.006, after treatment: 0.213 ± 0.021, after 24-h recovery:
0.213 ± 0.021).
Pigment contents
Initial Chl a contents ranged from 1.9−5 ± 1.9−6 to 4.5−5
± 2.0−6 µg spore−1 and initial β-Carotene contents from 3.6 × 10⁻⁷ ± 4.9 × 10⁻⁸ to 1.2 × 10⁻⁶ ± 4.3 × 10⁻⁸ µg spore−1 (Fig. 4a, b, Table 3). Contents of chlorophyll a and β-Carotene were significantly reduced under most experi- mental conditions (Chl a: 7.063 × 10⁻⁶ ± 9.515 × 10⁻⁷ to 3.512 × 10⁻⁵ ± 4.333 × 10⁻⁶; β-Carotene: 9.375 × 10⁻⁸ ± 6.477 × 10⁻⁸ to 8.708 × 10⁻⁷ ± 6.881 × 10⁻⁸; Table 3). Pig- ment content did not increase in any of the experiments, and there were not only significant interactions between irradi- ance and time, but also single factor significances of either
Fig. 2 Underwater light regime. Underwater light climate at 3 m depth on June 17, 2015 under different kelp canopy densities in the Kongsfjord, Svalbard, off Hansneset
factor alone among the different experiments. In two experi- ments (β-Carotene, solutions c and f), the treatment had no significant effect. In general, there were more significant effects for Chl a than for β-Carotene, with seven significant effects in total for the former and five significant effects for the latter pigment.
In nc and vdc simulation experiments, radiation signifi- cantly reduced pigment content. Contents were lower after exposure to vdc conditions than after exposure to nc condi- tions in both pigments (Table 3—spore solutions a–c, sig- nificant differences after exposure for 4 and 24 h in both pigments). Only in nc simulations for 16 h, contents did not change (Chl a initial: 1.883 × 10⁻⁵ ± 1.877 × 10⁻⁶,
Fig. 3 Summary of Fv/Fm responses (y-axis) to respective exposure and recovery times (x-axis) and radiation treatments (b–f). a the ini- tial values (open white dots) as well as responses directly after light exposure (black filled dots) for different exposure times. b–f the ini- tial value (ini), Fv/Fm directly after exposure (trt), as well as after 2 h
of recovery (rec1) and 24 h of recovery (rec2) for each light intensity scenario. Exposure times are given in the subpanels. Letters indicate the incubated zoospore solution for easier comparability. All values are mean ± SD. n as in Table 2
after treatment: nc × 16: 1.781 × 10⁻⁵ ± 1.561 × 10⁻⁷; β-Carotene initial: 3.561 × 10⁻⁷ ± 4.935 × 10⁻⁸, after treat- ment: nc × 16: 3.098 × 10⁻⁷ ± 7.3 × 10⁻⁸). In contrast, in dc and sc simulations, contents were higher after exposure to lower radiation than those after exposure to higher radiation (Table 3—spore solutions d–f; significant after 8–24-h expo- sure in Chl a and after 8 and 16 h exposure in β-Carotene).
In the dc and sc treatments with 4 and 16 h exposure times (spore solution d), there was a significant interaction effect of radiation and exposure times, Chl a sc × 4: 3.179 ×
10−5 ± 3.295 × 10⁻⁷, dc × 4: 3.199 × 10⁻⁵ ± 9.755 × 10⁻⁷, sc × 16: 2.38 × 10⁻⁵ ± 1.167 × 10⁻⁶, dc × 16: 2.855 × 10⁻⁵
± 1.574 × 10⁻⁶, Radiation × time: F(1,12) = 16.85, p = 0.001;
β-Carotene: sc × 4: 8.778 × 10⁻⁷ ± 2.689 × 10⁻⁸, dc × 4:
8.708 × 10⁻⁷ ± 6.881 × 10⁻⁸, sc × 16: 6.039 × 10⁻⁷ ± 1.622
× 10−8, dc × 16: 7.093 × 10⁻⁷ ± 5.317 × 10⁻⁸, Radiation × time: F(1,12) = 5.908, p = 0.032). Higher radiation and longer exposure time led to stronger reduction in pigment content than with either factor alone. In addition, radiation as well as exposure time had significant single effects on the Chl a
Fig. 4 Zoospore responses to experimental conditions. Initial and post-treatment values of investigated parameters (y-axis) after respec- tive exposure times (x-axis). Chlorophyll a (a), β-Carotene (b) and phlorotannin content (c) are given in µg zoospore−1. Germination success (d) is given in percent and represents values after the experi-
mental treatment and 3 days of subsequent growth time. White circles are initial values, black filled dots are post-treatment values. Error bars are standard deviation. For exact numbers and number of repli- cates, refer to Tables 2, 3, and 4. nc no canopy, sc sparse canopy, ic intermediate canopy, dc dense canopy, vdc very dense canopy