Onset and modifications in intensity and pathways of water mass exchange between the Southeast Pacific and the South Atlantic with focus on the Falkland Plateau, Northern Scotia Ridge and the
West Georgia Basin Cruise No. MSM81
February 2 2019 – March 15 2019, Valparaiso (Chile) – Montevideo (Uruguay)
Dr. Gabriele Uenzelmann-Neben
Alfred-Wegener-Institut Helmholtz-Zentrum für Polar- und Meeresforschung
2019
Table of Contents
1 Cruise Summary... 3
1.1 Summary in English ... 3
1.2 Zusammenfassung... 4
2 Participants ... 5
2.1 Principal Investigators ... 5
2.2 Scientific Party ... 5
2.3 Participating Institutions ... 5
2.4 Crew ... 6
3 Research Program ... 6
3.1 Aims of the Cruise ... 6
3.2 Agenda of the Cruise ... 10
4 Narrative of the Cruise ... 11
5 Preliminary Results ... 12
5.1 Seismic Reflection Profiling ... 12
5.1.1 Seismic Equipment ... 12
5.1.1.1 Seismic Sources, Activation and Timing ... 12
5.1.1.2 Navigation and triggering ... 13
5.1.1.3 Multi-Channel Reflection Recording System ... 13
5.1.1.4 Depth Control and Positioning... 14
5.1.1.5 Passive Acoustic Monitoring ... 15
5.1.1.6 First Results ... 16
5.2 Sediment Acoustics/Sub-Bottom Profiling ... 20
5.2.1 Technical Description. ... 20
5.2.2 Data Acquisition ... 21
5.2.3 Sediment Acoustics Preliminary Results ... 22
5.3 Bathymetry ... 23
5.3.1 System Overview ... 24
5.3.2 Sound Velocity Measurements ... 25
5.3.3 Data Processing ... 26
5.3.4 Preliminary Results ... 27
6 Ship’s Meteorological Station... 27
7 Station List MSM 81 ... 27
7.1 Overall Station List ... 28
7.2 Profile Station List ... 28
8 Data and Sample Storage and Availability ... 28
9 Acknowledgements ... 29
10 References ... 29
Appendix A Stationbook MSM 81 ... 31
Appendix B Seismic Profile Summary ... 55
1 Cruise Summary 1.1 Summary in English
Cruise Leg MSM81 with RV MARIA S. MERIAN, leaving Valparaiso, Chile, on February 2 2019, returning to Montevideo, Uruguay, on March 15 2019, comprised seismic reflection studies of the Falkland Plateau, the westernmost part of the Agulhas-Falkland Fracture Zone in the South Atlantic. The Falkland Plateau rises up 1500 m above the surrounding seafloor and hence forms an obstacle for the exchange of water masses between high and lower latitudes. A water mass exchange between the Pacific and Atlantic oceans has been enabled with the opening of Drake Passage. In this way heat and energy could be transferred between the two oceans. A detailed study and analysis of the structure of the Falkland Plateau and channel in the south via seismic data and a correlation with results from DSDP Leg 36 Sites 327, 329, and 330 as well as Leg 71 Site 511 was needed to supply information on the Cretaceous and Tertiary development of the Falkland Plateau and its influence on the path of the Antarctic Circumpolar Current, Upper and Lower Circumpolar Deepwater, South Pacific Deepwater, and Weddell Sea Deepwater. Seismic profiles were gathered, which capture the structure of the Falkland Plateau to basement and possible sediment drifts. In total ~5200 km of high resolution seismic reflection data were recorded.
Bathymetric and Parasound data were recorded parallel to the seismic profiling.
To complement the seismic studies SVP and XSV measurements at six locations and ADCP measurements across the whole working area were carried out.
1.2 Zusammenfassung
Der Fahrtabschnitt MSM81 vom 2. Februar 2019 Valparaiso, Chile, bis 15. März 2019 Montevideo, Uruguay, mit FS MARIA S. MERIAN bestand aus reflexionsseismischen Untersuchungen des Falkland Plateaus, der westlichen Struktur in der Agulhas-Falkland Fracture Zone im Südatlantik. Das Falkland Plateau erhebt sich bis auf 1500 m Wassertief und formt so eine Barriere für den Austausch von Wassermassen zwischen hohen und mittleren Breiten. Ein Wassermassenaustausch zwischen Pazifik und Atlantik wurde durch die Öffnung der Drake Passage ermöglicht. Auf diese Weise kam es auch zum Austausch von Energie und Wärme. Eine detaillierte Erfassung und Analyse der Struktur des Falkland Plateaus und der südlich gelegenen Rinne mittels seismischer Methoden und ein Anschluß an bestehende DSDP Bohrungen (DSDP Legs 36 und 71) wurde benötigt, um Informationen über die spätkretazische und tertiäre Entwicklung des Falkland Plateaus und seinen Einfluß auf die Entwicklung der Pfade des Antarktischen Zirkumpolarstroms, des Oberen und Unteren Zirkumpolaren Tiefenwassers, des Pazifischen Tiefenwassers und des Weddell Tiefenwassers zu erhalten. Das reflexionsseismische Programm während der Expedition MSM81wurde derart gestaltet, dass die Struktur des Falkland Plateaus bis zum Basement sowie mögliche Sedimentdrifts erfasst wurden. Es wurden insgesamt
~5200 km an hochauflösenden reflexionsseismischen Daten registriert. Parallel zu den seismischen Profilarbeiten wurden bathymetrische und Parasound Messungen durchgeführt.
Ergänzt wurden die seismischen Messungen durch sechs SVP und XSV Stationen und ADCP Messungen im Gebiet des Falkland Plateaus.
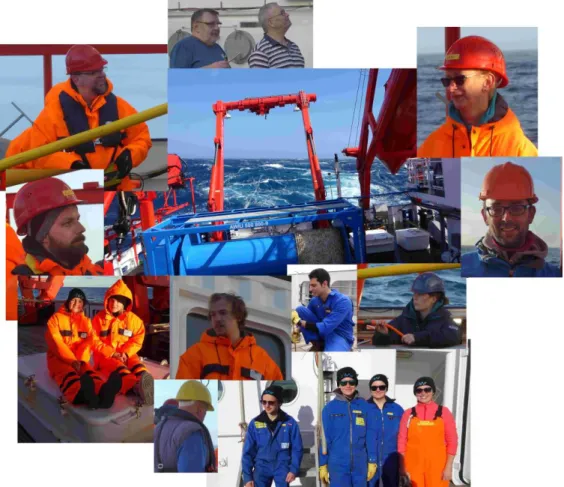
Fig. 1.1 Scientific team of cruise MSM81.
2 Participants
2.1 Principal Investigators
Name Institution
Uenzelmann-Neben, Gabriele, Dr. AWI
Westerhold, Thomas, Dr. MARUM
2.2 Scientific Party
Name Discipline Institution
Uenzelmann-Neben, Gabriele Marine Seismics / Chief Scientist AWI
Eggers, Thorsten Marine Seismics AWI
Lensch, Norbert Marine Seismics AWI
Pfeiffer, Adalbert Marine Seismics AWI
Beckmann, Regina Marine Seismics AWI
Nüsse, Amelie Marine Seismics AWI
Andreas, Pascal Marine Seismics AWI
Petersen, Ann-Kathrin Marine Seismics AWI
Geils, Jonah Bathymetry AWI
Knopp, Lisa Bathymetry AWI
Andree, Sophie Bathymetry AWI
Westerhold, Thomas Parasound MARUM
Ramadan, Abdel-Rahman Parasound AWI
Reuter, Runa Parasound AWI
Gatt, Peter Marine Mammal Observer SFF
Soutar, George Marine Mammal Observer SFF
Mouchel-Drillot, Mathieu Marine Seismics SERCEL
Neuilly, Alexandre Marine Seismics SERCEL
Principi, Sebastian Observer Coastal State Argentina IGEBA
2.3 Participating Institutions
AWI Alfred-Wegener-Institut Helmholtz-Zentrum für Polar- und Meeresforschung Bremerhaven
IGEBA Buenos Aires’ Basic Geoscience Institute
MARUM Zentrum für Marine Umweltwissenschaften Bremen SFF SFF Services Limited
SERCEL Sercel France
2.4 Crew
Name Rank
Schmidt, Ralf Kapitän / Master
Peters, Ralf Ltd Offizier/ Chief Officer
Janssen, Sören 1. Offizier/ 1st Officer
Kruse, Marius 2. Offizier/ 2nd Officer
Angelis, Wilhelm 2. Offizier/ 2nd Officer
Ogrodnik, Thomas Ltd Ingenieur/Chief Engineer
Boy, Manfred 2. Ingenieur/ 2nd Engineer
Schwieger, Philipp 3. Ingenieur/ 3rd Engineer
Maggiulli, Michael System Operator
Walter, Jörg Eletroniker/ Electronics
Hermann, Jens Elektriker/ Electrics
Wiechert, Olaf Deckschlosser/ Fitter
Meyer, Felix Motormann/ Oiler
Bosselmann, Norbert Bootsmann/ Bosun
Wolff, Andreas Schiffsmechaniker, SM
Vredenborg, Enno Schiffsmechaniker, SM
Schrapel, Andreas Schiffsmechaniker, SM
Peschel, Jens Schiffsmechaniker, SM
Werner, André Schiffsmechaniker, SM
Plink, Sebastian Schiffsmechaniker, SM
Siefken, Tobias Schiffsmechaniker, SM
Matter, Sebastian 1. Koch/ 1st Cook
Streifling, Stefan 2. Koch/2nd Cook
Seidel, Iris Stewardess
Staak, Ludwig Bordarzt/ Ship’s Doctor
3 Research Program
(G. Uenzelmann-Neben1, T. Westerhold2)
1AWI
2MARUM
3.1 Aims of the Cruise
The South American gateway comprising Drake Passage and the Scotia Sea is of huge importance because its opening enabled the exchange of deep water masses and energy between the southern Pacific and the South Atlantic. This in combination with opening of the Tasman Gateway enabled the establishment of the clockwise flowing Antarctic Circumpolar Current (ACC) at the Eocene/Oligocene boundary. The onset of the ACC caused the thermal isolation of the Antarctic continent which has been considered as a prerequisite for the onset of widespread glaciation in Antarctica by some researchers (e.g., Barker and Thomas, 2004; Livermore et al., 2007; Zachos et
al., 2001), whereas other authors favour a major drop in atmospheric CO2 concentrations as the main trigger for Antarctic glaciation (e.g., Coxall et al., 2005; DeConto et al., 2008; Pagani et al., 2005). Recently, a coupled ocean-atmosphere model based study (Goldner et al., 2014) proposed a major reorganisation of the ocean circulation by the Antarctic glaciation at the Eocene/Oligocene boundary strengthening Antarctic Intermediate Water flow to the north as well as invigorating the formation of Antarctic Bottom Water.
The overaching goals of the cruise MSM81 Falkland Sediment Drifts were twofold: we intended to 1) study variations in flow paths and intensities of deep and bottom water masses in response to a) tectonic movements, and b) climate variability; this has been the major focus of the cruise, and 2) collect pre-site survey data for IODP proposal 862-Pre.
Objective 1: Reconstruct variations in flow path and intensities of deep and bottom water masses
The deep and bottom water masses flowing within the ACC (Antarctic Bottom Water (AABW), WSDW, SPDW, LCDW, UCDW) are steered by the complex topography of the Drake Passage and the Scotia Sea (Figs. 3.1 and 3.2). Rounding topographic highs the water masses reduce their speed and hence deposit sediment. In gaps and passages their speed is increased leading to erosion and non-deposition. In this way the aforementioned water masses shape sediment drifts, which in their structure (geometry, internal unconformities, reflection characteristics) document the modifications in the flow paths and intensities of the water masses.
The tectonic development of both the Drake Passage and the Scotia Sea during the Cenozoic have led to strong modifications in the flow paths, which, when studying sediment drifts, can be deciphered. Additionally, the ACC fronts are assumed to have been subject to relocations during glacial-interglacial cycles. This again has led to relocations in depocentres, which can be identified via seismic profiles. So far, research here has concentrated on the area south of the Falkland Islands towards South America (Koenitz et al., 2008; Pérez et al., 2015) but the flow of water masses across the plateau has not been studied. Results of DSDP Legs 36 and 71 suggested intensified bottom currents as early as the Eocene, which led to the discussion of an early Tertiary water mass exchange between the Pacific and the Atlantic oceans (Shipboard_Scientific_Party, 1977, 1980).
Numerical simulations also suggest a weak ACC for the late Cretaceous but no overturning circulation (Uenzelmann-Neben et al., 2017).
The questions we intended to answer have been the following:
When and how did the onset of the ACC and the deep and bottom water masses flowing within the ACC affect sedimentation at the Falkland Plateau area?
When can we recognise the first overspill of UCDW and LCDW over the Falkland Plateau indicating transport of cold water masses into the South Atlantic?
What are the variations of the pathways and intensity of overspill and the location of the ACC fronts in relation to a) tectonic movements, and b) modifications in climate (e.g. Mid- Miocene Climatic Optimum and Transition, Pliocene warming, onset of widespread glaciation on the Northern Hemisphere)?
To answer those questions we collected a set of high-resolution (1 ms sample rate, 500 Hz max frequency, 80 Hz dominant frequency 9 m vertical resolution, 240 channels, 25 m shot interval) seismic profiles on the Falkland Ridge between a) the Falkland Islands and the MEB (Fig. 5.3).
This set of seismic lines will enable the detection and imaging of sediment drifts shaped by UCDW west of MEB and shaped by LCDW and WSDW in the channel south of the plateau and MEB (Fig. 3.1). The seismic lines further crossed the locations of DSDP Leg 36 Sites 327 and 329 and Leg 71 Sites 511 and 512. Those sites recovered sedimentary rocks going back towards the Jurassic (Site 511, Ciesielski and Weaver, 1980), were used for dating regional seismic reflections (Ciesielski and Weaver, 1980; Shipboard_Scientific_Party, 1977), and, via the computation of synthetic seismograms, will thus allow to correlate the acquired seismic data with geological information (lithology, sediment composition, grain sizes, etc) and to develop age-depth models.
The new seismic profiles hence will provide information on the depositional regime (location/relocation and orientation of depocentres, sedimentary structures, e.g., sediment drifts and waves, erosional structures) prior, during, and following the opening of Drake Passage by imaging the sedimentary sequences and structures for those periods. We will be able to reconstruct the effect of the onset of the ACC on sediment deposition and the modifications in ACC pathway and flow intensity due to tectonic movements and climate variability. Sediment drifts located in the Falkland Passage east of MEB are particularly important targets because they should be sensitive recorders of past relocations of the SACCF retroflection and of past changes in both WSDW and LCDW flow (Naveira Garabato et al., 2002; Sokolov and Rintoul, 2009).
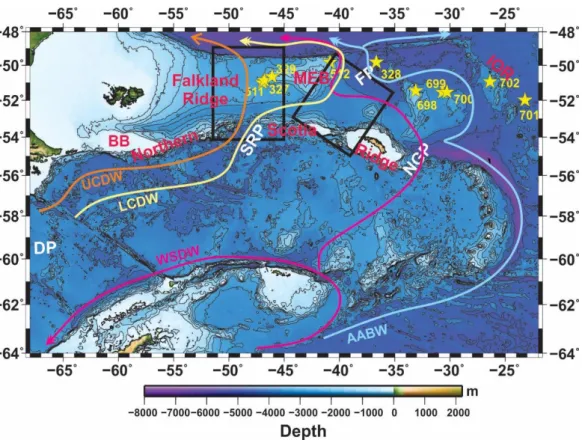
Fig. 3.1 Bathymetric map of the Drake Passage (DP), the Scotia Sea, and the Falkland Plateau (Smith and Sandwell, 1997). The arrows schematically show the present pathways of Upper Circumpolar Deepwater (UCDW), Lower Circumpolar Deepwater (LCDW), Weddell Sea Deep Water (WSDW), and Antarctic Bottomwater (AABW). The yellow stars show the locations of DSDP Leg 36 Sites 327, 238, and 329 and Leg 71 Sites 511 and 512 as well as ODP Leg 114 Sites 698, 699, 700, 701, and 701 (Ciesielski and Weaver, 1980; Shipboard_Scientific_Party, 1977, 1988). BB= Burdwood Bank, FP= Falkland Passage, IOR= Islas Orcadas Rise, MEB= Maurice Ewing Bank, NGP= North Georgia Passage, SRP= Shag Rock Passage.
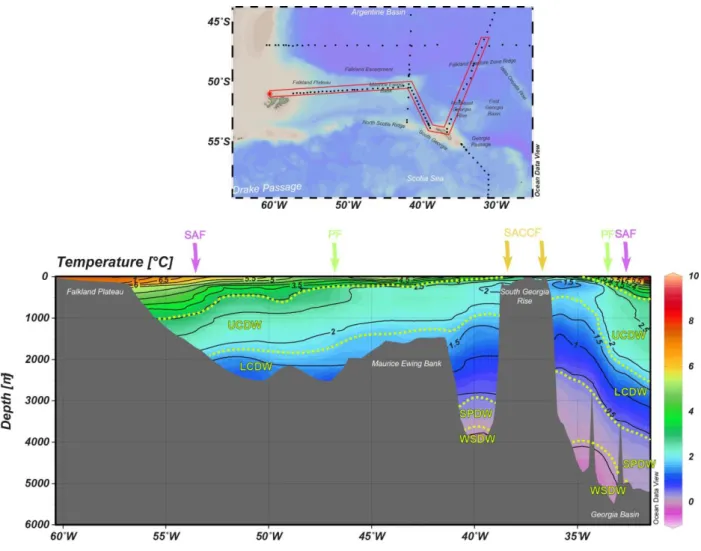
Fig. 3.2 Temperature profile across the Falkland Plateau showing the different water masses, LCDW=
Lower Circumpolar Deepwater, UCDW= Upper Circumpolar Deepwater, SPDW= Southern Pacific Deepwater, WSDW= Weddell Sea Deepwater. PF= Polarfront, SACCF= Southern ACC Front, SAF= Subantarctic Front. Generated using Ocean data View (Schlitzer, 2013).
Objective 2: Pre-site survey for developing a full IODP proposal built on IODP 862-Pre IODP preliminary proposal 862-Pre (PIs Westerhold and Bohaty) proposes to drill a depth transect of Paleogene sites in the subantarctic South Atlantic Ocean on the eastern Falkland Plateau (Maurice Ewing Bank and Georgia Basin). In the modern ocean, this is a critical area for deep- water mixing and communication between the Pacific and Atlantic oceans across the Drake Passage, with local bathymetry controlling the dispersal and propagation of deep- and bottom- waters throughout the Atlantic. Proposal 862-Pre intends to recover a composite of Paleogene sections spanning an extensive range of palaeo-water depths (~500-4500 m). The primary focus will be on determining the timing and variability of shallow- and deep-water connectivity across the Drake Passage and testing whether the onset of a proto-Antarctic Circumpolar Current (ACC) circulation had a direct impact on high-latitude and global climate evolution. The drill cores will provide crucial insight on the long-standing question of the relative influence of atmospheric pCO2
drawdown vs. Southern Ocean gateways in driving Paleogene climate evolution. The target sites will be positioned to assess the relationships between local tectonic subsidence of deep-water barriers, high-latitude climate change, and the onset of bottom-water production in the Weddell Sea and northward propagation into to the deep western Atlantic. This development along with the onset of the ACC circulation fundamentally altered Cenozoic ocean circulation in the Atlantic.
This way new light will be shed on climate change, biotic shifts, and deep-sea chemistry during the Paleogene, allowing evaluation of: (i) the magnitude of temperature change and response of high-latitude plankton groups across transient 'greenhouse' events, (ii) the initiation of southern high latitude cooling and onset of Antarctic Peninsula glaciation during the middle Eocene–early Oligocene 'greenhouse' to 'icehouse' transition, and (iii) variation in the Calcite Compensation Depth in the South Atlantic and its relation to changes in global carbon cycling.
One of the challenging elements of high latitude Southern Ocean palaeoceanography is site selection. In order to choose sites, where a sedimentary column appropriate to achieve the goals of a full IODP proposal can be drilled, high-resolution seismic data were needed. Based on the new seismic data collected during cruise MSM81 primary drill sites and several alternate sites have to be determined, which will be important if there is poor recovery due to chert or other drilling challenges. We collected a set of seismic profiles, which have covered the locations of piston cores collected druing cruise DY087 with HMS Discovery in 2018 (chief scientist Dr. S Bohaty, Southampton).
3.2 Agenda of the Cruise
The main objective of cruise MSM81 was the collection of high resolution seismic reflection data to identify sedimentary structures shaped by deep and bottom water masses. To prepare for the cruise an environmental impact assessment was carried out by BMT UK 2 Ltd. This EIA comprised an evaluation of all noise sources during the cruise: the seismic sources, the vessel itself, Parasound, and the multibeam system EM 122. Noise predictions have been undertaken for the proposed geophysical survey between Falkland Islands and South Georgia waters and applied to the latest published international thresholds (NMFS, 2016 and 2018a). The results indicated that none of the applicable injury thresholds would be breached outwith approximately 150 m from the operation. Animals may be within around 800 m of the source. A mitigation zone of 500 m was found to be appropriate to control the risks from underwater noise. The JNCC protocol has been designed to apply to distances of this magnitude in order to reduce the risk of injury to marine mammals to negligible levels. Furthermore, below mitigation measure were suggested:
Deploying a marine mammal observer;
Maintain a 500 m mitigation zone;
Avoiding starting piling at night or in poor visibility (unless further mitigation such as PAM is provided);
Searching for animals in the mitigation zone for a minimum of 60 minutes before starting, to allow for deep-diving species to surface;
Waiting for 20 minutes after the last observation of mammals in the mitigation zone;
Apply a 20-minute soft start to the seismic airgun, e.g., by increasing from one gun up to four;
Repeat the process if there is a break of over 10 minutes;
If line changes are expected to take longer than 40 minutes, firing is to be terminated at the end of the survey line and the mitigation process repeated; and
Report the activity and any observations using the standard format.
Additionally, applications for an environmental permit were handed in to the authorities of the Falkland Islands and South Georgia. Those permits were issued.
We hired two independent Marine Mammal Observers from SFF to watch out for marine mammals prior and during seismic profiling. Their report will be filed after completion of the cruise. Our streamer system has also included a Passive Acoustic Monitoring (PAM) system, Quiet Sea™ by Sercel. This supported the MMOs and allowed line changes during night.
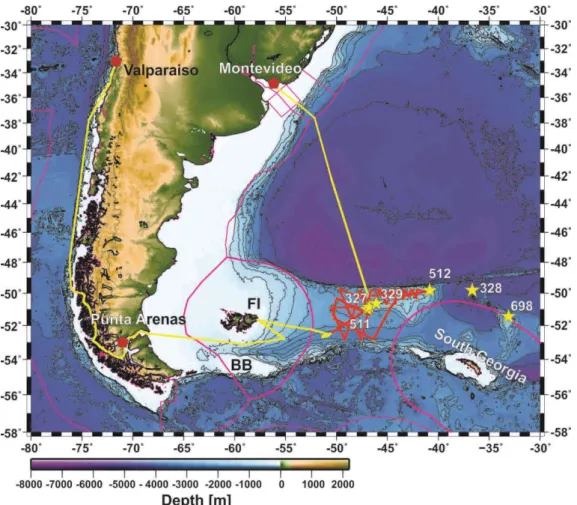
Fig. 3.1 Track chart (yellow lines) of cruise MSM81. Bathymetry from Smith and Sandwell (1997). Red lines show the seismic profiles collected on the Falkland Plateau. Pink lines show the boundaries of the EEZs.
4 Narrative of the Cruise (G. Uenzelmann-Neben1)
1AWI
The final preparations for cruise MSM were carried out on board RV MARIA S MERIAN. 18 Scientists embarked in Valparaiso on February 2 and unloaded containers. The set-up of the seismic sources and the recording system began. RV MARIA S MERIAN left port on February 3 at appr. 18:40 to head south. Set-up of the seismic equipment continued during February 4 to 8. On February 8 RV MARIA S MERIAN arrived in Punta Arenas to bunker. Here, two technicians from Sercel, who had assisted in installing new parts of the seismic recording system, left, while an Argentine coastal state observer was welcomed on board. The vessel left the port on February 9 at 9:00 to head into the working area on the Falkland Plateau. During this transit preparations for the seismic sources to be used during MSM82 started.
RV MARIA S MERIAN entered Argentine waters on February 9 at 18:30, and the recording of EM 122 and Parasound started. The transit into working area continued, entering the Argentine EEZ and entering the EEZ of the Falkland Islands on February 10 at 9:55, but was interrupted on February 11 due to the emergency disembarkment of one person. We then set course for Port Stanley, Falkland Island to allow the crewman to fly home. After the crewman disembarked on late evening February 11 we continued our transit into the working area. We left the EEZ of the Falkland Islands on February 12 at 16:27.
At 22:00 February 12 we reached our area of investigation. We then obtained a sound velocity profile to calibrate both EM 122 and Parasound. Since the weather had severely deteriorated, we had 9 bft and 6 m waves, we postponed the deployment of the seismic gear to the next morning.
The wind still was very strong (8-9 bft) but the waves only reached 5 m and deployment was easier in daylight. We continuously collected seismic data. Repairs were carried out on February 21st, March 2nd, and March 6th,which generated short losses in data acquisition. Since we did not stop we could not collect additional sound velocity profiles using the SVP device but employed XSVs instead, which can be used during seismic profiling.
At 16:00 on March 10 we reached the end of line AWI-20190030 and stopped the collection of seismic and Parasound data. We retrieved airguns and streamer and set course for Montevideo.
We stopped the bathymetric recordings at 22:00 on March 13th. We arrived in Montevideo on March 15 2019 at 8:30.
5 Preliminary Results
5.1 Seismic Reflection Profiling
(G. Uenzelmann-Neben1, P. Andreas1, R. Beckmann1, T. Eggers1, N. Lensch1, A.
Nüsse1, A.K. Petersen1, A. Pfeiffer1)
1AWI
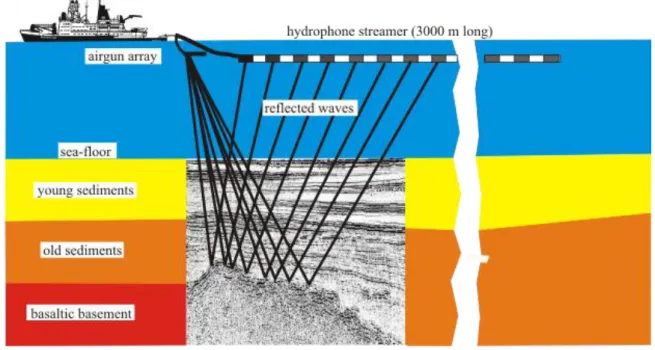
The application of seismic methods was one of the primary operational objectives of MSM81 in order to obtain information on the structure and sedimentary distribution in the area of the Falkland Plateau. We used a standard multi-channel seismic reflection technique to image the outline and reflectivity characteristics of the sedimentary layers and the structure of the sub-sedimentary basement and lower crust by recording the returning near-vertical wave field. Figure 5.1 illustrates the principles of this technique.
5.1.1 Seismic Equipment (T. Eggers1)
1AWI
5.1.1.1 Seismic Sources, Activation and Timing
We used a cluster of 4 GI-guns to resolve the sedimentary layers. A single GI-Gun is made up of two independent air guns within the same body. The first air gun (“Generator”) produces the primary pulse, while the second air gun (“Injector”) is used to control the oscillation of the bubble produced by the “Generator”. We used the “Generator” with a volume of 0.72 liters (45 in3) and fired the “Injector” (1.68 liters = 105 in3) with a delay of 33 ms. This leads to an almost bubble-
free signal. The guns were towed 20 m behind the vessel in 2 m depth and fired every 25 m (10 s shot interval).
The activation of the airguns occurs through a gun controller (Teledyne BigShot). The controller provides the power necessary to activate the valves of the guns. With an optional feedback signal from extra hydrophones, the controller is capable of synchronizing the activation of each gun automatically. This ensures that the complete gun array fires at the same time. The gun controller itself waits for the fire order (TTL signal) of the navigation system.
Seismic data acquisition requires a very precise timing system, because seismic sources and recordings systems must be synchronised. All the systems are synchronised through a dedicated GPS clock with an accuracy of 1µs.
Fig. 5.1 Principle of marine seismic reflection surveying.
5.1.1.2 Navigation and Triggering
For planning the lines and performing the line shooting, we are using a separate navigation system (Sercel SeaPro Nav). From ship side, we get NMEA strings for the ship position, heading, water depth and speed through water. Depending on the actual plan, the navigation system calculates the next shot point as defined by the shot parameters (shot distance, time or a combination of both) and generates the fire order for the air guns. After each successfully performed shot, the navigation system generates a navigation header file and transfers it to the acquisition system. This file uses the SEAL acquisition system to generate the final SEGD file for this shot point.
5.1.1.3 Multi-Channel Reflection Recording System
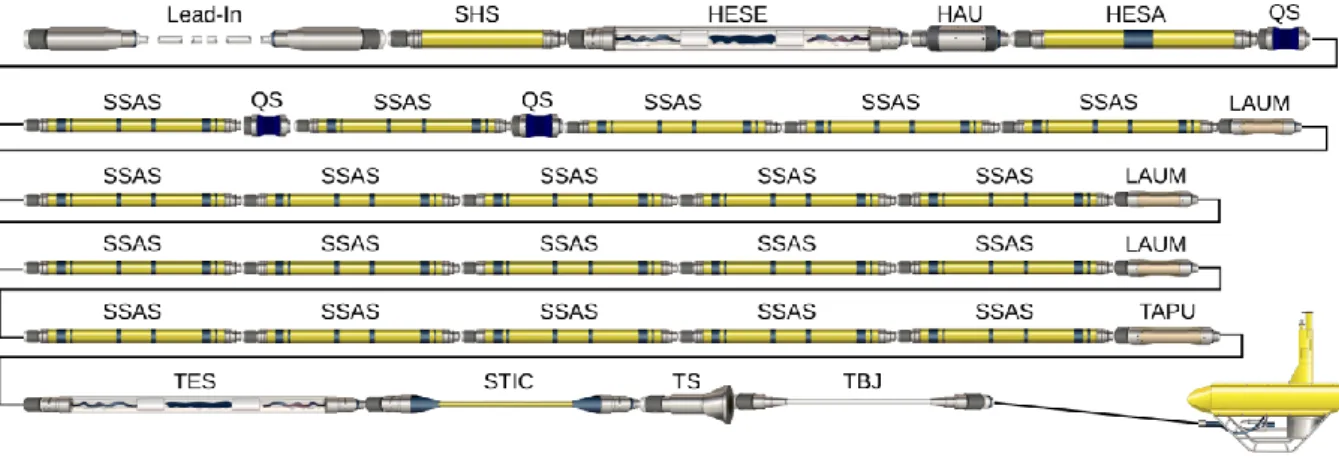
For multi-channel reflection data acquisition, a complete digital seismic streamer and recording system was used. The system consists of a large capacity, fully integrated, high resolution marine seismic data acquisition system (Sercel SEAL ) (Fig. 5.2). The streamer is a 240-channel hydrophone array, composed of 20 active sections with 12 channels each. Each channels consists of 8 hydrophones placed in an array. The spacing of each hydrophone array is 12.5 m (Table 5.1).
The streamer is coupled to the on-board recording system via a fiber-optic tow leader and a deck lead. The data collected by the hydrophone array is firstly converted from an analogue signal to digital via a Field Digitizing Unit (FDU2F). The data is available as a 24-Bit word with a sample rate of 1, 2 or 4 ms and then routed through a Line Acquisition Unit Marine (LAUM). After filtering and compressing the data, the LAUM sends them to the on-board equipment. The LAUM also supplies power for the FDU2F, and they are located after every 5 active sections.
The interface to the on-board equipment is the Deck Cable Crossing Unit (DCXU). It has a build- in high-voltage power supply for powering all the streamer modules and acts as a LAUM for first 60 channels.
The main software is installed on a server running Linux Operating System mounted with the other components in a mobile rack. It manages the flow of acquired data from the streamer and auxiliary channels. It also manages processing of the data and export to various peripherals (FC- AL tape drives, NFS disks, plotters, QC tools). Communications and synchronization with the navigation system are ensured via Ethernet links or a T0 signal. Communications with DCXU- 428s are ensured via Ethernet links too, therefore the server can manage a virtually unlimited number of DCXU-428s (streamers). The system and all parameters for acquisition are displayed and controlled on a separate client pc with a graphical user interface (GUI).
The acquisition runs in continuous mode and the final SEGD file for a shot point will be generated according to the navigation header file, received from the navigation system. The final SEGD file is stored on the server and exported simultaneously to two Network Attached Storage (NAS) with a capacity of 5 TB each. The actual SEGD for the last shot point is also available for the QC-Software running on a separate client. With this software, it is possible to have a first look on the data for quality control.
Fig. 5.2 Setup of the seismic data acquisition.
5.1.1.4 Depth Control and Positioning
With depth control units, called birds, we can control the depth of the streamer cable during operation. We use Model 5010/5011 DigiBIRD and CompassBIRD II from ION, controlled by Digicourse software, for this purpose. Nominal depth of the streamer cable in calm weather conditions is 10m. The depth can be changed during operation by setting new target depths for
each bird through the controller software.The actual depth and heading (only Model 5011 DigiBIRD and CompassBIRD II) of each bird is available for the navigation system and will be stored for every shotpoint.
5.1.1.5 Passive Acoustic Monitoring
We use QuietSea from Sercel for passive acoustic monitoring. The system can detect vocalizations emitted by marine mammals. These signals are of two types: whistles and click trains. The whistles are particular vocalizations emitted to communicate between marine mammals in the same group or are parts of a song call emitted by specific baleen whale males.
The clicks are impulsive signals (from approximately ten microseconds to few milliseconds) and so cover a great bandwidth. The bandwidth covered by clicks can be highly variable depending on the species.
The system uses the seismic data (using the SEAL interface) to detect vocalizations in the seismic bandwidth (from 10 Hz to 200 Hz with usual seismic sampling frequency of 2ms). It also uses dedicated streamer modules and auxiliary modules to detect localizations in the [200 Hz-96 kHz] bandwidth.
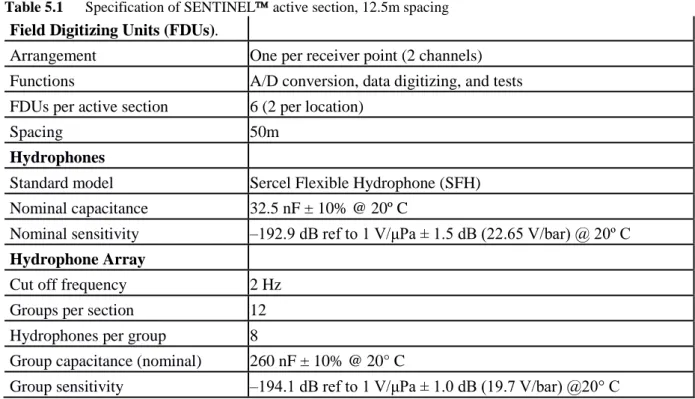
Table 5.1 Specification of SENTINEL active section, 12.5m spacing Field Digitizing Units (FDUs).
Arrangement One per receiver point (2 channels) Functions A/D conversion, data digitizing, and tests FDUs per active section 6 (2 per location)
Spacing 50m
Hydrophones
Standard model Sercel Flexible Hydrophone (SFH) Nominal capacitance 32.5 nF ± 10% @ 20º C
Nominal sensitivity –192.9 dB ref to 1 V/μPa ± 1.5 dB (22.65 V/bar) @ 20º C Hydrophone Array
Cut off frequency 2 Hz
Groups per section 12
Hydrophones per group 8
Group capacitance (nominal) 260 nF ± 10% @ 20° C
Group sensitivity –194.1 dB ref to 1 V/μPa ± 1.0 dB (19.7 V/bar) @20° C
The data were recorded with the following parameters (also Appendix B):
Table 5.2 Brief description of seismic recording parameters.
Profile Name Active Length Lead-in Record Length Sample Rate
AWI-20190001 3000 m 141.4 m 9 s 1 ms
AWI-20190002 3000 m 141.4 m 9 s 1 ms
AWI-20190003 3000 m 141.4 m 9 s 1 ms
AWI-20190004 3000 m 141.4 m 9 s 1 ms
AWI-20190005 3000 m 141.4 m 9 s 1 ms
AWI-20190006 3000 m 141.4 m 9 s 1 ms
AWI-20190007 3000 m 141.4 m 9 s 1 ms
AWI-20190008 3000 m 141.4 m 9 s 1 ms
AWI-20190009 3000 m 141.4 m 9 s 1 ms
AWI-20190010 3000 m 141.4 m 9 s 1 ms
AWI-20190011 3000 m 141.4 m 9 s 1 ms
AWI-20190012 3000 m 141.4 m 9 s 1 ms
AWI-20190013 3000 m 141.4 m 9 s 1 ms
AWI-20190014 3000 m 141.4 m 9 s 1 ms
AWI-20190015 3000 m 141.4 m 9 s 1 ms
AWI-20190016 3000 m 141.4 m 9 s 1 ms
AWI-20190017 3000 m 141.4 m 9 s 1 ms
AWI-20190018 3000 m 141.4 m 9 s 1 ms
AWI-20190019 3000 m 141.4 m 9 s 1 ms
AWI-20190020 3000 m 141.4 m 9 s 1 ms
AWI-20190021 3000 m 141.4 m 9 s 1 ms
AWI-20190022 3000 m 141.4 m 9 s 1 ms
AWI-20190023 3000 m 141.4 m 9 s 1 ms
AWI-20190024 3000 m 141.4 m 9 s 1 ms
AWI-20190025 3000 m 141.4 m 9 s 1 ms
AWI-20190026 3000 m 141.4 m 9 s 1 ms
AWI-20190027 3000 m 141.4 m 9 s 1 ms
AWI-20190028 3000 m 141.4 m 9 s 1 ms
AWI-20190029 3000 m 141.4 m 9 s 1 ms
AWI-20190030 3000 m 141.4 m 9 s 1 ms
5.1.1.6 First Results
(G. Uenzelmann-Neben1)
1AWI
The seismic grid was set up to image the structure of both basement and sedimentary rocks on the Falkland Plateau as well as the channel south of the plateau. Because of the size of the Falkland Plateau and the published pathways of Upper and Lower Circumpolar Deepwater (UCDW, LCDW) we concentrated our seismic profiling on the western flank of the Maurice Ewing Bank, which forms a high on the eastern plateau, and the slight depression west of it. This allowed a direct correlation with results from DSDP Leg 36 Sites 327, 329, and 330 and DSDP Leg 71 Site 511 (Fig. 5.3). Additionally, we covered the locations of several potential site for IODP proposal 862, where gravity cores were during expedition DY087 with HMS Discovery (Chief Scientist Dr.
S. Bohaty, Southampton). In total, 30 seismic profiles were gathered across the Falkland Plateau (Fig. 5.3).
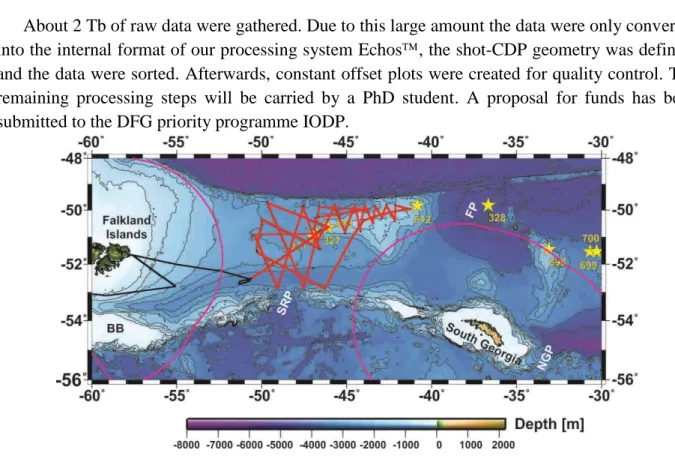
About 2 Tb of raw data were gathered. Due to this large amount the data were only converted into the internal format of our processing system Echos, the shot-CDP geometry was defined, and the data were sorted. Afterwards, constant offset plots were created for quality control. The remaining processing steps will be carried by a PhD student. A proposal for funds has been submitted to the DFG priority programme IODP.
Fig. 5.3 Bathymetric map of the Falkland Plateau showing the locations of the collected seismic profiles (red lines) and of DSDP Leg 36 Site, 327, 328, 329, and 330, and Leg 71 Site 511 and 512 (yellow stars).
Also shown are the locations of ODP Leg 114 Sites 698, 699, and 700. The magenta lines show the boundaries of the Falkland Islands’ EEZ and the EEZ of South Georgia. BB= Burdwood Bank, FP=
Falkland Passage, NGP= North Georgia Gap, SRP= Shag Rock Passage.
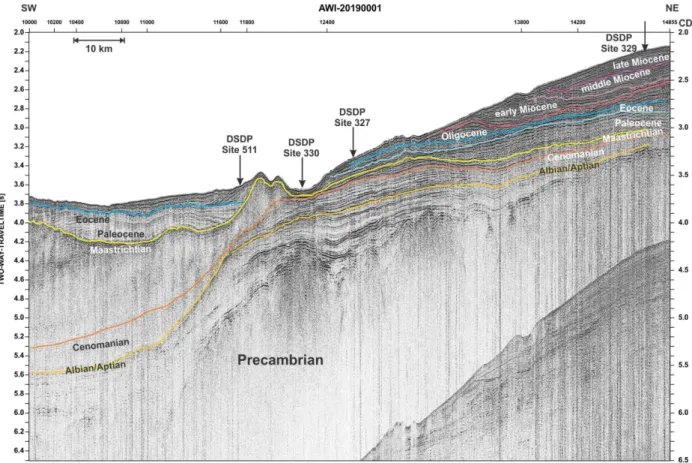
The seismic data are of excellent quality. Although using only small sources (four GI-guns with a total volume of 9.6 l) the seismic signals have penetrated up to 3 s TWT (3 km) of the sedimentary column. With our first seismic profile we crossed all four sites drilled on the western MEB (Figs. 5.3 and 5.4). We also crossed Site 511 with lines AWI-20190008, Site 327 with lines AWI-2019004 and -20190005, and Site 329 with line AWI-20190002. This enabled a first tentative correlation of observed seismic reflections with ages derived at the drill sites. In general, the seismic data across the whole of the plateau show a number of distinct horizons and erosional unconformities, e.g., the Eocene/Oligocene boundary, the top Maastrichtian, the Albian/Aptian boundary (Fig. 5.4). The top of the Precambrian basement also is imaged very well. Additionally, several prominent reflections between the Cenomanian and Maastrichtian horizons can be observed (Fig. 5.5).
The central Falkland Plateau appears to be underlain by a number of Precambrian highs, which are imaged up to the Maastrichtian reflection (Fig. 5.5). Those basement highs sometimes are wide but in some cases appear quite narrow, e.g., towards to the Maurice Ewing Bank (see Fig. 5.5).
Those narrow basement highs may point towards a tectono-magmatic reactivation of the plateau.
The southern flank of the plateau is characterised by an outer high imaged up to the Albian/Aptian.
The Maastrichtian sequences also are characterised by local highs (e.g., Fig. 5.4). Those sometimes are cone-shaped, and can be found on the Falkland Plateau and the MEB (Fig. 5.5, see near location of DSDP Site 327).
Fig. 5.4 Part of seismic reflection profile AWI-20190001 showing the locations of DSDP Leg 36 Site, 327, 329, and 330, and Leg 71 Site 511. A tentative correlation with ages derived at the drill sites allowed a first dating of the reflections.
Fig. 5.5 Seismic reflection profile AWI-20190004 across the Falkland Plateau. Note the channel in the South. Site 327 was crossed in the North.
The sequence between the Cenomanian and the Maastrichtian reflections is characterised by a thick sediment wedge. At a first glance this may be interpreted as a sediment drift, which would indicate overflow activity already in late Cretaceous times. Further careful analysis is needed after the data have been fully processed.
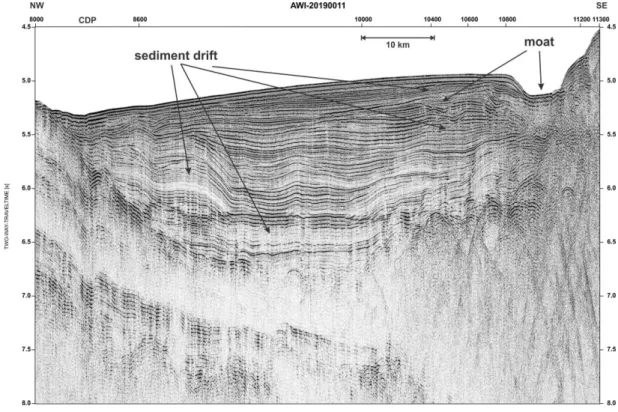
Fig. 5.6 Part of seismic reflection profile AWI-20190011 across the channel south of the Falkland Plateau.
Several sediment drifts and moats can be observed.
The central Falkland Plateau in general shows erosion, especially the Paleogene/Neogene sequences appear to be affected strongly. Several phases of drift formation can be identified in the Palaeogene/Neogene sequences separated by erosional unconformities, which lie disconformably on the Maastrichtian horizon (Figs. 5.4 and 5.5). This is an indication for intensified current activity in Paleogene/Neogene times.
South of the Falkland Plateau a channel can be observed, which appears to have its base in the late Cretaceous (?) (Figs. 5.5 and 6.5). This channel is filled with sedimentary sequences, which have been shaped into sediment drifts. Those different drifts indicate a relocation of the shaping water mass (Fig. 5.6). Taking into account the water depth ( 3800 m) the shaping water mass is suspected to be South Pacific Deepwater and/or Weddell Sea Deepwater.
As can be seen in Figs. 5.4. and 5.5., the Precambrian basement rises towards the Maurice Ewing Bank. A first interpretation of the seismic profiles collected across the MEB points towards a basement high, possibly a ridge, which underlies the bank. This high is wider in the West and narrower in the East. Sedimentary sequences are attached to the ridge from the North and the South. West of 43° W a basin is formed north of the basement high. This basin is filled with sedimentary sequences, which are pulled-up and/or shaped into drifts (Fig. 5.7). The sequences are thin over the northern flank of the basement high, while another set of sediment drifts is formed attached from the South. The different depth ranges (above and below 2000 m), in which the sets
of sediment drifts occur, point towards formation by UCDW (< 2000 m) and LCDW (> 2000 m), both obviously recirculated due to the topography of the MEB.
Summarising, the dataset is of excellent quality and images both tectonic structures as well as current controlled sedimentary features. Several lines of interpretation ranging from tectono- magmatic reactivation of the plateau in the late Cretaceous to activity and relocation of pathways of deep water masses are possible. This will provide further information about the development of this important part of the South Atlantic, where the tectonic development has had strong implications for the exchange of water masses and thus the development of the climate.
Fig. 5.7 Seismic reflection profile AWI-20190021 across northern Maurice Ewing Bank. Several sediment drifts can be observed.
5.2 Sediment Acoustics / Sub-Bottom Profiling (T. Westerhold1, A.-D. Ramadan2, R. Reuter2)
1MARUM
2AWI
During MSM81 cruise the parametric sub-bottom profiler PARASOUND was applied to image the upper 200m of sediment drape below the ship track.
5.2.1 Technical Description
The hull-mounted parametric echo sounder system PARASOUND DS3 (P70) was developed by TELEDYNE ATLAS HYDROGRAPHIC GmbH. In order to achieve high lateral resolution and image small-scale structures on the seafloor PARASOUND utilizes the parametric effect.
Simultaneously transmission of very high (finite) amplitude sound waves of slightly different frequencies, the primary high frequencies, will create harmonic sound waves at different low and high secondary frequencies. Advantage of this approach is that a secondary low frequency signal can travels within the narrow ~4.5° beam of the primary signal allowing a higher lateral resolution and imaging of small-scale structures on the seafloor superior to conventional systems. Directly emitting a low frequency signal with e.g. 4 kHz from the same transducer would produce a ~30°
broad beam with much lower resolution. In the PARASOUND system a fixed Primary High Frequency (PHF) can be set between 18 and 33 kHz to form Secondary Low Frequency (SLF) signals with frequencies from 0.5 to 6.0 kHz. The parametric echo sounding transducer transmits highly linear signals with 70 kW transmission power to achieve a maximum penetration depth of about 200 m in soft sediments.
5.2.2 Data Acquisition
PARASOUND sub-bottom profiling data were acquired almost continuously from 09th of February, 21:34 UTC to the 10th of March 2019, 19:02 UTC. To generate a parametric sub-bottom profiler Secondary Low Frequency (SLF) of 4 kHz the first Primary High Frequency (PHF) was set to 19.8 kHz, resulting in a second PHF of ~23.8 kHz. The system was operated in quasi- equidistant pinging mode (multiple pulses in the water column) with 140 Volt Transmission Voltage, except for shallow shelf areas where single pulse mode was applied. Incoming data were stored in ASD-, SEGY- and PS3-files. PHF signal and rarely Kongsberg EM122 multibeam depth was used for seafloor detection.
Fig. 5.8 Facies type one: hummocky surface with up to 15 m of penetration on Falkland Plateau. Shown is the SLF on seismic line AWI20190009 acquired on the 25th of February 2019 between 20:45 to 24:00 UTC (SP=shotpoint).
PARASOUND was switched off inside the 12 mile zone from 11.02.19 23:53 UTC to 12.02.19 03:36 UTC sailing in and out of Stanley for MedEvac. The system was switched to standby during deployment of a sound velocity profiler 13.02.19 00:54 UTC to 13.02.19 03:20 UTC. SLF data
(4 kHz) were acquired during the entire cruise and stored both in ASD and PS3 format. PS3 data were then converted to *.sgy-files using the ps32sgy tool (written by Hanno Keil, University of Bremen) and imported into IHS Kingdom® for visualization and quality control.
5.2.3 Sediment Acoustics Preliminary Results
During MSM81, three different types of seismic facies were observed:
Fig. 5.9 Facies type two example: thick packages of planar sediment layers with more than 100 m of penetration in the Falkland Trough region. Shown is the SLF on seismic line AWI20190012 acquired on the 28th of February 2019 between 08:04 to 12:04 UTC.
Facies type one is characterized by low penetration of the PARASOUND signal. During MSM81 two varieties of low penetration have been observed: one with a hard surface with less than 10 m penetration, and another with a hummocky surface with up to 15 m of penetration (Fig.
5.8). The latter is commonly found on the Falkland Plateau area where sediment deposition was very low during the Neogene. Hard surfaces are observed at steeper slopes into the Falkland Trough and on the northern flank of Maurice Ewing Bank.
Facies type two consists of thick packages of planar sediment layers with deep penetration of the PARASOUND signal. This facies was observed in the Falkland Trough and the Northeastern Maurice Ewing Bank Basin where large drift sediment bodies with a penetration of more than 100 meters were encountered (Fig. 5.9).
Facies type three is characterized by deep penetration showing multiple generations of well layered sediment packages with discordant contacts. In some places slightly deformed sedimentary layers can be images by the subbottom profiler revealing tectonically related internal structures (Fig. 5.10). This facies type occurred mainly on the southern flank and on top of Maurice Ewing Bank.
Fig. 5.10 Facies type three example: thick packages of planar sediment layers with discordant contact and deep of penetration on the southern flank of Maurice Ewing Bank. Shown is the SLF on seismic line AWI20190013 acquired on the 1st of March 2019.
5.3 Bathymetry
(J. Geils1, S. Andree1, L. Knopp1)
1AWI
One of the most important measurements in marine science obviously is the water depth. For investigations of the water column, the seafloor and the subseafloor the size of the water body has to be known. To gain these values echosounders are used. The overall principle is quite simple.
Acoustic energy is transmitted down through the water and the returning echo from the seafloor is recorded. The product of the sound velocity with the travel time gives the distances of the sounder to the seafloor (remember the signal travels through the water column twice). Speaking generally, one transmitter and one receiver are sufficient for the vertical ray path. This means one depth measurement vertically beneath the vessel. Such a device is a so called singlebeam echosounder (SBES). To derive more extensive information a more complex arrangement of transmitters and receivers needs to be used. These multibeam echosounders (MBES) are based on two transducer chains: one transmitting the acoustic pulse (aligned along the vessel), one receiving the echo (aligned across the vessel). Transmitting the signal with multiple transducers leads to interference within the water – a signal forms which is very narrow along ship and wide across ship. Due to this fact rays also leave the transducer under an angle. The point information of a SBES is augmented to a line information for a MBES (sampled discreetly). The incoming echos are then differentiated by the receiving transducer chain via time delays. A vessel moving forward can therefore map an area.
During cruise MSM81 bathymetry measurements were conducted due to add to the sparse MBES data on the Falkland Plateau. Furthermore, an exact depth information is very useful in
combination with the acquired seismic data. For those reasons the measurements started at 9th February 2019 21:32 UTC and ended at the 13th of March 2019 22:00 UTC. The acquisition was continuous. Only for station work (SVP) or due to technical issues the devices was turned off shortly.
Fig. 5.11 Sound Velocity Profiles measured during MSM81. All profiles are extended to 12000 m water depth (necessary for SIS, v12000=1675.8 m/s).
5.3.1 System Overview
On board on RV MARIA S. MERIAN the hull-mounted MBES Kongsberg EM122 was used. This deep sea echosounder has got a measuring range from 20 to 11000 m and uses frequencies from 11.25 to 12.6 kHz depending on the measuring sector. For one ping 864 depth values are calculated. The vertical resolution is 10 to 40 cm (theoretically) and horizontally 2° x 2° per beam.
The transducers are, as mentioned above, aligned perpendicular to each other (mills cross) and have got a length of 8 m each. The time, position and motion data coming from the Kongsberg Seapath system is fed directly into the Processing Unit of the MBES. Based on that, the system is able to compensate Pitch and Yaw angles of 10° and Roll angles of 15° in real-time. The opening
angle is up to 150°. However this angle was reduced to 130° in shallow water and 120° in deep water to get satisfactory results in the outer beams too. The MBES was operated with the software Seafloor Information System (SIS) from Kongsberg.
5.3.2 Sound Velocity Measurements
Apart from the echo travel time the sound velocity is the second important parameter to gain an exact depth value with a correct positioning. Starting with the vertical ray path but especially for the oblique ray paths (refraction within the water column, Snellius’s law) this second information is mandatory. During MSM81 Sound Velocity Profiles (SVP’s) were provided in three different ways.
The highest accuracy was achieved by the AML Applied Microsystems SV PlusX. This is a probe which measures the sound velocity directly via a small pinger while it is attached to a ship’s wire with a forerunning weight. Therefore the ship has to be on station to retrieve an SVP. When not possible to stop, a SVP was provided via the Lockheed-Martin Sippican XSV. The single-use XSV is launched from the aft of the ship and provides online information of the sound speed via a glass-fibre wire while falling through the water column. For the transits to/from the working area and for the case that there was too much turbulence in water behind the vessel to launch an XSV, synthetic SVP’s from the WorldOceanAtlas 2013 were used. Figure 5.11 shows the measured data (AML and XSV) during MSM81. The position and date of each SVP, also the synthetic ones, are listed in Table 5.3.
In order to handle the SVP’s from different sources, the SoundSpeedManager (SSM) served as a platform. With the help of this program the profiles were smoothed and extended down to 12000 m (compulsory for SIS) and exported as .asvp. Subsequently, the profiles were applied in SIS.
Table 5.3 Sound Velocity Stations during MSM81.
Bathymetry
Station Official Station Station
Type Date UTC Longitude [°] Latitude [°]
SVP01 X WOA13 2019-02-09 21:30 -60.00000000 -52.71666600
SVP02 X WOA13 2019-02-11 07:15 -54.00000000 -52.71821667
SVP03 X WOA13 2019-02-11 22:45 -56.00000000 -51.89085000
SVP04 MSM81_1-1 AML 2019-02-13 03:00 -50.70638330 -52.54156667 SVP05 MSM81_4-1 XSV 2019-02-14 22:00 -47.42805000 -51.19458333
SVP06 X WOA13 2019-02-14 19:30 -46.97170000 -51.00470000
SVP07 X WOA13 2019-02-16 04:30 -47.70697154 -50.25092205
SVP08 X WOA13 2019-02-17 14:50 -48.88885065 -50.95042881
SVP09 X WOA13 2019-02-18 10:20 -47.61580958 -52.53549768
SVP10 X WOA13 2019-02-19 20:30 -46.94137501 -50.86856402
SVP11 X WOA13 2019-02-20 21:00 -50.32665747 -50.99406128
SVP12 X WOA13 2019-02-22 23:30 -49.19250480 -52.56101792
SVP13 MSM81_10-3 XSV 2019-02-23 00:00 -48.53106800 -51.60622700
SVP14 X WOA13 2019-02-23 23:30 -47.63077865 -49.95550231
SVP15 MSM81_13-1 XSV 2019-02-24 17:00 -46.96865200 -51.00843100
SVP16 X WOA13 2019-02-25 09:00 -48.18019730 -50.89039057
SVP17 MSM81_14-3 XSV 2019-02-26 12:00 -50.22333300 -51.01045600
SVP18 X WOA13 2019-02-27 10:00 -48.46333262 -52.14896914
SVP19 X WOA13 2019-02-28 08:00 -46.33065899 -52.76418987
SVP20 X WOA13 2019-03-01 05:00 -44.68889049 -51.02892427
SVP21 X WOA13 2019-03-02 14:00 -41.66173015 -49.91671343
SVP22 MSM81_21-3 XSV 2019-03-03 10:35 -42.38398400 -50.03378100
SVP23 X WOA13 2019-03-04 23:30 -43.93392115 -49.81911390
SVP24 X WOA13 2019-03-06 01:30 -44.50846826 -49.82613052
SVP25 X WOA13 2019-03-07 06:00 -45.72196576 -49.88767716
SVP26 X WOA13 2019-03-08 14:00 -46.97301033 -50.18429652
SVP27 X WOA13 2019-03-08 23:30 -46.29933479 -49.81250829
SVP28 MSM81_35-1 AML 2019-03-10 22:30 -46.85360000 -50.21910300
SVP29 X WOA13 2019-03-11 03:40 -47.47570156 -49.00101382
SVP30 X WOA13 2019-03-12 08:00 -51.05920890 -40.91200242
Fig. 5.12 MSM81 cruise plot. The acquired bathymetry, the position and type of SVP’s and the cruise track are shown.
5.3.3 Data Processing
For the acquired bathymetrical data (Kongsberg .all files), a processing flow was started. After the import into CARIS Hips and Sips the data was again sound velocity corrected with the CARIS algorithm. To do so, a file containing all used SVP’s is needed from the SSM. Then the algorithm uses the closest SVP for the correction. Afterwards, the across track position of each depth value
has to be merged with the navigational data to obtain a geographical position for each depth measurement. After that preparation the actual processing can start. First, the data is swath edited to recognize and delete outliers. Secondly, the files are edited with the help of the subset editor, a type of 3D-editor, for a more precise examination of the data. After that, gridding with different cell sizes take place and the results can be exported.
To plot the data, plan the SVP’s and to avoid doubling of MBES coverage with older cruises, the software QGIS was used.
Fig. 5.13 Depth distribution during MSM81. Bining = 100 m. Note: the deep values from 5000 to 6000 m are measured while transit to Montevideo in the Argentine Basin.
As an example of an interesting feature mapped during the cruise, Figure 5.14 shows the
“Barker Ridge” in the transition from the western Maurice Ewing Bank to the plateau. The data shows the structure to strike Northwest-Southeast and to be 50 km long (NW to SE), up to 13 km wide and about 200 m high. The middle part of the ridge shows two peaks in elevation. However, the northwest and southeast ends show only one bathymetrical high.
5.3.4 Preliminary Results
During MSM81 an area of about 150000 km² with a track length of about 8500 km was mapped.
Figure 5.12 shows the cruise track with the acquired data, the SVP’s and the GEBCO bathymetry in the working area. Figure 5.13 gives the depth distribution of the data. Also visible in this plot is the Falkland Plateau with its depths around 2400 to 3000 m. The second smaller peak from 1400 to 2000 m reflects the Maurice Ewing Bank. Depths values greater than 5000 m were acquired in the Argentine Basin.
6 Ship’s Meteorological Station
There was no meteorologist on board during cruise MSM81.
7 Station List MSM81 (G. Uenzelmann-Neben)
7.1 Overall Station List See Appendix A
7.2 Profile Station List See Appendix B
Fig. 5.14 Bathymetry of the “Barker Ridge” in the transition from the Maurice Ewing Bank (Northeast) to the plateau (Southwest).
8 Data and Sample Storage and Availability
All data collected during cruise MSM81 will form the base for a PhD project. This project will comprise the processing of the seismic data as well as the interpretation of the seismic, Parasound and multi-beam data to answer the questions raised under 3.1. A proposal has been handed in to the DFG priority programme IODP to acquire the funds for this PhD project.
The meta data for this cruise will be made publicly available immediately after the cruise. The raw and processed seismic data will be archived on the dedicated data server at AWI. Bathymetry and Parasound data as well as ADCP will be archived in PANGAEA.
Table 8.1 Overview of data availability
Type Database Available Free Access Contact
raw data ADCP PANGAEA Feb 2020 Feb 2021 gabriele.uenzelmann-
neben@awi.de
multibeam PANGAEA, BSH Feb 2023 Feb 2024 gabriele.uenzelmann- neben@awi.de
Parasound PANGAEA, BSH Feb 2023 Feb 2024 gabriele.uenzelmann-
neben@awi.de seismic AWI data archive Feb 2023 Feb 2024 gabriele.uenzelmann-
neben@awi.de
9 Acknowledgements
We like to thank Captain Ralf Schmidt, his officers and crew of RV MARIA S. MERIAN for their support of our measurement programme and for creating a very friendly atmosphere on board.
This cruise was provided by the Deutsche Forschungsgemeinschaft within the core programme METEOR/MERIAN. We also benefited from financial contributions by the research institutes involved. We gratefully acknowledge all this support.
10 References
Barker, P.F., Thomas, E., 2004. Origin, signature and palaeoclimatic influence of the Antarctic Circumpolar Current. Earth-Science Reviews 66, 143-166.
Ciesielski, P.F., Weaver, F.M., 1980. Neogene and Quaternary Paleoenvironmental history of Deep Sea Drilling Project Leg 71 Sediments, Southwest Atlantic Ocean. In: Ludwig, W.J., Krasheninnikov, V.A., et al. (Eds.), Initial Reports DSDP. U.S. Govt. Printing Office, Washington, pp. 461-477.
Coxall, H.K., Wilson, P.A., Paelike, H., Lear, C.H., Backmann, J., 2005. Rapid stepwise onset of Antarctic glaciation and deeper calcite compensation in the Pacific Ocean. Nature 433, 53-56.
DeConto, R.M., Pollard, D., Wilson, P.A., Pälike, H., Lear, C.H., Pagani, M., 2008. Thresholds for Cenozoic bipolar glaciation. Nature 455, 652-657.
Goldner, A., Herold, N., Huber, M., 2014. Antarctic glaciation caused ocean circulation changes at the Eocene-Oligocene transition. Nature 511 (7511), 574-577.
Koenitz, D., White, N., McCave, I.N., Hobbs, R., 2008. Internal structure of a contourite drift generated by the Antarctic Circumpolar Current. Geochemistry Geophysics Geosystems 9.
Livermore, R., Hillenbrand, C.-D., Meredith, M., Eagles, G., 2007. Drake Passage and Cenozoic climate: An open and shut case? Geochemistry Geophysics Geosystems 8.
Naveira Garabato, A.C., McDonagh, E.L., Stevens, D.P., Heywood, K.J., Sanders, R.J., 2002. On the export of Antarctic Bottom Water from the Weddell Sea. Deep Sea Research Part II:
Topical Studies in Oceanography 49 (21), 4715-4742.
Pagani, M., Zachos, J.C., Freeman, K.H., Tipple, B., Bohaty, S., 2005. Marked Decline in Atmospheric Carbon Dioxide Concentrations During the Paleogene. Science 309 (5734), 600- 603.
Pérez, L., Hernández-Molina, F.J., Esteban, F., Tassone, A., Piola, A., Maldonado, A., Preu, B., Violante, R., Lodolo, E., 2015. Erosional and depositional contourite features at the transition between the western Scotia Sea and southern South Atlantic Ocean: links with regional water- mass circulation since the Middle Miocene. Geo-Marine Letters 35 (4), 271-288.
Schlitzer, R., 2013. Ocean Data View. http://odv.awi.de.
Shipboard Scientific Party, 1977. Evolution of the Southwestern Atlantic Ocean Basin: Results of Leg 36, Deep Sea Drilling Project. In: Barker, P.F., Dalziel, I., Wise Jr, S.W., et al. (Eds.), Initial Reports DSDP. U.S. Govt. Printing Office, Washington, pp. 993-1014.
Shipboard Scientific Party, 1980. Site 511. In: Ludwig, W.J., Krasheninnikov, V.A., et al. (Eds.), Initial Reports DSDP. U.S. Govt. Printing Office, Washington, pp. 21-109.
Shipboard Scientific Party, 1988. Preliminary Results of Subantarctic South Atlantic Leg 114 of the Ocean Drilling Program. In: Ciesielski, P.F., Kristoffersen, Y., al., E. (Eds.), Proceedings of the Ocean Drilling Program, Initial Reports. US Government Printing, Washington, pp. 797- 803.
Smith, W.H.S., Sandwell, D.T., 1997. Global Sea Floor Topography from Satellite Altimetry and Ship Depth Soundings. Science 277, 1956-1962.
Sokolov, S., Rintoul, S.R., 2009. Circumpolar structure and distribution of the Antarctic Circumpolar Current fronts: 1. Mean circumpolar paths. J. Geophys. Res. 114.
Uenzelmann-Neben, G., Weber, T., Grützner, J., Thomas, M., 2017. Transition from the Cretaceous ocean to Cenozoic circulation in the western South Atlantic — A twofold reconstruction. Tectonophysics 716 (Supplement C), 225-240.
Zachos, J.C., Pagani, M., Sloan, L., Thomas, E., Billups, K., 2001. Trends, Rhythms, and Aberrations in Global Climate 65 Ma to Present. Science 292, 686-693.