Kerguelen Plateau Drift Deposits: outstanding high-resolution chronicle of Cenozoic climatic and oceanographic changes in the
southern Indian Ocean Cruise No. SO272
Jan 11 – March 4, 2020
Port Louis (Mauritius) – Cape Town (South Africa) Kerguelen Plateau Drifts
Dr Gabriele Uenzelmann-Neben
1(Chief Scientist) Dr. Thomas Westerhold
21
Alfred-Wegener-Institut Helmholtz-Zentrum für Polar- und Meeresforschung
2
MARUM
2020
Table of Contents
1 Cruise Summary ... 4
1.1 Summary in English ... 4
1.2 Zusammenfassung ... 4
2 Participants ... 6
2.1 Principal Investigators ... 6
2.2 Scientific Party ... 6
2.3 Participating Institutions ... 6
3 Research Program ... 7
3.1 Aims of the Cruise ... 7
3.2 Agenda of the Cruise ... 10
4 Narrative of the Cruise ... 11
5 Preliminary Results ... 12
5.1 Seismic Reflection Profiling ... 12
5.1.1 Seismic Equipment ... 12
5.1.1.1 Seismic Sources, Activation and Timing ... 12
5.1.1.2 Navigation and triggering ... 13
5.1.1.3 Multi-Channel Reflection Recording System ... 13
5.1.1.4 Depth Control and Positioning ... 14
5.1.1.5 Passive Acoustic Monitoring ... 14
5.1.2 First Results ... 16
5.2 Sediment Sampling ... 19
5.2.1 Gravity Corer ... 19
5.2.2 Multi Corer ... 21
5.2.3 Shipboard Results ... 22
5.3 Hydroacoustics ... 23
5.3.1 Scientific Objectives. ... 23
5.3.2 Bathymetry ... 24
5.3.2.1 Technical Description ... 24
5.3.2.2 Data Acquisition and Processing ... 25
5.3.2.3 Sound Velocity Profiles ... 25
5.3.2.4 Bathymetry Preliminary Results ... 27
5.3.2.5 Data Management ... 27
5.3.3 Sediment Echosounding ... 27
5.3.3.1 Technical Description ... 27
5.3.3.2 Data Acquisition ... 28
5.3.3.3 Parasound Preliminary Results ... 28
5.3.3.4 Data Management ... 30
5.4 Marine Mammal Observations ... 31
5.4.1 Introduction ... 31
5.4.2 Results ... 33
5.5 Argo Floats ... 35
6 Ship’s Meteorological Station ... 36
6.1 Methods ... 40
6.2 Abbreviations ... 41
7 Station List SO272 ... 41
7.1 Overall Station List ... 41
7.2 Profile Station List ... 41
7.3 Sample Station List ... 41
8 Data and Sample Storage and Availability ... 41
9 Acknowledgements ... 42
10 References ... 42
Appendix A Stationbook SO272 ... 44
Appendix B Seismic Profile Summary ... 73
Appendix C GeoB Stations ... 78
Appendix D GeoB24001 to GeoB24011 smear slides ... 79
Appendix E GeoB24001 to GeoB24011 core descriptions ... 82
1 Cruise Summary
1.1 Summary in English
Cruise Leg SO272 with RV SONNE, leaving Port Louis, Mauritius, on January 11 2020, returning to Cape Town, South Africa, on March 4 2020, comprised seismic reflection studies and geological sampling of the Kerguelen Plateau in the southern part of the Indian Ocean. The Kerguelen Plateau rises up 2000 m above the surrounding seafloor and hence forms an obstacle for the flow of the Antarctic Circumpolar Current (ACC) and the Antarctic Bottomwater (AABW). The ACC is strongly deviated in its flow towards the north. A branch of the AABW flows northwards along the eastern flank of the plateau thereby shaping sediment drifts. A detailed study and analysis of the structure of the Labuan Basin and the central Kerguelen Plateau via seismic data and a correlation with results from DSP Leg 120 Sites 748, 750, and 751 was needed to supply information on the Cretaceous and Tertiary development of the AABW and its influence on the path of the Antarctic Circumpolar Current, This in turn will allow conclusions on the development of the East Antarctic Ice Sheet. Seismic profiles were gathered, which capture the structure of the Labuan Basin and the Kerguelen Plateau to basement and image sediment drifts. In total ~4000 km of high resolution seismic reflection data were recorded. Bathymetric and Parasound data were recorded parallel to the seismic profiling.
To complement the seismic studies and provide ages of the outcropping sediment geological samples were retrieved at 11 locations using a gravity corer and multi-corer. Both datasets will form the base for an IODP proposal.
1.2 Zusammenfassung
Der Fahrtabschnitt SO272 vom 11. Januar 2020 Post Louis, Mauritius, bis 4. März 2020 Kapstadt, Südafrika, mit FS SONNE bestand aus reflexionsseismischen und geologischen Untersuchungen des Kerguelen Plateaus im südlichen indischen Ozean. Das Kerguelen Plateau erhebt sich bis auf 1500 m Wassertiefe und formt so eine Barriere für den Antarktischen Zirkumpolarstrom (ACC) und das Antarktische Bodenwasser (AABW). Der ACC wird in einem Pfad deutlich nach Norden abgelenkt. Ein Zweig des ABBW wird an der Ostflanke des Kerguelen Plateaus nach Norden geführt und formt dort Sedimentdrifts. Eine detaillierte Erfassung und Analyse der Struktur des
Labuan Beckens und des Kerguelen Plateaus mittels seismischer Methoden und ein Anschluß an bestehende ODP Bohrungen (ODP Leg 120) wurde benötigt, um Informationen über die spätkretazische und tertiäre Entwicklung des Labua Beckens und des Kerguelen Plateaus und seinen Einfluß auf die Entwicklung der Pfade des Antarktischen Zirkumpolarstroms und des AABW zu erhalten. Das reflexionsseismische Programm während der Expedition SO272 wurde derart gestaltet, dass die Struktur des Labuan Beckens und des Kerguelen Plateaus bis zum Basement sowie mögliche Sedimentdrifts erfasst wurden. Es wurden insgesamt ~4000 km an hochauflösenden reflexionsseismischen Daten aufgenommen. Parallel zu den seismischen Profilarbeiten wurden bathymetrische und Parasound Messungen durchgeführt.
Ergänzt wurden die seismischen Messungen durch eine geologische Beprobung mittels Schwerelot und Multi-Corer. Auf diese Weise werden Information zum Alter der anstehenden sediment bereitgestellt. Beide Datensätze formen die Basis für einen IODP Bohrantrag.
Fig. 1.1 Scientific team of cruise SO272
2 Participants
2.1 Principal Investigators
Name Institution
Uenzelmann-Neben, Gabriele, Dr.
Westerhold, Thomas, Dr. AWI
MARUM
2.2 Scientific Party
Name Discipline Institution
Uenzelmann-Neben, Gabriele, Dr Eggers, Thorsten
Pfeiffer, Adalbert Daub, Pascal Eisermann, Hannes Geils, Jonah
Najjarifarizhendi, Banafsheh Nielsen, Ricarda, Dr.
Schneider, Matthias Westerhold, Thomas, Dr.
Krauss, Florian Petersen, Ann-Katrin Abbott, April
Duggan, Brian
Seismics / Chief Scientist Seismics
Seismics Seismics Seismics Seismics Seismics Seismics Seismics Geology Geology Geology Geology Geology
AWI AWI AWI AWI AWI AWI AWI AWI AWI MARUM MARUM MARUM MACQUARIE Dreutter, Simon USC
Hehemann, Laura Werner, Ellen
Repenning, Katharina Andreas, Pascal Warnke, Fynn Peters, Ingrid Lazar, Laura Sievers, Oliver
Bathymetry Bathymetry Bathymetry Parasound Parasound Parasound MMO MMO Weather
AWI AWI AWI AWI AWI AWI OSC OSC DWD
2.3 Participating Institutions
AWI Alfred-Wegener-Institut, Helmholtz-Zentrum für Polar- und Meeresforschung
DWD Deutscher Wetterdienst
MACQUARIE Macquairie University, Sydney
MARUM Universität Bremen
OSC Ocean Science Consulting Ltd
USC University of South Carolina 3 Research Program
(G. Uenzelmann-Neben1, T. Westerhold2)
1AWI
2MARUM
3.1 Aims of the cruise
Located in a key region in the southern Indian Ocean the complex topography of the Kerguelen Plateau, one of the world’s largest Large Igneous Provinces, has a strong influence on pathways of water masses within the Antarctic Circumpolar Current (ACC) and the Antarctic Bottom Water (AABW). Topographic highs like the Williams Ridge at the Kerguelen Plateau reduce the flow of water masses leading to the deposition of thick sediment packages. Gaps and narrow passages in contrast lead to increase in current velocity and thus erosion and non-deposition. In the Cenozoic era significant modifications in pathways and intensity of those water masses have been caused by the tectonic development of the Kerguelen Plateau as well as the opening of the Tasman Gateway, the Drake Passage and major global climatic changes. In the Kerguelen Plateau region all of these changes are explicitly well documented in the formation of sedimentary structures, e.g. sediment drifts, supposedly at very high resolution.
The overarching objectives of the cruise to the Kerguelen Plateau were twofold: 1) to study variations in flow paths and intensities of deep and bottom water masses in response to tectonic movements and climate variability; this is the major focus of the cruise, and 2) to collect critical pre-site survey data for the preparation of an IODP drilling proposal.
Objective 1: Variations in pathways and intensities of deep and bottom water masses
The tectonic development of the KP during the late Cretaceous and Cenozoic has led to significant modifications in the flow paths of deep and bottom water masses that can be reconstructed studying sediment drifts in great detail. Opening, widening and deepening of the Tasman gateway and the Drake Passage have had a significant effect on flow paths of AABW and the ACC in particular. Development and modifications in the ACC itself primarily influenced the location of the oceanographic frontal system around Antarctica relocating sedimentary depocentres. The seismic data collected allow the identification and mapping of these depocentres, and to reconstruct changes in water mass pathways and intensities through time. Major focus in the analysis of the data will be on the climate dynamics and tectonic development in the Eocene to Oligocene when climate shifted from greenhouse to icehouse conditions. Seismic mapping of the above mentioned depocentres will provide unique insight into effects of tectonic movements and modifications in climate during that time. Our detailed study will focus on the Eocene opening of the Tasman Gateway, the Oligocene opening of the Drake Passage, the late Eocene ephemeral glaciations, and the Eocene-Oligocene Transition. As a second focus, the seismic survey in the Labuan Basin (LB) provides unprecedented information on variations in water mass flows and movements in the Antarctic frontal system from the Mid-Miocene Climatic Optimum, the late Miocene cooling, and Pliocene warming. Especially this latter interval is of high significance because it might provide new views on the dynamics of both the East and West Antarctic Ice Sheets on ocean circulation when atmospheric pCO2 was as high as today (∼ 400 ppm).
The following hypotheses are to be tested:
Hypothesis 1: Tectonic movements were the major factors controlling the pathway of AABW/DWBC during the Cenozoic, while the intensity of the ACC was mainly influenced by modifications in climate.
Hypothesis 2: While colder bottom water activity can be observed east of the Tasman gateway already in the early Paleogene, warm water masses, and hence no bottom water, prevailed west of the gateway in the southern Indian Ocean prior to the Eocene-Oligocene boundary.
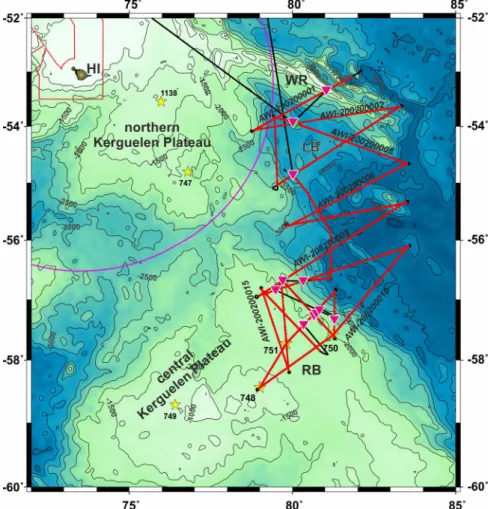
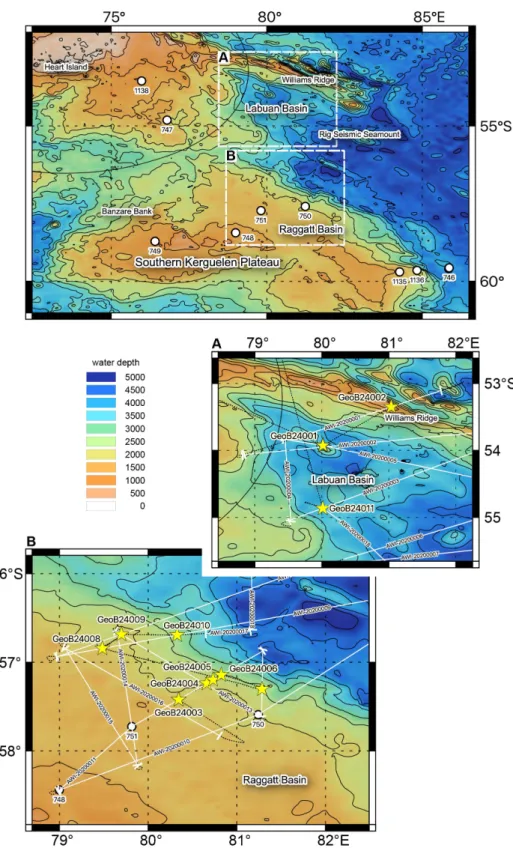
Fig. 3.1 Track chart of R/V SONNE Cruise SO272. Bathymetry from Smith and Sandwell (1997). The green diamonds show the locations of deployed ARGO floats, and the purple inverted triangles show the locations of geological sampling carried out during the cruise. Orange stars show the locations of ODP drill sites on the Kerguelen Plateau.
To test those hypotheses we collected a grid of 18 seismic profiles (1ms sample rate, 500 Hz max frequency, 80 Hz dominant frequency≅ 9 m vertical resolution) and a set of 11 sediment cores carefully selected during the cruise on the eastern KP between the CKP and Williams Ridge (WR) (Fig. 3.1). This area is perfectly suitable for the objectives of this study because topographic highs like the KP and Williams Ridge reduce the speed of deep water masses flowing within the ACC and the AABW causing the deposition of large sediment piles (see Fig. 5.3). The structure (geometry, internal unconformities, reflection characteristics) of these sediment drifts represent an extraordinary archive documenting modifications in the flow paths as well as intensity variations of the water masses in great detail. The new high-resolution seismic lines will enable the detection and detailed imaging of sediment drifts shaped by AABW and the DWBC in the LB and east of WR and by the ACC in the gap between the CKP and SKP (Fig. 5.3). Sediment drifts located in the LB and the gap between the CKP and SKP are particularly important targets because they should be sensitive recorders of past relocations of the powerful SACCF retroflection (Dezileau et al., 2000; Fukamachi et al., 2010; Mazaud et al., 2010; Sokolov and Rintoul, 2009). The seismic
lines further cross ODP Leg 120 Sites 748, 750, and 751. Those sites recovered sedimentary rocks going back towards the Cretaceous (Schlich and Wise Jr, 1992; Wise et al., 1992), were used for dating regional seismic reflections (Fritsch et al., 1992; Munschy et al., 1992), and will thus allow to correlate the acquired seismic data with geological information (lithology, sediment composition, grain sizes, etc) and to develop age-depth models. Combined this will enable a palaeoceanographic interpretation of the seismic reflection data as required to address the objectives of this project. Recovery of sediment cores located off the ODP sites are required to characterize the sediment composition and dating of outcropping sediment layers to facilitate and support the interpretation of seismic profiles.
Fig. 3.2 South to North bathymetric, Temperature and Salinity transect and surface frontal boundaries across the southern Indian Ocean and Southern Ocean over the SKP with location of previous ODP drill sites. The seismic and geological survey area will cover the Labuan Basin and northern SKP currently bathed in AABW and LCDW. Profile drawn using Ocean Data View (Schlitzer, 2013).
Objective 2: Pre-site survey for an IODP proposal
Supported by the proposed seismic survey and geological sampling of the surface deposits we plan to write an IODP drilling proposal to recover the drift deposits in the Ragatt Basin on the northern SKP and in the Labuan Basin.
Carbonate rich sediments from the SKP are ideal to monitor changes in geochemical properties driven by climate throughout the Cenozoic at high resolution. The SKP is a key area to document the evolution of the Antarctic cryosphere, the ACC and the surface frontal system in the southern Indian Ocean. Previous drill cores provided low resolution and spotty windows into Cenozoic climate history of the region. Based on the information to be collected in the proposed survey a much more focused expedition could be planned to retrieve stratigraphic complete successions. In combination with the results from previous drilling at the Tasman Gateway (Leg 189), Wilkes Land (Exp. 318), and IODP 862-Pre proposal (PI Westerhold, Bohaty et al.) to drill in the
subantarctic South Atlantic Ocean on the eastern Falkland Plateau (Maurice Ewing Bank and Georgia Basin), the planned IODP drilling proposal for the SKP will focus on climate change, biotic shifts, and deep-sea chemistry during the Paleogene in important southern Indian Ocean sectors, testing the following hypotheses:
Hypothesis 1: the magnitude of temperature change across transient warming events in the Paleogene is driving the response of high-latitude plankton groups.
Hypothesis 2: southern high latitude cooling causing changes in deep and bottom water circulation preceded the major onset of Antarctic Peninsula glaciation at the Eocene- Oligocene Transition.
Hypothesis 3: opening of the Drake Passage and Tasman Gateway paced the development of the Antarctic Circumpolar Current (ACC), AABW and DWBC.
Hypothesis 4: changes in high-latitude and global climate during the Cenozoic are coupled to variations in the ACC circulation.
The seismic grid and the sediment cores collected during cruise SO272 will help to characterise lithology and age of layers outcropping at the flanks of the drift deposits. We have collect a set of seismic profiles covering the locations of ODP Leg 120 Sites 748, 750 and 751 and allowing the choice of appropriate sites for an IODP proposal in the Ragatt and Labuan basins (Fig. 3.1). Parasound, providing detailed seismostratigraphic information about the upper 100-200 m of the sedimentary column, and multibeam bathymetric data have also been collected to fulfil the site survey guidelines of IODP’s Science Evaluation Panel. We envision IODP drilling at KP and the Labuan Basin in a way to retrieve complete carbonate rich key records spanning Paleogene to Neogene time and to drill across important structural changes in the drift deposits for highly precise age determination. Synthesis of the here proposed seismics data and future IODP drilling would unfold the detailed history of southern high latitude climate development over the last 66 million years.
3.2 Agenda of the Cruise
The main objectives of cruise SO272 were the collection of high resolution seismic reflection data to identify sedimentary structures shaped by deep and bottom water masses and to sample outcropping sequences by geological sampling. To prepare for the cruise an environmental impact assessment was carried out by LGL Ltd. This EIA comprised an evaluation of all noise sources during the cruise: the seismic sources, the vessel itself, Parasound, and the multibeam system EM 122. Noise predictions have been undertaken for the proposed geophysical survey for the Kerguelen Plateau waters and applied to the latest published international thresholds (NMFS, 2016 and 2018a). The results indicated that none of the applicable injury thresholds would be breached outwith approximately 150 m from the operation. Animals may be within around 800 m of the source. A mitigation zone of 2000 m was found to be appropriate to control the risks from underwater noise with a shut-down distance of 500 m. The mitigation protocol has been designed to apply to distances of this magnitude in order to reduce the risk of injury to marine mammals to negligible levels. Furthermore, below mitigation measure were suggested:
• Deploying a marine mammal observer;
• Maintain a 3000 m mitigation zone;
• Avoiding starting piling at night or in poor visibility (unless further mitigation such as PAM is provided);
• Searching for animals in the mitigation zone for a minimum of 60 minutes before starting, to allow for deep-diving species to surface;
• Waiting for 30 minutes after the last observation of mammals in the mitigation zone;
• Apply a 30-minute soft start to the seismic airgun, e.g., by increasing from one gun up to four;
• Repeat the process if there is a break of over 10 minutes;
• If line changes are expected to take longer than 40 minutes, firing is to be terminated at the end of the survey line and the mitigation process repeated; and
• Report the activity and any observations using the standard format.
Additionally, an application for an environmental permit were handed in to the authorities of Australia. Upon review of our Environmental Impact Assessment, the Australian Department of Environment and Energy considered that the proposed action would not involve the killing, injuring, taking, trading, keeping or moving of any member of a listed threatened, migratory or marine species. Therefore no other permit for the proposed activity was required in addition to the permit for cetaceans under Subdivision 3 of Part 13 of the EPBC Act. The cetacean permit was issued.
We hired two independent Marine Mammal Observers from OSC to watch out for marine mammals prior and during seismic profiling. Their report can be found in chapter 5.4. Our streamer system has also included a Passive Acoustic Monitoring (PAM) system, Quiet Sea™ by Sercel.
This supported the MMOs and allowed line changes during night.
4 Narrative of the Cruise (G. Uenzelmann-Neben1)
1AWI
The final preparations for cruise SO272 were carried out on board RV SONNE. 21 scientists embarked in Port Louis on January 11. Unfortunately, the unloading of the containers could only commence for the Geology containers. One of the seismic containers was delayed. This contained the working clothes, thus the set-up of the seismic equipment had to wait. RV SONNE left port on January 14 at appr. 18:00 LT to head to La Reunion, where the delayed container was supposed to be landed. We arrived in La Reunion on January 15 and carried out a safety manoeuvre. The freight vessel with our container arrived on January 16 but the port of La Reunion was on strike for the period January 16 to 17. We could load the container on January 17 but only leave port on January 18 00:30 LT already being six days behind schedule. Set-up of the seismic equipment thus began on January 18 and continued during transit to the working area.
On January 18 at 18:35 UTC the recording of EM 122 and Parasound commenced. During our transit we deployed six ARGO floats for Dr. C. Hanstein from CSIRO, Australia. The first was deployed on January 22 at 1:48 UTC. We arrived in the working area, the Labuan Basin on January 26 at ∼12:00 UCT. The first geostation GeoB24001 was carried out with a gravity core and a multi- corer as well as a Sound Velocity Profiler (SVP). A second geostation followed. Seismic profiling commenced on January 27 at 4:45 UTC. We continued seismic profiling across the Labuan Basin and the central Kerguelen Plateau until February 13, 22:22 UTC, when the seismic equipment was retrieved. A set of eight geological sampling stations across the central Kerguelen Plateau followed. Seismic profiling recommenced on February 15, 20:12, and two additional profiles were
collected. The seismic work ended on February 16, 23:40 followed by another geological station.
The scientific programme came to an end on February 17, 5:51, when we set course for Cape Town.
The transit to Cape Town took 15 days, which was mainly due to the fact that we had to sail against the prevailing west winds and the east-setting current system within the ACC. Due to the bad weather we could not collect a bathymetric profile, which had kindly been requested by T.
Thovhogi from the Petroleum Agency South Africa.
On March 3rd, 9:00 we came into the port of Cape Town. The scientists disembarked on March 4th.
5 Preliminary Results
5.1 Seismic Reflection Profiling
(G. Uenzelmann-Neben1, T. Eggers1, A. Pfeiffer1, P. Daub1, H. Eisermann1, J. Geils1, B. Najjarifarizhendi1, R. Nielsen1, M. Schneider1)
1AWI
The application of seismic methods was one of the primary operational objectives of SO272 in order to obtain information on the structure and sedimentary distribution in the area of the Kerguelen Plateau. We used a standard multi-channel seismic reflection technique to image the outline and reflectivity characteristics of the sedimentary layers and the structure of the sub- sedimentary basement and lower crust by recording the returning near-vertical wave field. Figure 5.1 illustrates the principles of this technique.
5.1.1 Seismic Equipment (T. Eggers1, A. Pfeiffer1)
1AWI
5.1.1.1 Seismic Sources, Activation and Timing
We used a cluster of 4 GI-guns to resolve the sedimentary layers. A single GI-Gun™ is made up of two independent air guns within the same body. The first air gun (“Generator”) produces the primary pulse, while the second air gun (“Injector”) is used to control the oscillation of the bubble produced by the “Generator”. We used the “Generator” with a volume of 0.72 liters (45 in3) and fired the “Injector” (1.68 liters = 105 in3) with a delay of 33 ms. This leads to an almost bubble- free signal. The guns were towed 20 m behind the vessel in 2 m depth and fired every 25 m (∼10 s shot interval).
The activation of the airguns occurs through a gun controller (Teledyne BigShot). The controller provides the power necessary to activate the valves of the guns. With an optional feedback signal from extra hydrophones, the controller is capable of synchronizing the activation of each gun automatically. This ensures that the complete gun array fires at the same time. The gun controller itself waits for the fire order (TTL signal) of the navigation system.
Seismic data acquisition requires a very precise timing system, because seismic sources and recordings systems must be synchronised. All the systems are synchronised through a dedicated GPS clock with an accuracy of 1µs.
5.1.1.2 Navigation and Triggering
For planning the lines and performing the line shooting, we are using a separate navigation system (Sercel SeaPro Nav). From ship side, we get NMEA strings for the ship position, heading, water depth and speed through water. Depending on the actual plan, the navigation system calculates the next shot point as defined by the shot parameters (shot distance, time or a combination of both) and generates the fire order for the air guns. After each successfully performed shot, the navigation system generates a navigation header file and transfers it to the acquisition system. This file uses the SEAL acquisition system to generate the final SEGD file for this shot point.
Fig. 5.1 Principle of marine seismic reflection surveying.
5.1.1.3 Multi-Channel Reflection Recording System
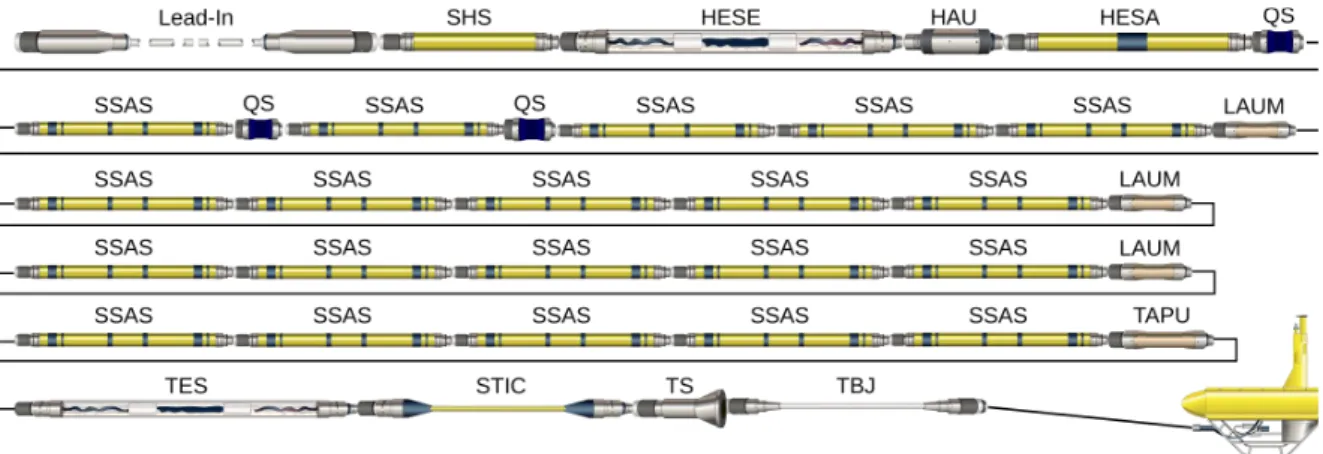
For multi-channel reflection data acquisition, a complete digital seismic streamer and recording system was used. The system consists of a large capacity, fully integrated, high resolution marine seismic data acquisition system (Sercel SEAL™) (Fig. 5.2). The streamer is a 240-channel hydrophone array, composed of 20 active sections with 12 channels each. Each channels consists of 8 hydrophones placed in an array. The spacing of each hydrophone array is 12.5 m (Table 5.1).
The streamer is coupled to the on-board recording system via a fiber-optic tow leader and a deck lead. The data collected by the hydrophone array is firstly converted from an analogue signal to digital via a Field Digitizing Unit (FDU2F). The data is available as a 24-Bit word with a sample rate of 1, 2 or 4 ms and then routed through a Line Acquisition Unit Marine (LAUM). After filtering and compressing the data, the LAUM sends them to the on-board equipment. The LAUM also supplies power for the FDU2F, and they are located after every 5 active sections.The interface to the on-board equipment is the Deck Cable Crossing Unit (DCXU). It has a build-in high-voltage power supply for powering all the streamer modules and acts as a LAUM for first 60 channels.
The main software is installed on a server running Linux Operating System mounted with the other components in a mobile rack. It manages the flow of acquired data from the streamer and auxiliary channels. It also manages processing of the data and export to various peripherals (FC-
AL tape drives, NFS disks, plotters, QC tools). Communications and synchronization with the navigation system are ensured via Ethernet links or a T0 signal. Communications with DCXU- 428s are ensured via Ethernet links too, therefore the server can manage a virtually unlimited number of DCXU-428s (streamers). The system and all parameters for acquisition are displayed and controlled on a separate client pc with a graphical user interface (GUI).
The acquisition runs in continuous mode and the final SEGD file for a shot point will be generated according to the navigation header file, received from the navigation system. The final SEGD file is stored on the server and exported simultaneously to two Network Attached Storage (NAS) with a capacity of 5 TB each. The actual SEGD for the last shot point is also available for the QC-Software running on a separate client. With this software, it is possible to have a first look on the data for quality control.
Fig. 5.2 Setup of the seismic data acquisition.
5.1.1.4 Depth Control and Positioning
With depth control units, called birds, we can control the depth of the streamer cable during operation. We use Model 5010/5011 DigiBIRD and CompassBIRD II from ION, controlled by Digicourse software, for this purpose. Nominal depth of the streamer cable in calm weather conditions is 10m. The depth can be changed during operation by setting new target depths for each bird through the controller software.The actual depth and heading (only Model 5011 DigiBIRD and CompassBIRD II) of each bird is available for the navigation system and will be stored for every shotpoint.
5.1.1.5 Passive Acoustic Monitoring (PAM)
We use QuietSea™ from Sercel for passive acoustic monitoring. The system can detect vocalizations emitted by marine mammals. These signals are of two types: whistles and click trains. The whistles are particular vocalizations emitted to communicate between marine mammals in the same group or are parts of a song call emitted by specific baleen whale males.
The clicks are impulsive signals (from approximately ten microseconds to few milliseconds) and so cover a great bandwidth. The bandwidth covered by clicks can be highly variable depending on the species.
The system uses the seismic data (using the SEAL™ interface) to detect vocalizations in the seismic bandwidth (from 10 Hz to 200 Hz with usual seismic sampling frequency of 2ms). It also
uses dedicated streamer modules and auxiliary modules to detect localizations in the [200 Hz-96 kHz] bandwidth.
Table 5.1 Specification of SENTINEL active section, 12.5m spacing Field Digitizing Units (FDUs).
Arrangement One per receiver point (2 channels) Functions A/D conversion, data digitizing, and tests FDUs per active section 6 (2 per location)
Spacing 50m
Hydrophones
Standard model Sercel Flexible Hydrophone (SFH) Nominal capacitance 32.5 nF ± 10% @ 20º C
Nominal sensitivity –192.9 dB ref to 1 V/μPa ± 1.5 dB (22.65 V/bar) @ 20º C Hydrophone Array
Cut off frequency 2 Hz
Groups per section 12
Hydrophones per group 8
Group capacitance (nominal) 260 nF ± 10% @ 20° C
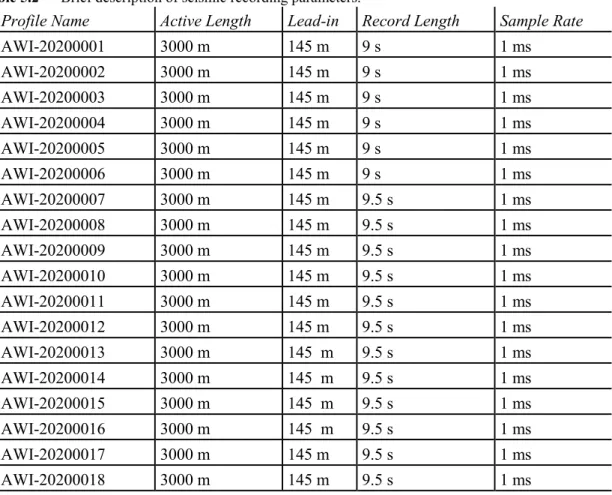
Group sensitivity –194.1 dB ref to 1 V/μPa ± 1.0 dB (19.7 V/bar) @20° C The data were recorded with the following parameters (also Appendix B):
Table 5.2 Brief description of seismic recording parameters.
Profile Name Active Length Lead-in Record Length Sample Rate
AWI-20200001 3000 m 145 m 9 s 1 ms
AWI-20200002 3000 m 145 m 9 s 1 ms
AWI-20200003 3000 m 145 m 9 s 1 ms
AWI-20200004 3000 m 145 m 9 s 1 ms
AWI-20200005 3000 m 145 m 9 s 1 ms
AWI-20200006 3000 m 145 m 9 s 1 ms
AWI-20200007 3000 m 145 m 9.5 s 1 ms
AWI-20200008 3000 m 145 m 9.5 s 1 ms
AWI-20200009 3000 m 145 m 9.5 s 1 ms
AWI-20200010 3000 m 145 m 9.5 s 1 ms
AWI-20200011 3000 m 145 m 9.5 s 1 ms
AWI-20200012 3000 m 145 m 9.5 s 1 ms
AWI-20200013 3000 m 145 m 9.5 s 1 ms
AWI-20200014 3000 m 145 m 9.5 s 1 ms
AWI-20200015 3000 m 145 m 9.5 s 1 ms
AWI-20200016 3000 m 145 m 9.5 s 1 ms
AWI-20200017 3000 m 145 m 9.5 s 1 ms
AWI-20200018 3000 m 145 m 9.5 s 1 ms
5.1.2 First Results
(G. Uenzelmann-Neben1)
1AWI
The seismic grid was set up to image the structure of both basement and sedimentary rocks in the Labuan Basin between the northern Kerguelen Plateau and William’s Ridge as well as on the central Kerguelen Plateau and at its eastern flank. We collected a set of lines in the Labuan Basin followed by a few transects southward onto the central plateau. This allowed a direct correlation with results from ODP Leg 120 Sites 748, 750, and 751 (Fig. 5.3) (Schlich and Wise Jr, 1992). In total, 18 seismic profiles were gathered across the Labuan Basin and Kerguelen Plateau (Fig. 5.3).
About 1.3 Tb of raw data were gathered. Due to this large amount the data were only converted into the internal format of our processing system Echos, the shot-CDP geometry was defined, and the data were sorted. Afterwards, constant offset plots were created for quality control. The remaining processing steps will be carried by the PhD student funded through the project after our return to Bremerhaven.
Fig. 5.3 Bathymetric map of the Kerguelen Plateau showing the locations of the collected seismic profiles (red lines) and of the geological stations (purple inverted triangles). Also shown are the locations of ODP Leg 120 Sites 748, 750, and 751 (yellow stars). The magenta lines show the boundaries of the Australian EEZ. HI= Heard Island, LB= Labuan Basin, RB= Ragatt Basin, WR= Willima’s Ridge.
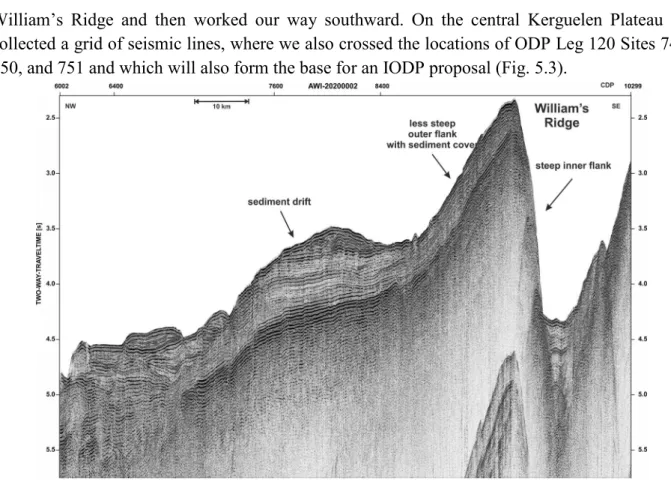
The seismic data are of excellent quality. Although using only small sources (four GI-guns with a total volume of 9.6 l) the seismic signals have penetrated up to 3 s TWT (∼3 km) of the sedimentary column and at a few places even show intra-basement reflections. We initially collected a few lines crossing the Labuan Basin from the northern Kerguelen Plateau to the
William’s Ridge and then worked our way southward. On the central Kerguelen Plateau we collected a grid of seismic lines, where we also crossed the locations of ODP Leg 120 Sites 748, 750, and 751 and which will also form the base for an IODP proposal (Fig. 5.3).
Fig. 5.4 Part of seismic line AWI-20200002 showing the western flank of the William’s Ridge. Notice the steep inner flank while the outer flank is less steep. There, a significant sediment cover can be observed, and a sediment drift is formed.
The William’s Ridge was imaged as a very rough basement feature, which is formed of at least two parallel elements showing both horizontal and vertical tectonic movement. The inside flanks of the elements are extremely steep, while the outside flanks are less steeply inclined. Towards the Labuan Basin, the ridge flank shows a significant cover with sediments, which are shaped into sediment drifts (Fig. 5.4). Sediment drift development can be observed all over the Labuan Basin.
Several basement ridges appear to guide bottom water leading to the formation of moats and sediment drifts (Fig. 5.5).
Working southwards we continued imaging the sedimentary features in the Labuan Basin.
There, basement is very rough and forms several highs, which partly rise above the seafloor and form seamounts and ridges. Magmatism appears to have occurred syn-sedimenatry since the sedimentary sequences are disturbed. Furthermore, the basement topography appears to have guided the flow of bottom water as moats and sediment drifts can be identified in their vicinity.
The seismic data further show a number of unconformities and erosional surfaces.
The central Kerguelen Plateau is also characterised by strong erosion. An erosional surface encircles an up to 400 ms TWT (∼400 m) thick sequence, which via a link to ODP Leg 120 Site 748 could be dated as the Eocene-Oligocene boundary (Fig. 5.6) (Coffin et al., 1990; Shipboard Scientific Party, 1989). The basement on the central Kerguelen Plateau is characterised by several highs with depressions in between. Those depressions are filled with early Cretaceous sediment.
Late Cretaceous and Paleogene sediment show disturbance due to tectonic movements.
Summarising, the dataset is of excellent quality and images both tectonic structures as well as current controlled sedimentary features. Several lines of interpretation ranging from tectono-
magmatic activity of the plateau as well as reactivation within the Labuan Basin to activity and relocation of pathways of deep water masses are possible. This will provide further information about the development of this important part of the Southern Ocean, where the tectonic development has had strong implications for the pathways of water masses and thus the development of the climate.
Fig. 5.5 Seismic line AWI-20200003 across the Labuan Basin showing sediment drifts and moats.
Fig. 5.6 Seismic line AWI-20200010 across the Kerguelen Plateau with a first tie to ODP Leg 120 Sites 748 and 750. e/mE= early-middle Eocene boundary, E/O= Eocene-Oligocene boundary, O/M=
Oligocene-Miocene Boundary, KPg= Cretaceous-Paleogene boundary, T/C= Turonian/Campanian
5.2 Sediment Sampling
(T. Westerhold1, A. Abbott2, B. Duggan3, F. Krauss1, A.-K. Petersen1)
1MARUM
2Macquarie
3USC
5.2.1 Gravity Corer
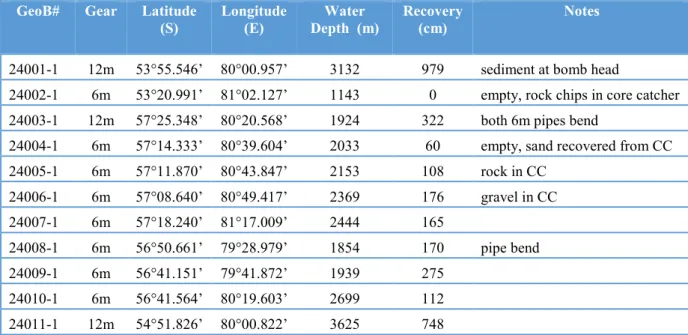
Longer sediment sequences were obtained by a gravity corer with a pipe length of 6 and 12 m, respectively, and a weight of 1.5 tons. Once on board, the sediment core was cut into 1 m sections, closed with caps on both ends and labelled. In total, 11 cores were retrieved with recoveries between 0 cm and 979 cm (Table 5.3, Fig. 5.7). Altogether ~31 m of sediment was recovered with the gravity corer during R/V SONNE Cruise SO272.
All of the gravity cores were cut into an archive and a work half. The archive half was used for core description and core imaging. The work half was sampled with syringes for Rare Earth Element (REE, Abbott/Duggan) analysis, for biostratigraphy investigations (Diatoms, Calcareous Nannofossils), and pilot foraminifera screening as well as samples with cubes for paleomagnetic studies. Core halves and samples, except the REE samples, were stored at +4°C and shipped to the GeoB core repository at MARUM.
Table 5.3 List of gravity cores retrieved during R/V SONNE expedition SO272. Geographical coordinates and water depths refer to “on ground” in Appendix C.
GeoB# Gear Latitude
(S) Longitude
(E) Water
Depth (m) Recovery
(cm) Notes
24001-1 12m 53°55.546’ 80°00.957’ 3132 979 sediment at bomb head
24002-1 6m 53°20.991’ 81°02.127’ 1143 0 empty, rock chips in core catcher 24003-1 12m 57°25.348’ 80°20.568’ 1924 322 both 6m pipes bend
24004-1 6m 57°14.333’ 80°39.604’ 2033 60 empty, sand recovered from CC 24005-1 6m 57°11.870’ 80°43.847’ 2153 108 rock in CC
24006-1 6m 57°08.640’ 80°49.417’ 2369 176 gravel in CC 24007-1 6m 57°18.240’ 81°17.009’ 2444 165
24008-1 6m 56°50.661’ 79°28.979’ 1854 170 pipe bend 24009-1 6m 56°41.151’ 79°41.872’ 1939 275
24010-1 6m 56°41.564’ 80°19.603’ 2699 112 24011-1 12m 54°51.826’ 80°00.822’ 3625 748
The core descriptions (Appendix E) summarize the most important results of the analysis of each sediment core following procedures applied during ODP/IODP expeditions. All cores were opened, described, and image scanned. Longitudinal split open core sections were imaged using the SmartCIS 1600LS line scanning system of the MARUM GeoB Core Repository (www.marum.de/en/Infrastructure/GeoBsmartCIS-1600-Line-Scanner.html). Split surfaces of each section was freshly scraped immediately prior to imaging in order to capture the ephemeral nature of sedimentary features as some features oxidize within minutes. All images were acquired at a standard resolution of 500 dpi. In order to retain the relative variability in sediment lightness throughout the expedition camera aperture was fixed at f/11. All sections were scanned using two
light sources in order to achieve best lighting situations and reduce potential shadow effects of rough surfaces. A white calibration of the system was done on daily basis using a standardized white tile. Absolute color reproduction of the line scan images is ensured through the automatic application of a IT8.7/2-target referenced ICC-profile built-in the steering software of the line scanner. Section images were directly saved to the curatical database system ExpeditionDIS as jpeg files. Output also included a tab-delimited text file with red, green, blue, lightness (%) values as well as red/blue ratios in 1 mm down-core resolution for each section. Individual core sections were assembled to a single core image using the MARUM macro package for IGOR Pro (Wavemetrics). From the image red, green, blue, lightness (%) and red/blue ratio were extracted, despiked (outlier removal, data from endcap and gaps removed), smoothed and plotted in the core description barrel sheets.
The core descriptions (Appendix E) summarize the most important results of the analysis of each sediment core following procedures applied during ODP/IODP expeditions. All cores were opened, described, and image scanned. Longitudinal split open core sections were imaged using the SmartCIS 1600LS line scanning system of the MARUM GeoB Core Repository (www.marum.de/en/Infrastructure/GeoBsmartCIS-1600-Line-Scanner.html). Split surfaces of each section was freshly scraped immediately prior to imaging in order to capture the ephemeral nature of sedimentary features as some features oxidize within minutes. All images were acquired at a standard resolution of 500dpi. In order to retain the relative variability in sediment lightness throughout the expedition camera aperture was fixed at f/11. All sections were scanned using two light sources in order to achieve best lighting situations and reduce potential shadow effects of rough surfaces. A white calibration of the system was done on daily basis using a standardized white tile. Absolute color reproduction of the line scan images is ensured through the automatic application of a IT8.7/2-target referenced ICC-profile built-in the steering software of the line scanner. Section images were directly saved to the curatical database system ExpeditionDIS as jpeg files. Output also included a tab-delimited text file with red, green, blue, lightness (%) values as well as red/blue ratios in 1 mm down-core resolution for each section. Individual core sections were assembled to a single core image using the MARUM macro package for IGOR Pro (Wavemetrics). From the image red, green, blue, lightness (%) and red/blue ratio were extracted, despiked (outlier removal, data from endcap and gaps removed), smoothed and plotted in the core description barrel sheets.
In the core descriptions the lithological data are based on visual analysis of the core and supplemented by information from binocular and smear slide analyses. Visual descriptions of the representative sediment types, their colors according to the Munsell soil color chart as well as sedimentary structures and unique features, following the ODP conventions (Graham and Mazzullo, 1988). Lithological data are primarily based on the investigation of smear slides taken from selected horizons. Smear slides were prepared using Norland Optical Adhesive 61 as mounting medium (refractory index of 1.56), dried with UV light for 15 minutes. Slides were studied at up to 400x magnification on an Olympus BH-2 petrological microscope along two perpendicular profiles through the central area of the cover slip. Sediment classification followed the ODP terminology. Lithological names consist of a principal name based on composition, degree of lithification, and/or texture as determined from visual description and microscopic observations. In addition, the intensity of bioturbation together with specific features are indicated.
Fig. 5.7 Bathymetry map of the study area with the GeoB stations indicated by yellow stars in the Labuan (A) and Raggatt Basin (B).
5.2.2 Multi Corer
The main tool for the sampling of undisturbed surface sediments was the multi corer (MUC) equipped with 12 plastic tubes of 60 cm length and 10 cm diameter. During the expedition SO272, 6 MUC have been deployed (Table 5.4) and recovered up to 29 cm of undisturbed surface sediment.
Multi-corer tubes were distributed and processed as follows:
• 3 tubes cut into 1 cm thick slices for archive (MARUM); two of the tubes were stained with Bengal Rose from 0-7cm and packed in Kautex bottles, the other samples packed in Petri dishes (overlying not sampled).
• 3 tubes were transferred into plastic-liners as bulk sample (MARUM).
• 6 tubes were used to extract pore water samples (Macquarie & USC).
Table 5.4 Multi-corer sampling during R/V SONNE expedition SO272. Geographical coordinates and water depths refer to “on ground” in Appendix C.
GeoB# Latitude
(S) Longitude
(E) Water
Depth (m)
Max.
Recovery (cm)
Notes
24001-2 53°55.544’ 80°00.954’ 3124 29 All tubes filled, SVP attached
24002-2 53°20.992’ 81°02.126’ 1142 0 MUC stopped at 1100m, SVP attached 24003-2 57°25.354’ 80°20.580’ 1905 15 All tubes filled, SVP attached
24004-2 57°14.329’ 80°39.606’ 2035 10 6 tubes filled, 6 empty 24008-2 56°50.660’ 79°28.986’ 1859 15 11 tubes filled, one lost 24009-2 56°41.153’ 79°41.869’ 1943 5 one tube filled, 11 empty
Fig. 5.8 Core image overview of all retrieved gravity cores from SO272 in the Labuan and Raggatt Basin.
5.1.3 Shipboard Results Working Area Labuan Basin Stations GeoB 24001 and 24002
First, in the Labuan Basin one MUC and two gravity cores were deployed at 1143 and 3132 m water depth (Figs. 5.7 and 5.8). The sediment recovered at station GeoB24001-1 (Fig. E.1) is mainly diatom ooze with drop stones and rhythmic changes in reflectance. Overall, the sediment
is moderately bioturbated and contains foraminifera in increasing abundance downcore. At station 24002-1 the gravity corer did not penetrate the sea floor, only a few rock chips have been recovered in the core catcher pointing to exposure of basement rock.
Stations GeoB 24011
After the last seismic line of the cruise, AWI-20200018, one last gravity core was deployed in the Labuan Basin at 3625 m water depth, GeoB24011-1. A MUC deployment was planned but canceled due to too high swells for safe operations of the gear. The core retrieved 748 cm of olive grey diatom ooze.
Working Area Raggatt Basin Stations GeoB 24003 to 24010
In the second working area, the Raggatt Basin, four MUC and eight gravity cores were deployed between 1854 to 2699 m water depth (Figs. 5.7 and 5.8). Recovery of sediment was between 60 and 322 cm. Decreased recovery for gravity cores was anticipated, compared to the Labuan Basin. Major objective of the cores in Raggatt Basin was to penetrate through the upper undifferentiated layer of surface sediment and probe the below much older outcropping sediment.
Dating of the oldest part of the cores will help to determine the age of prominent reflectors in subbottom-profiler data and seismic profiles shore based.
The 322 cm of sediment recovered at station GeoB24003-1 is mainly radiolarian diatom ooze with drop-stones in the upper 270 cm. Below foraminifer-bearing nannofossil ooze of unknown age appears. The sediment is moderately to strongly bioturbated with massive burrows in the first meter. Both coring pipes of the 12m gear were bent due to the stiff nannofossil ooze at the base.
Recovery at station GeoB24004-1 was only ~60 cm of radiolarian diatom ooze with foraminifer sand at the base. Once the core was on deck most of the sediment washed out due to the drainage of the overlying water. At GeoB24005-1 108 cm of foram ooze and clay with drop-stones was recovered. The top of the cores was very sandy and disturbed by the coring process. In the core catcher a thick black drop-stone was retrieved. GeoB24006-1 penetrated 176 cm of foram ooze at the top followed by silt-bearing clay towards the bottom. Gravel stones were found in the core catcher. Similarly, GeoB24007-1 retrieved only 165 cm of clay and drop-stones. At GeoB24008- 1 the pipe was bent and brought up 170 cm of diatom ooze with drop-stones. This core was disturbed during coring and washed out later during retrieval in the lower section. A beautiful transition from overlying biosiliceous ooze into nannofossil ooze of unknown age was cored at GeoB24009-1, a 275cm long core. Last, GeoB24010-1 was retrieved from the Raggatt Basin with 112 cm of siliceous clay with drop-stones and manganese nodules.
5.3 Hydroacoustics
(S. Dreutter1, K. Repenning1, P. Andreas1, L. Hehemann1, F. Warnke1, E. Werner1)
1AWI
5.3.1 Scientific Objectives
Accurate knowledge of the seafloor topography, hence high-resolution bathymetry data, is key information necessary to understand many marine processes. It is of particular importance for the interpretation of scientific data in a spatial context. Bathymetry, or geomorphology, is a basic parameter for understanding the general geological setting of an area and geological processes
such as erosion, sediment transport and deposition. Even information on tectonic processes can be inferred from bathymetry. Supplementing the bathymetric data, high-resolution sub-bottom profiler data of the top 10s of meters below the seabed provides information on the sediments at the seafloor and on the lateral extension of sediment successions. This can be used to study depositional environments on larger scales in terms of space and time, of which the uppermost sediments may also be sampled.
While world bathymetric maps give the impression of a detailed knowledge of worldwide seafloor topography, most of the world’s ocean floor remains unmapped by hydroacoustic systems.
Remote locations like the SO272 key research area are prime examples of this fact. In these areas, bathymetry is modelled from satellite altimetry with a corresponding low resolution. Satellite- altimetry derived bathymetry therefore lacks the necessary resolution to resolve small- to meso- scale geomorphological features (e.g., sediment waves, glaciogenic features and small seamounts).
Ship-borne multibeam data provides bathymetry information in a resolution that is sufficient to resolve those features.
Using parametric sediment echosounders it is possible to image shallow subsurface structures and sedimentary patterns, which is of great importance in selecting appropriate sites for coring and, additionally, provide high-resolution cross-sections of the uppermost subsurface in order to supplement multichannel seismic data. In sediment echosounder data, the identification of, for example, stratified sedimentary layers, mass transport deposits, drift deposits, outcropping or subcropping strata, or shallow gas accumulations is possible. It can additionally be used for characterization of acoustic facies types and sedimentary processes derived by their imaged deposits. In SO272 research areas, depositional structures caused by bottom current activity are of special interest and were imaged at different locations.
5.3.1 Bathymetry
The main task of the bathymetry group was to operate the multibeam echosounder (MBES) Kongsberg EM122, including calibration and correction of the data for environmental circumstances (sound velocity, systematic errors in bottom detection, etc.), post processing and cleaning of the data, as well as data management for on-site map creation. The MBES was operated constantly throughout the cruise for underway surveying, as far as research permits allowed.
5.3.1.1 Technical description
During the SO272 cruise, the bathymetric surveys were conducted with the MBES Kongsberg EM122. The EM122 is a deep water system for continuous mapping with the full ocean depth potential (20 – 11.000 m). It operates on a frequency of around 12 kHz ranging from 10.5 to 13.5 kHz within the eight different transmit sectors. On RV SONNE, the EM122 transducer arrays are arranged in a hull-mounted Mills cross configuration of 16 m (transmit unit) by 8 m (receive unit) to achieve an angular beam accuracy of 0.5° by 1°. The combined motion, position, and time data comes from a Kongsberg MRU 5+ and a Kongsberg Seapath 320 system and the signal goes directly into the processing unit (PU) of the MBES to perform real-time motion compensation in Pitch, Roll and Yaw in the range of +/-10°. With a combination of phase and amplitude detection algorithms the PU computes the water depth from the returning backscatter signal.
5.3.1.2 Data acquisition and processing
Data acquisition was carried out throughout the entire cruise, starting the 18th of January 2020 at 18:30 UTC just outside the French EEZ (La Réunion) and ending on the 29th of February at 16:30 UTC before entering South African EEZ. Acquisition was only paused while crossing the French EEZ (Kerguelen Island).
Where possible, cruise tracks were planned parallel to existing bathymetric data. Due to the deep regime in the SO272 research area, the swath opening was limited to 120° (60° to both sides) to achieve a balance between coverage and ping rate and to avoid bad outer beam soundings at higher slant ranges.
For data acquisition, the Kongsberg SIS (Seafloor Information System) software was used. It pre-processes and logs the collected data, applies all corrections and defined filters, and finally displays the resulting depths on a geographical display. The recorded data was stored in 60 min blocks in the Kongsberg *.all format. Subsequent post-processing was performed using Caris HIPS and SIPS. For generating maps, the data were exported to Quantum GIS in the GeoTIFF raster format.
The data editing revealed an overall good data quality of the EM122. During transit we encountered some false bottom detections distributed over the covered area, but no technical defect could be identified that would explain this kind of artifacts. Hence, they might be connected to rough seas, higher vessel speed or poor sound velocity correction (SVC, see below). During the cruise we did three reboots of the EM122, two in order to improve the false bottom issue, and one due to a crash of SIS and the acquisition PC. Additionally, the BIST test of the EM122 failed on the TX Channels test because of low impedance on the transmitter elements, but this can be explained by the low water temperature in the Kerguelen region and was not a real technical defect.
All in all the EM122 performed very satisfactory and ran stable for almost the entire trip.
5.3.1.3 Sound velocity profiles
For best survey results with correct depths, sound velocity profiles (SVP) were fed into the EM122 regularly to correct the water sound velocity in the different depths. This is essential, as the acoustic signal travels down the water column from the transducer to the seafloor and back to the surface through several different layers of water masses with each a different sound velocity.
The sound velocity is influenced by density and compressibility, both depending on pressure, temperature and salinity. Wrong or outdated sound velocity profiles lead to refraction errors, false range measurements and overall reduced data quality.
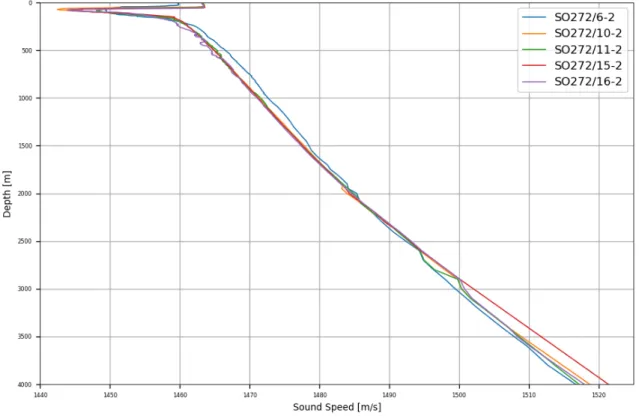
During the transit with no time to stop for SVP stations, synthetic World Ocean Atlas 13 (WOA13) profiles were extracted with the SoundSpeedManager software and directly transmitted to SIS. In the main research area, a Valeport SVP probe was connected to the Mulicorer from the Geology team to acquire measured SVPs for improved correction. A total of five SVP stations were conducted in the area which was just about sufficient, since the SV was very stable during the time at the Kerguelen Plateau. During transit, more drastic changes in the water SV could be observed in the WOA13 profiles, hence, a higher number of roughly four profiles per day was extracted and applied to the data. Figure 5.9 shows the applied (measured) SVPs during the bathymetry data acquisition in the main research area.
Fig. 5.9 Measured SVPs in the SO272 research area.
Fig. 5.10 Bathymetry collected during SO272 (including transit).
5.3.1.4 Bathymetry preliminary results
Throughout the cruise, a continuous recording of data was achieved, except for small data gaps due to the mentioned system/software errors and shutdowns, as well as the EEZs without research permits. By the end of the cruise, all EM122 data was processed and cleaned. During 42 days of survey, a track length of 11098 nm (20554 km) was surveyed. The raw data volume of the EM122 is 46 GB with 948 separate files. The water depths ranged between a minimum of 344 m to a maximum of 6249 m. Figure 5.10 shows an overview on the overall collected bathymetry data and Figure 5.11 the bathymetry in the main research area on the Kerguelen Plateau.
5.3.1.5 Data management
Bathymetric data collected during SO272 will be stored in the PANGAEA data repository at the AWI. Furthermore, the data will be provided to mapping projects and included in global bathymetry compilations such as GEBCO (General Bathymetric Chart of the Ocean). Bathymetric data will also be provided to the Nippon Foundation – GEBCO Seabed 2030 Project.
Fig. 5.11 Bathymetry collected in the SO272 main research area.
5.3.2 Sediment Echosounding 5.3.2.1 Technical description
The PARASOUND DS3 (P70) system is a hull-mounted parametric echosounder by TELEDYNE RESON GmbH (previously ATLAS HYDROGRAPHIC). The transducer transmits signals with 70 kW transmission power to enable a maximum penetration depth of about 200 m in soft sediments. The system uses the parametric effect to transmit a Secondary Low Frequency
(SLF) in the range of 0.5 to 6 kHz and a Secondary High Frequency (SHF) in the range of 36.5 to approx. 40 kHz. Both signals are generated by emitting two high frequency signals of 18 to 33 kHz. For the PARASOUND system onboard RV SONNE, the Primary High Frequency was set to 19.5 kHz to avoid acoustic interference with the simultaneously operating EM122 multibeam echosounder. The second PHF can vary between 18.5 and 33 kHz. During SO272, a SLF of 4 kHz and a rectangular pulse shape with a pulse length of 0.5 ms and 2 periods per pulse were chosen to provide a good relation between signal penetration and vertical resolution. The SLF signal travels within the narrow 19.5 kHz beam of about 4.5° aperture angle, which is much narrower than e.g. the 30° angle of a 4 kHz signal when emitted directly from the same transducer.
Therefore, a higher lateral resolution can be achieved, and imaging of small-scale structures on the seafloor is superior to conventional systems.
HYDROMAP CONTROL (version 2.8.5) was used to initialize and setup the transmission parameter, while PARASTORE (version 3.4.4.9) was used for visualization and storage of PHF and SLF signals. Both PHF and SLF data were acquired over the full profile and stored as ASD files. SLF data (window size of 800 ms) were additionally stored in the more common PS3 format (Carrier Frequency mode & geographic coordinates) and regularly converted to SEG-Y format using the custom-designed program PS32SGY v1.6.3 (by H. Keil, University of Bremen). During the process, the data was resampled by factor 2, filtered with a broad bandpass filter (2 to 6 kHz) and the envelope of the seismic traces calculated. The SEG-Y file were subsequently imported to the seismic interpretation software IHS KINGDOM 2017.0 for better visualization and core location planning.
5.3.2.2 Data acquisition
The PARASOUND echosounder has been running starting on 18th of January 2020 17:51 UTC.
Acquisition was stopped on 29th of February at 09:17 UTC. During this time period three software failures occurred, which could be dealt with by restarts. After this reboot, data acquisition continued on 19th of February 2020 at 09:18 UTC. Switching PARASOUND from sounding to standby was necessary while passing the French EEZ beginning on the 24th of January 2020 at 02:35 UTC. The EEZ was passed on January 25th 2020 at 09:41 UTC. Except for station work, the PARASOUND system was operated in quasi-equidistant mode, where signals are transmitted at equal intervals independent of whether the previously transmitted signal was already received again. Consequently, multiple signals can be present in the water column that allows for a better lateral coverage and, thus, resolution. Pinging mode was changed to single pulse during station work to reduce data amount. For the same reason, wait time was adjusted from 0 to 600 seconds.
Seafloor detection was either based on the Controlled PARASOUND PHF or provided by the EM122.
5.3.2.3 Parasound preliminary results
During the survey, three different acoustic facies could be identified, which can be divided based on their acoustic characteristics and distinct locations around the research area Kerguelen Plateau.
One structure which could be identified are sediment drifts. Figure 5.12 shows a sediment drift body of large extent. The general signal penetration is around 200 m. On the western side converging reflectors (trace 5500 to 6500) are visible adjacent to a moat which are indications for
bottom current activity. The sediment package is horizontally layered, as indicated by parallel reflections, and undisturbed on the western side. Interior parts of the sedimentary sequences display that disturbing factors have been present in the past as parallel to subparallel reflectors seem to be disrupted (trace 1000 to 2500). Moreover, parts on the eastern side show chaotic reflections with no clear layering to acoustic transparency. This is an indicator for mass movement deposits potentially originating from shallower depths associated with outcropping basement. On top of these structures however, stratified sediment has deposited again.
Fig. 5.12 Parasound profile SLF 20200128 175917 and SLF 20200128 215920 showing an elongated sedimentary drift body and a mass transport deposit adjacent to outcropping basement.
Another structure can be observed within the sedimentary sequences in the Labuan Basin southeast of the northern Kerguelen Plateau (Figure 5.13). This facies type is characterised by deep penetration of the acoustic signal showing horizontally layered, parallel reflectors following the topography. Around 150 m of sediments are displayed. In the southwestern part of the basin (trace 6500 to 4500), reflectors are overlapping and, thus, terminating on outcropping basement.
Moreover, wave-like sedimentary structures were found. Figure 5.14 shows that these sediment waves are characterised by variable layer thicknesses between sub-parallel reflections and two distinct formation stages separated by truncation surfaces. The older structure is more continuous and well-marked as the formation process seems to cease with time. Since there are no signs of vertical disruptions or displacements, the origin of these respective waves do not seem to be of tectonic nature but instead consequence of bottom current activity.
Fig. 5.13 Parasound profile SLF 20200130 175947 showing a parallel layered sediment succession, onlapping on outcropping basement in the SW.
Fig. 5.14 Parasound profile SLF 20200202 220036 showing sediment waves.
5.3.2.4 Data management
Sediment echosounder data collected during SO272 will be stored in the PANGAEA data repository at the AWI.
5.4 Marine Mammal Observations (I. Peters1, L. Lazar1)
1OSC
5.4.1 Introduction
All whales, dolphins and porpoises (cetaceans) in Australian waters are protected under the Environmental Protection and Biodiversity Conservation (EPBC) Act 1999. Marine mammals, particularly cetaceans are acoustically-reliant animals and use sound for prey detection, predator avoidance, navigation and communication. Marine mammals produce sounds covering frequencies from only a few Hertz (Hz) to 200 kiloHertz (kHz). These range from low frequency (10–200 Hz) baleen whale (mysticete) moans, thumps and knocks, to the narrow-band high- frequency (NBHF) clicks of some toothed whales, dolphins and porpoises (odontocetes) which can reach up to 200 kHz. Correspondingly, marine mammals as a group are able to hear sounds covering frequency from only a few Hz to over 160 kHz. Consequently, sound generated from seismic surveys has the potential to cause injury or disturbance to marine mammals. The sound from acoustic seismic sources is primarily concentrated in the 10–200 Hz frequency bandwidth.
The EPBC Act Policy Statement 2.1 Interaction between offshore seismic exploration and whales:
industry guidelines make provision to reduce injury and disturbance to species that may be more sensitive in this frequency range i.e. baleen whales and larger toothed whales.
Marine mammal mitigation measures were applied during the scientific expedition from Research Vessel (RV) SONNE in adherence to cetacean permit: 2019 – 0007 from the Department of Environment and Energy, Australia and its accompanying documents to minimise risk of disturbance and injury to marine mammals. Marine Mammal Observers (MMOs) monitored a mitigation zone for the presence of all marine mammals, specifically ‘whales’, defined by Australian guidelines to include all baleen whales as well as larger toothed whales i.e. sperm, beaked, killer, false killer and pilot whales and exclude all other dolphins and porpoises. Ocean Science Consulting Limited (OSC) was contracted to supply two trained, qualified, and experienced MMOs, namely Ingrid Peters and Laura Lazar, for the duration of the project. Owing to the extended hours of daylight during summer in the Southern Ocean (approximately 22:30 to 15:00 Universal Time Coordinated, UTC), the dedicated MMOs were assisted by four scientists from the geology team aboard the vessel. These assistants were trained in observation techniques by the dedicated MMOs, to ensure the presence of two observers on watch at all times, apart from designated breaks, with at least one observer being one of the experienced dedicated MMOs.
Opportunistic watches were conducted by one or more MMOs during transit outside of Australian waters in good weather conditions. Marine mammals, observed outside of dedicated visual watches, were recorded as opportunistic sightings.
Observations were conducted predominantly from the observation deck (22 m above mean sea level) and occasionally (during very bad weather conditions) from the bridge (20 m above mean sea level). Environmental conditions, including wind direction, wind speed, Beaufort sea state, swell, visibility, glare and precipitation, were recorded as prevailing sea and environmental conditions affect the ability to detect marine mammals. MMOs continued with visual observations throughout all weather conditions during all daylight hours. Observations were conducted with the naked eye and using binoculars (7x50), searching for visual cues, indicating the presence of marine mammals (e.g. splashes, feeding birds, dark or reflective shapes, etc). Specific marine mammal