Role of DISTORTED2, GNARLED and SPIRRIG in cell morphogenesis of Arabidopsis thaliana.
Inaugural-Dissertation
Zur
Erlangung des Doktorgrades
der Mathematisch-Naturwissenschaftlichen Fakultät der Universität zu Köln
vorgelegt von
Rainer Saedler
aus Freiburg i. Br.
Berichterstatter: Prof. Dr. Reinhard Krämer Prof. Dr. Martin Hülskamp Prüfungsvorsitzender: Prof. Dr. Ulf-Ingo Flügge
Tag der mündlichen Prüfung: 30. Mai 2005
Table of contents
Abbreviations and Gene names………III List of figures..……… IV
1 Introduction ... 1
1.1 Microtubules during Cell Morphogenesis ... 4
1.2 Actin microfilament during Cell Morphogenesis... 6
1.3 Molecular basis of actin cytoskeleton formation... 8
1.4 Regulation of the ARP2/3 complex... 10
1.5 Aim of the work... 12
2 Material and Methods... 13
2.1 Material... 13
2.1.1 Chemicals, antibiotics... 13
2.1.2 Enzymes and molecular biological materials ... 13
2.1.3 Cloning vectors... 13
2.1.4 Vectors used for cytoskeleton labeling... 13
2.1.5 Bacterial strains ... 13
2.1.6 Plant lines ... 13
2.1.7 Marker list ... 14
2.1.8 Primer list ... 14
2.2 Methods ... 16
2.2.1 RNA isolation... 16
2.2.2 cDNA synthesis ... 16
2.2.3 Semiquantitative RT-PCR ... 16
2.2.4 Genomic plant DNA preparation... 17
2.2.5 Plasmid DNA preparation from bacteria... 17
2.2.6 DNA-manipulation ... 17
2.2.7 Mapping approach ... 17
2.2.8 TILLING Approach... 17
2.2.9 Cloning of the DIS2-1 cDNA ... 18
2.2.10 Cloning of the GRL cDNA ... 18
2.2.11 Cloning of the SPI cDNA... 19
2.2.12 Plant growth conditions... 19
2.2.13 Crossing of plants ... 19
2.2.14 Plant transformation ... 19
2.2.15 Seed sterilization ... 20
2.2.16 Drug treatments ... 20
2.2.17 Fluorescein diacetate staining... 20
2.2.18 Microscopy ... 20
2.2.19 Sequence analysis programs... 21
3 Results ... 22
3.1 The DISTORTED2 (DIS2) gene ... 22
3.1.1 Identification of DIS2 gene... 22
3.1.2 Molecular characterization of DIS2 gene ... 23
3.1.3 Phenotype of distorted2-1... 25
3.1.4 Subcellular phenotype of dis2-1 mutants ... 27
3.2 The GNARLED (GRL) gene ... 30
3.2.1 Molecular characterization of the GRL gene... 30
3.2.2 Phenotypic characterization of the grl mutants ... 34
3.2.3 Subcellular phenotype of grl mutants... 35
3.3 The SPIRRIG (SPI) gene ... 36
3.3.1 The spirrig mutant... 36
3.3.2 Cloning of the SPIRRIG gene... 36
3.3.3 Molecular characterization of SPI... 38
3.3.4 Phenotypic characterization of the spi mutant... 41
3.3.5 Subcellular phenotype of spi mutants... 44
4 Discussion... 45
4.1 DISTORTED2, a component of the ARP2/3 complex ... 45
4.1.1 The distorted2 mutant phenotype... 46
4.1.2 Localized growth ... 46
4.1.3 Cortical actin mesh ... 47
4.1.4 Possible interaction of cortical actin and microtubules... 48
4.1.5 Cell growth ... 49
4.2 GNARLED, a potential regulator of the ARP2/3 complex ... 51
4.2.1 grl mutant phenotype... 54
4.3 SPIRRIG, an unknown component in cell shape regulation ... 55
4.3.1 Spirrig mutant phenotype ... 55
4.3.2 Identification of the SPI gene ... 57
4.3.3 BEACH mutants in Dictyostelium discoideum... 58
4.3.4 Putative SPIRRIG protein function in Arabidopsis thaliana... 59
4.3.5 BEACH protein organization ... 60
Abstract... 62
Zusammenfassung ………...63
References ... 64
Danksagung ……….75
Erklärung ... 76
Lebenslauf ... 77
Abbreviations and Gene names
degree Celsius kilo
°C k
micro kilo bp
μ kb
35S 35S promoter from Cauliflower Mosaic virus
kD kilo Dalton
ARP2/3 Actin related protein 2 and 3 KLK KLUNKER
Landsberg erecta Ler
ALI ALIEN Adenosine triphosphate
ATP min minute
messenger RNA
bp base pair mRNA
C DNA-content of a haploid genome
MT microtubules
complementary DNA n number
cDNA
CLSM confocal laser scanning microscopy
ORF open reading frame
Columbia polymerase chain reaction
Col PCR
CRK CROOKED p promoter
Dalton
D RNA ribonucleic acid
DIS1 DISTORTED1 rpm rounds per minute
DIS2 DISTORTED2 RT-PCR reverse transcription PCR
Deoxyribonucleic acid
DNA SD standard deviation
exempli gratia (Lat.) for example
e.g. sec second
EMT endoplasmic microtubules SPI SPIRRIG
et alterni (Lat.) and others
et al. T-DNA transferred DNA
FDA fluorescein diacetate WT wild type
Figure
Fig. WRM WURM
green fluorescent protein
GFP YFP yellow fluorescent protein
GRL GNARLED
All gen- and mutant names are written in italics. WT-genes are written in capital letters.
Proteins are written in non-italic letters.
List of figures
Figure 1. Cellular plant architectures………. 1
Figure 2. Trichome development………... 3
Figure 3. Schematic display of phenotypes caused by actin (red) and microtubule (blue) cytoskeleton defects in model cell types……….. 6
Figure 4. Models of the ARP2/3 complex……….. 9
Figure 5. WAVE/SCAR regulation pathways of the ARP2/3 complex………. 10
Primary structure of the DISTORTED2 gene………. 24
Figure 6. Figure 7. The derived amino acid sequence for DISTORTED2 aligned with protein sequences of the ARPC2 subunit of ARP2/3 complexes from reference organisms……… 25
Comparison of leaf trichomes morphology in wild-type Arabidopsis thaliana (ecotype Landsberg erecta) and distorted 2–1 mutant…………. Figure 8. 26 Actin and microtubule organization in Arabidopsis thaliana wild-type (Landsberg erecta) and mutant trichomes……….. Figure 9. 27 Molecular characteristics of the GRL gene………. Figure 10. 30 Figure 11. Amino acid sequence comparison of the Arabidopsis thaliana GRL gene product with NAP125 from animal species……… 32
Phenotypic characterization of grl mutants……….. Figure 12. 34 SPI mapping flowchart………... Figure 13. 37 Molecular characterization of the SPIRRIG gene……….. 39
Figure 14. RT-PCR analysis of different spirrig alleles……….. Figure 15. 40 Figure 16. Schematical drawing of the putative SPI protein……… 41
Phenotypic characterization of spi mutants……… Figure 17. 43 Figure 18. Schematical drawing of a view through a cell……… 50
Figure 19. Schematical drawing of proposed pathways for ARP2/3 regulation in plants………... 53
Figure 20. Phylogenetic tree of BEACH proteins……… 59
1 Introduction
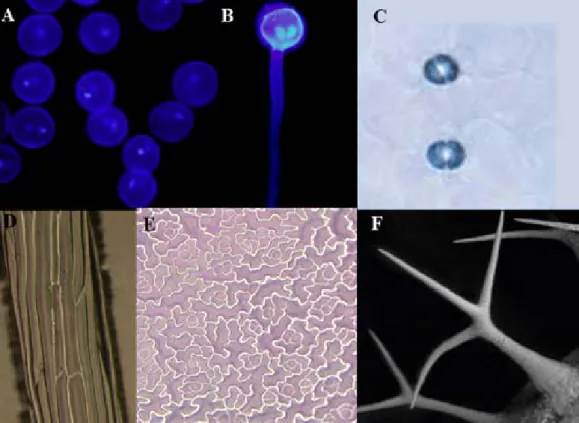
Plants feature a tremendous and almost unlimited diversity in architecture. Multi-cellular plants are quite diverse in their three-dimensional structure, e.g. Sequoia gigantea, Zea mays and Arabidopsis thaliana. In addition, their overall three-dimensional structure is made up of a variety of different cell forms. The shape of a cell can vary from simple roundish shapes to more complex architectures as demonstrated by round egg or pollen cells (Figure 1A); filamentous pollen tube cells (Figure 1B); bent or sausage-like guard cells (Figure 1C); cylindrical epidermal, hypocotyl (Figure 1D) or palisade cells, and highly lobed leaf epidermal cells (Figure 1E). The most extraordinary singularity in architecture is found in leave epidermal trichomes with their stellar outgrowth (Figure 1F).
Figure 1. Cellular plant architectures. (A) DAPI stained pollen tube. (B) DAPI stained elongating pollen tube (A and B modified from Tansengco et al. 2004). (C) stained stomata cells (modified from von Groll and Altmann 2001). (D) agarose imprints of hypocotyl cells. (E) agarose imprints of epidermal pavement cells. (F) Leaf epidermal trichome (C-F Arabidopsis thaliana).
Based on the assembly of single constituent cells and their genetically and environmentally defined developmental frameworks, the architectural diversity of whole plants is accomplished. On a cellular level, all cells derive from a spherical precursor cell, but up to date, little is known about how a spherical cell is transformed into any other cell shape and especially about the underlying regulatory mechanisms.
In order to maintain its isodiametric shape, the cell must grow at every point of the membrane simultaneously and with similar velocity (Mathur 2004). In contrast, if cells grow in defined areas they will change their overall shape and thus increase their architectural complexity. This phenomenon is summarized in the term ‘differential growth’. In any case tight and precise regulation is required, which is achieved and fine- tuned through a molecular hierarchy of cellular components.
Differential cell growth has been studied using model cell types of Arabidopsis thaliana, such as epidermal pavement cells and leaf epidermal trichomes (Mathur and Hülskamp 2002, Hülskamp 2004), stomatal guard cells (Nadeau and Sack 2003), root-hair cells (Carol and Dolan 2002), elongating pollen tubes (Hepler et al. 2001) and differentiating tracheids (Fukuda 2004) that are readily accessible, easy to manipulate in experiments, and known for their pertinent morphological mutants. Although these cells differ greatly in their final shape, they do share underlying growth mechanisms (Mathur and Hülskamp 2002). Depending on their final destination cells can increase their volume by two broad categories: tip growth and diffuse growth, which differ in the membrane area where growth occurs. An essential component in cell growth is the turgor pressure from the vacuole (Smith 2003), which is a major component in plant cells.
Root hairs and pollen tubes are tip growing cells. During their development, they exhibit focused growth in a narrow region, which creates the typical rod-shaped cellular tip (Carol and Dolan 2002, Hepler et al. 2001). On the other hand, most root and hypocotyl cells, as well as the leaf epidermal trichomes grow diffusely over a large area of the cell surface (Mathur and Hülskamp 2002, Hülskamp 2004). Developing leaf epidermis pavement cells, however, most probably create their characteristic jigsaw-shape by a combination of those two growth modes (Fu et al. 2005).
Among the above mentioned cell types, leaf epidermal trichomes of Arabidopsis thaliana are particularly well suited as a model system because of their constant development into their characteristic three-dimensional form. These trichomes are unicellular, with precisely
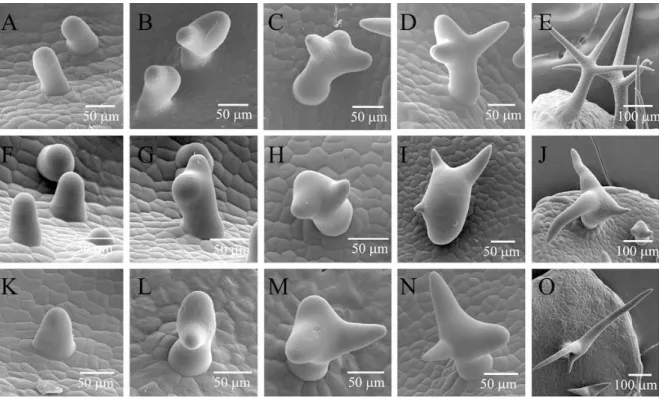
angled branches, and they develop through a well-coordinated sequence of morphogenetic events (Figure 2 A-E) (Hülskamp et al. 1994; Folkers et al. 1997; Szymanski et al. 2000).
After branch initiation, the trichome cell undergoes rapid elongation, ultimately producing a stellate, 350- to 500-µm-tall cell that is oriented perpendicular to the plane of growth.
The enlargement of the cell is correlated with the DNA content in the nucleus. The cell undergoes three rounds of endoreduplication, which results in a 32C DNA content in the mature trichome nucleus. The predictability of trichome cell development, the distinct growth pattern, as well as the isolated position on the leaf surface provide excellent prerequisites to isolate mutants affecting discrete aspects of trichome morphogenesis (Hülskamp et al. 1994).
Figure 2. Trichome development. (A–O) Different stages of developing wild type and distorted mutant trichomes observed with a scanning electron microscope. (A–E) Wild type. (F–J) crk (ARP2/3) mutant. (K–O) spi mutant. Pictures in the first three columns show developmental stages of trichomes from incipient to three branched stages. The pictures in the fourth column display trichomes in the rapid growth phase in which the distortion is pronounced. The last pictures in the rows show mature trichomes. (modified from Schwab et al. 2003)
In an ethyl-methanesulfonate (EMS) mutagenesis screen, eight complementation groups were identified (alien, crooked, distorted1, distorted2, gnarled, klunker, spirrig, and wurm) by a common “distorted” trichome phenotype and characterized on the genetic level (Hülskamp et al. 1994). The beginning of mutant and wild type trichome development is similar (Figure 1) but in the rapid growth phase, after branch initiation, the distortion of the shape becomes clearly visible (Schwab et al. 2003) (Figure 2 F-O) indicating that the morphological cell aberration observed in the ‘distorted’ class mutants depends on alterations of cell growth.
The cell growth process, as shown in various studies on different cell types, is greatly depending on cytoskeletal elements that play roles as transducers, scaffolds and transporting tracks (Wasteneys 2002). Perusal of numerous snapshot studies on cytoskeletal involvement in plant cell morphogenesis reveals two basic cell shape alterations: a) those created by microtubule defects, where anisotropically growing cells shift into an isotropic growth mode to acquire a more expanded, rounded appearance, and b) those where actin defects prevent proper cell expansion and result in short, deformed cells (Mathur and Hülskamp 2002). The interaction of cytoskeletal players, actin and microtubule to form cell shape is essential, but how this is achieved remains still unclear.
1.1 Microtubules during Cell Morphogenesis
Microtubules are often found to align with wall microfibrils in reverse orientation to the direction of cell expansion. Microtubule orientation is thus believed to determine the direction of growth through deviations in microtubule–microfibril co-alignment (Giddings and Staehelin 1991,Baskin 2001).
This is supported by experiments using microtubule interacting drug treatments in diffuse growing cells. Leaf epidermis, hypocotyl, and primary root cells with impaired microtubules swell isotropically suggesting that the cells grow but loose their directionality (Baskin et al. 1994). Anisotropically growing leaf trichomes, which are usually branched, loose their branching capability and appear in a globular shape (Figure 3) upon drug treatment (Mathur and Chua 2000).
In tip-growing root hair cells the effect is even more striking. Under regular conditions a single trichoblast gives rise to one root hair (Schneider et al. 1997) whereas under
treatment with microtubule drugs one trichoblast initiates and forms multiple root hairs (Bibikova et al. 1999). These observations imply that the microtubules are involved in the selection of an area, in which focused tip growth occurs.
Mutants harboring defects in microtubule-associated genes show an abnormal swelling of diffusely growing cells such as trichomes, root, hypocotyl and pavement cells, whereas tip- growing root hairs usually become sinuous or branched. These cellular defects are found in some mutants of the ZWICHEL gene, encoding for a kinesin-like microtubule motor protein (Oppenheimer et al. 1997), in weak mutant alleles of the KIESEL or PORCINO genes encoding for tubulin-folding cofactors (Kirik et al. 2002a, Kirik et al. 2002b), and in the mutant of MOR1/GEMINI1 encoding a XMAP215 homolog (Whittington et al. 2001, Twell et al. 2002).
Another link to the microtubule cytoskeleton has also been proposed based on the mutant phenotypes of the ANGUSTIFOLIA (Folkers et al. 2002,Kim 2002) and SPIKE1 genes (Qiu et al. 2002) in which polarized growth is effected by loss of branch points. In general, all microtubule cytoskeleton-associated phenotypes suggest their involvement in cell polarization and maintenance of growth directionality.
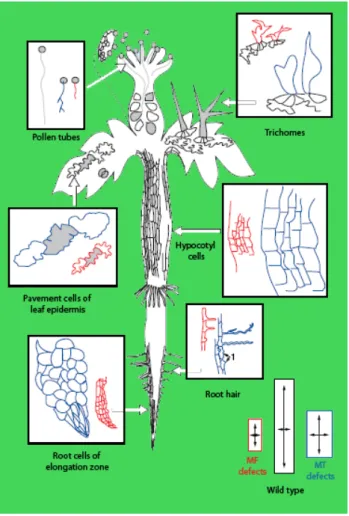
Figure 3. Schematic display of phenotypes caused by actin (red) and microtubule (blue) cytoskeleton defects in model cell types. The three rectangles at the bottom of the figure depict the cytoskeleton-linked changes in cell size with the wild-type cell (middle). In general actin cytoskeleton defects result in reduced cell elongation/expansion. Microtubule defects lead to loss of growth focus, increased expansion and a general rounding up of the cell shape. (modified from Mathur and Hülskamp 2002).
1.2 Actin microfilament during Cell Morphogenesis
Initial investigations of phenotypes caused by mutations in actin-encoding genes in Arabidopsis thaliana did not reveal apparent morphological cells defects. Recent studies suggested a high degree of functional redundancy of these essential genes as an explanation (Meagher et al. 2000). However, treatments with actin microfilament interacting drugs disclosed drastically reduced cell expansion. For instance, treatments of seedlings with the actin polymerization inhibitor latrunculin yield small, dwarfish plants (Baluska et al. 2000), in which leaf epidermis, root, and hypocotyl cells remain relatively
small and unexpanded. Similarly, root hairs and pollen tubes do not elongate properly and remain short and stubby (Baluska et al. 2000, Hepler et al. 2001) (Figure 3).
Drug treatment reduces leaf epidermal trichomes in size and leads to a distorted phenotype.
The initiation of trichome branches is unaffected, even if branches do not elongate properly. In most cases, trichome distortion can be traced back to aberrant actin organization (Mathur et al. 1999; Szymanski et al. 1999) indicating that the actin inhibitors can phenocopy the distorted mutant cell shape. All distorted mutants, except one member, namely spirrig, harbor altered actin cytoskeletons (Mathur et al. 1999; Szymanski et al.
1999, Schwab et al. 2003).
In all growing plant cells several types of actin arrays can be detected that are likely to carry out different functions. Heavily bundled actin filaments, for example, are commonly observed throughout the cytoplasm and in transvacuolar strands in growing plant cells.
These microfilaments provide a scaffold to orientate the endoplasmic reticulum (Boevink et al. 1998) and to maintain conduits for long-distance organelle transport. By using dual labeling strategies it was shown that, contrary to animals, organelles such as chloroplasts (Sheahan et al. 2004), peroxisomes (Mathur et al. 2002), and Golgi stacks (Nebenfuhr et al. 1999) traffic on actin bundles. An efficient long-distance transport may control the organelles inheritance (Sheahan et al. 2004) and the distribution of organelles to support local metabolic needs. Actin filaments mediate short-range recycling of endosomal compartments, such as those in which the auxin efflux carrier resides (Geldner et al. 2001).
Plant cells also contain cortical actin filaments that are in close proximity to the plasma membrane. In many cell types, regions of active cell expansion correlate with the presence of fine networks of actin filaments and supposedly support cell growth (Mathur 2004).
Based on drug treatments interacting with the actin cytoskeleton, the movement of organelles in the long and short distance traveling could be altered and also in some cases arrested (Hawes and Satiat-Juenemaitre 2001, Mathur et al. 2002, Van Gestel et al. 2002).
This distortion in the actin cytoskeleton may therefore cause a reduced as well as misdirected delivery of different vesicles to the cell cortex resulting in growth reduction and cellular distortion. As actin-drug-treated cells show no initial defects in growth directionality, the actin cytoskeleton does not appear to be involved in establishment or maintenance of growth directionality directly.
1.3 Molecular basis of actin cytoskeleton formation
The actin cytoskeleton consists of actin filaments (F-Actin), which are directional polymers that preferentially add globular actin (G-actin) subunits to their barbed (plus) ends, and tend to lose subunits from their pointed (minus) ends. F-Actin filaments are dynamic and vary with respect to their stability as well as the extent of bundling. In all organisms, the actin isoforms themselves contribute to organ and cell-type-specific functions of the actin cytoskeleton (Gilliland et al. 2003, Kandasamy et al. 2002, Ringli et al. 2002). However, the spontaneous nucleation process of actin to actin filaments is slow.
Thus, eukaryotic cells have several classes of proteins, important for formation and stability of actin filaments. These controlling proteins are factors that affect actin nucleation, actin monomer sequestration, actin polymerization and depolymerization kinetics (Welch and Mullins 2002).
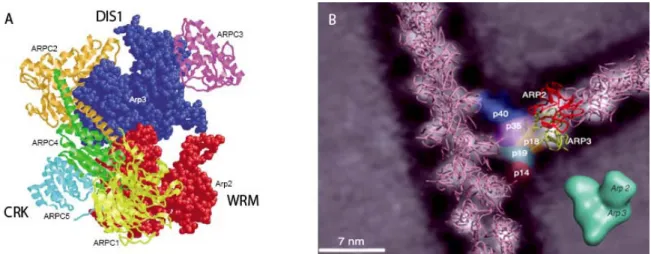
One of the protein complexes that initiate actin polymerization from the pool of G-actin monomers is the actin related protein 2 and 3 (ARP2/3) complex. The ARP2/3 complex was first identified in Acanthamoeba castellanii (Machesky et al. 1994) and is now known from diverse organisms (Vartiainen and Machesky, 2004). Out of seven known subunits that form the complex (ARP2, ARP3, ARPC1 (p40 yeast homolog), ARPC2 (p34), ARPC3 (p21), ARPC4 (p20), and ARPC5 (p16)) two, namely ARP2 und ARP3, resemble actin in sequence and structure (Robinson et al. 2001) (Figure 4). This observation led to the hypothesis that these two proteins form a stable actin-like dimer within the complex as a template for the nucleation of new F-actin filaments (Volkmann et al. 2001). In the presence of a specific activating protein, the complex interacts with an existing filament and initiates a new filament at a precise angle of 70 degrees relative to the parental filament (Mullins et al. 1998, Blanchoin et al. 2000). The ARP2/3 complex initiates filaments from the flanks of mature filaments (Blanchoin et al. 2000) although there is some evidence that the branches can also originate from the barbed end of filaments (Carlier et al. 2003).
Recent publications, based on the analysis of distorted mutants, demonstrated that this complex exists in plants as well. The WURM (WRM) gene and the DISTORTED1 (DIS1) gene encode homologues of the ARP2 and ARP3 subunits, respectively (Le et al. 2003, Li et al. 2003, Mathur et al. 2003a). The CROOKED (CRK) gene encodes a protein with sequence similarity to ARPC5 (Li et al. 2003, Mathur et al. 2003b).
Figure 4. Models of the ARP2/3 complex. A) Model of the inactive ARP2/3 complex based on crystal structures, indicating ARP2, ARP3, and the five subunits ARPC1-5. In large font, the homologues in plants DISTORTED1, CROOKED, and WURM are marked (modified from Winder 2003). B) Model of actin filament branches mediated by the Acanthamoeba castellanii ARP2/3 complex. ARP2 (red) and ARP3 (yellow) are also represented in the lower corner; they serve as actin nucleation points. The five subunits are attaching the mother filament. The barbed ends of the filaments are oriented towards the top of the Figure (modified from Volkmann et al. 2001).
Contrary to all non-plant organisms, in which the loss of some ARP2/3 subunits is lethal (Winter et al. 1999, Hudson and Cooley 2002, Stevenson et al. 2002, Zallen et al. 2002, Sawa et al. 2003, Yan et al. 2003), all null ARP2/3 mutations in plants exhibit a mild mutant phenotype. The plants are vigorous but have a modest reduction in shoot fresh weight; seed set is normal as well as the overall plant architecture. Tip-growing cells, such as pollen tubes that have a strict growth requirement for the actin cytoskeleton, do not show clear mutant phenotypes. The length of etiolated hypocotyls and the size of epidermal cells are reduced relative to those of the wild type (Mathur et al. 2003a). In both, the hypocotyl (Mathur et al. 2003a) and cotyledon epidermis (El-Assal et al. 2004, Le et al. 2003, Li et al. 2003), clear gaps between adjacent cells have been observed in these mutants.
1.4 Regulation of the ARP2/3 complex
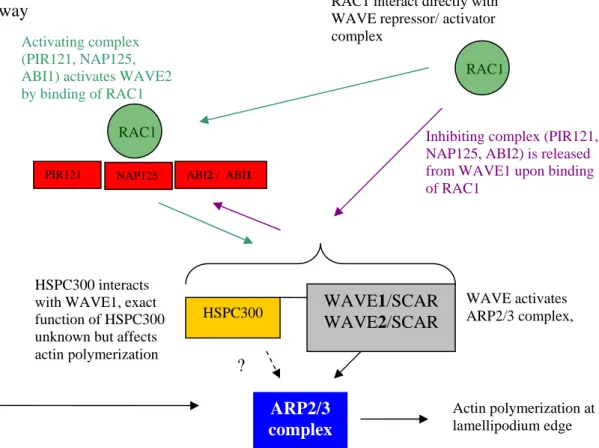
In animals and yeast, the ARP2/3 complex is activated locally in growth regions where it triggers actin branching (Welch et al. 1997, Winter et al. 1997). A plethora of regulatory proteins is known that interact with the ARP2/3 complex and control its site-specific activity. The ARP2/3 complex itself is inactive but two pathways are known to regulate, respectively activate, the ARP2/3 pathway. In the first pathway the ARP2/3 complex is activated by the Wiskott–Aldrich syndrome protein (WASP). WASP is an auto-inhibited protein; its physical interaction with the small GTPase CDC42 and with phosphatidylinositol 4, 5-bisphosphate allows the protein to activate the ARP2/3 complex (Rohatgi et al. 2000) (Figure 5).
WASP pathway
HSPC300 interacts with WAVE1, exact function of HSPC300 unknown but affects actin polymerization Activating complex (PIR121, NAP125, ABI1) activates WAVE2 by binding of RAC1
WAVE activates ARP2/3 complex, RAC1 interact directly with
WAVE repressor/ activator complex
ARP2/3 complex
HSPC300 WAVE1/SCAR
WAVE2/SCAR
?
PIR121 NAP125 ABI2 / ABI1
RAC1
RAC1
Actin polymerization at lamellipodium edge Inhibiting complex (PIR121, NAP125, ABI2) is released from WAVE1 upon binding of RAC1
Figure 5. WAVE/SCAR regulation pathways of the ARP2/3 complex. Hypothetical interaction is drawn as dashed line; proven interactions are drawn as solid lines. Green lines suggest activation, purple lines inactivation.
The second pathway is regulated by the small GTPase RAC1, which activates WAVE/SCAR (Wiskott-Aldrich syndrome protein family verprolin-homologous protein/suppressor of cAMP receptor defects) and HSPC-300 (hematopoietic stem/Progenitor cell clone 300) upon GTP binding through another protein complex. The WAVE/SCAR/HSPC-300 complex then activates the ARP2/3 complex.
In both pathways, the ARP2/3 complex is activated by the verprolin-cofilin-acidic (VCA) region of WAVE/SCAR and WASP proteins (Machesky and Insall 1998). The verprolin domain binds an actin monomer, whereas the cofilin/central domain interacts with the ARP2/3 complex (Higgs et al. 1999, Panchal et al. 2003) to induce filament branch formation.
In the WAVE/SCAR regulatory pathway, two controlling scenarios are found. As some WAVE/SCAR proteins are intrinsically active (Machesky et al. 1999), they are inhibited through a ternary complex consisting of NAP125 (NCK-associated protein), Abi2 (Abl interactor 2) and PIR121 (p53-inducible messenger RNA), which is an isoform of SRA1 (Eden et al. 2002, Blagg and Insall 2004). Binding of RAC1 releases this complex (Eden et al. 2002) facilitating WAVE1-mediated activation of the ARP2/3 complex (Eden et al.
2002) (Figure 5).
A second scenario is found in which a different set of proteins regulate the ARP2/3 complex as well. WAVE2, however, appears to be activated by Abi1, NAP125, and PIR121, and re-localizes by interaction with RAC1, thereby locally activates the ARP2/3 complex (Miki et al. 2000, Blagg and Insall 2004, Innocenti et al. 2004) (Figure 5).
At the beginning of this thesis, the WASP and WAVE/SCAR pathways were unknown in plants. Indication that a WAVE/SCAR pathway exists where given by the observation that several plant-specific Rho-like GTPases, so-called ROPs, (RAC GTPases in animals) were involved in actin-dependent cell shape regulation suggested the existence of a similar pathway in plants (Mathur and Hülskamp 2002, Yang 2002).
1.5 Aim of the work
Many important questions about the molecular mechanisms of plant cellular growth remain unresolved so far. Actin microfilaments seem to be the key factor for local growth.
Alterations of trichome morphologies in defined mutants like the “distorted class”, in which some members harbor defects in the ARP2/3 complex, show an aberrant actin cytoskeleton. The ARP2/3 complex triggers actin nucleation and branching and therefore participates directly in the assembly of the actin cytoskeleton. Out of the distorted group, three members encode subunits of the ARP2/3 complex. As this complex seems to be functionally conserved among Eukaryotes, other members of the distorted group might encode further subunits or proteins in the regulatory pathway.
Three morphological mutants, distorted2, gnarled and spirrig, out of the distorted mutant group, exhibiting trichome phenotypes of different strength, were selected to investigate whether and how they affect the ARP2/3 dependent regulation of the actin cytoskeleton.
The mutant spirrig, described as the only distorted mutant without an aberrant actin cytoskeleton, was chosen to investigate its involvement in cell shape alteration. These three genes could encode for a novel pathway of how cell shape is achieved. For that purpose the genes had to be cloned and identified. Furthermore, the function of the three genes, based on a phenotypical description of the corresponding mutants, had to be analyzed in detail.
2 Material and Methods
2.1 Material
2.1.1 Chemicals, antibiotics
All chemicals and antibiotics were purchased from Sigma (Deisenhofen), Roth (Karlsruhe) and Appligene (Heidelberg) in p.a. quality.
2.1.2 Enzymes and molecular biological materials
Restriction enzymes were supplied by MBI-Fermentas (St.Leon-Rot), New England Biolabs (Frankfurt/Main) and Roche (Mannheim). Oligonucleotides were synthesized by Sigma-ARK Scientific, biomers.net GmbH (Ulm) and Invitrogen (Karlsruhe).
2.1.3 Cloning vectors
pGEM-T easy (Promega) for PCR-product cloning,
pBIN19 containing the GLABRA2 promoter and kanamycin resistance (Szymanski et al.
1998).
2.1.4 Vectors used for cytoskeleton labeling
GFP-mTalin and GFP-MAP4 constructs (Kost et al. 1998, Marc et al. 1998).
2.1.5 Bacterial strains
For standard cloning procedures were performed using Escherichia coli strains DH5α and XL-10 gold. For plant transformation the Agrobacterium tumefaciens strain GV3101 was used.
2.1.6 Plant lines
Two Arabidopsis thaliana ecotypes were used in this study: Landsberg erecta (Ler) and
(Hülskamp et al. 1994), gnarled (grl-EM1 and grl-EM2) (Hülskamp et al. 1994) and dis2-1 (Feenstra 1978) were in a Ler background. The Gabi-Kat line (Rosso et al. 2003) and the SALK lines (Arabidopsis Biological Resource Center (Ohio State University, Columbus, OH, USA)) were in Col background.
2.1.7 Marker list
Marker name COL LER
RSM T7I23_1 303 bp 258 bp RSM F10O3_1 282 bp 234 bp RSM F12K11_1 200 bp 155 bp RSM T7A14_1 250 bp 189 bp RSM T1G11_1 280 bp 259 bp RSM F21M11_1 186 bp 176 bp RSM F21B7_1 200 bp 179 bp RSM F22D16_1 152 bp 143 bp RSM F22D16_2 199 bp 191 bp RSM F10O3_2 158 bp 149 bp RSM T14P4_2 396 bp 390 bp RSM F22D16_3 290 bp 282 bp
RSM F10O3_3 327 bp 344 bp Apa I RSM F10O3_4 309 bp 290 bp Hae III
2.1.8 Primer list
RS1_NGA59_1 5` TTAATACATTAGCCCAGACCCG 3`
RS2_NGA59_2 5` GCATCTGTGTTCACTCGCC 3`
RS3_NGA63_1 5` ACCCAAGTGATCGCCACC 3`
RS4_NGA63_2 5` AACCAAGGCACAGAAGCG 3`
RS13_T7I23_1 5` AAAATGGACGAAATGAGATG 3`
RS14_T7I23_2 5` TCACAACTATGGGTCTGACT 3`
RS15_F10O3_1 5` GCATTGCATTTTGGATTAAC 3`
RS16_F10O3_2 5` CCGAAAAATATCAAGTGTTGAC 3`
RS17_F12K11_1 5` TAACTTGTTAAAGCTCTTCC 3`
RS18_F12K11_2 5` CTCGAATCTAACCAAATGTC 3`
RS34_T7A14_1 5` ATGGTATGTGTTACTTAAGCC 3`
RS35_T7A14_2 5` AGTCATTCATTATGCCTTTG 3`
RS36_T1G11_1 5` AGCCTAAGTTCTTCGGCTTCCTTGATAT 3`
RS37_T1G11_2 5` CCATGGAACTGTTGATATCAAAGTTGTTACA 3`
RS38_F21M11_1 5` ACGTTTTATTGAATCCGCAT 3`
RS39_F21M11_2 5` AAACTTGCGCCGAAAGAATC 3`
RS40_F21B7_1 5` TTTCTGCCTCTGTTCTTCATCTT 3`
RS41_F21B7_2 5` CCAAGAAAGACTTCACCGAT 3`
RS42_F22D16_1 5` ACATACAAAGCAGTGGAAGA 3`
RS43_F22D16_2 5` AGAGACCATCAATAAGGATG 3`
RS66_F22D16_1 5` CTTGGATTCCGAGTCCTAAA 3`
RS67_F22D16_2 5` CTGCTCTTCAATAATATAAGGAGAG 3`
RS68_F10O3_1 5` TATGAATCGCGAAAAGGGGA 3`
RS69_F10O3_2 5` GCGTTCATCAATGGAGGTTT 3`
RS84_F16D14 5` TTGGGACAACAAGGATCACTC 3`
RS85_F16D14 5` TAGACCAACAACACCATTCG 3`
RS86_F16D14 5` ACTTTTAGTATCTGACATTGCTTGGC 3`
RS87_F16D14 5` AATAAAGGTGGATGCTGACCC 3`
RS88_F16D14 5` TTTTACTTTTGAGAACCTGG 3`
RS89_F16D14 5` AGCTGACTACTGATCCAGAT 3`
RS90_F7F1 5` CACATGAGAACACTTTCTCAAAAG 3`
RS91_F7F1 5` CCTGAATTGATATATTATCGGG 3`
RS92_F7F1 5` GTGAGCCAGAATTGTTTTATTTGTGTG 3`
RS97_F7F1_4 5` AGTTACTCTATACTCATAGACTCATAGTGAG 3`
RS98_F16D14_7 5` GTTAACTTATTTGGGATTCG 3`
RS99_F16D14_8 5` AAGAAAACCATGGGGATCGACCAGG 3`
RS100_F16D14_9 5` CGGTTCAACCGAAGCACTAATCTTT 3`
RS101_F16D14_10 5` AAAAGGTTTTATCAGATTCTCTTCAGTGACACCCAATAAG 3`
RS102_F16D14_11 5` GGTTGTGATTGAGAAACAGGGTTTT 3`
RS103_F16D14_12 5` AAGATTCGTGCCTTTTCCGG 3`
RS104_F16D14_13 5` CAGGGCCAAGGAAAATAGAA 3`
RS105_F7F1_5 5` GTTTGCCCAAAAATAAAGGTCCA 3`
RS106_F7F1_6 5` CACAAAGTGCAGCACGATTT 3`
RS107_F7F1_7 5` TGTATTCTGAGCTGTTTCATTCTTA 3`
RS108_F7F1_8 5` GACAGTAGTTGTTTTGCAATAAGTGAGA 3`
RS109_F7F1_9 5` ATGACCTAACCATGTTTGTGTTGTT 3`
RS110_F7F1_10 5` GACAGTAGTTGTTTTGCAATAAGTGAGAAAC 3`
RS117_T14P4_3 5` AGGTTCTTGAGGAAGAATCAGAGTGTG 3`
RS118_T14P4_4 5` TTTCAAAATCGAGACGGAACATAGT 3`
RS119_F22D16_3 5` ACTTCATTGGTTCCTTGGATTCCGAG 3`
RS120_F22D16_4 5` CCGAAATATACCGCGGATCAATCTCTAG 3`
RS139_F10O3_5 5` ATATATGTTAGCATTTTACATTAG 3`
RS140_F10O3_6 5` TAATTCTTTTACAAATGGGG 3`
RS141_F10O3_7 5` ATGATCACTTCTTCCTTGGC 3`
RS142_F10O3_8 5` CGATCAGTTCTACTCTTGGT 3`
RS296 5` CACCATGAAATGGGCAACATTGC 3`
RS297 5` GCGGCGGGCGCGCCATCACATTTCGCATCATCATGAA 3`
RS300 5` GGAATGGTCACTGGTATTTCTGGCC 3`
RS301 5` GCGGCGGGCGCGCCTAAGACAATGCAGTTTGAAGTTT 3`
RS303 5` ATCTTAGTCTTTCGAGGTTCCGG 3`
RS304 5` GCGGCGGGCGCGCCATCAACATAGAAAGGAACCATTT 3`
RS306 5` GATTTTATGGCAGAGGCACTTGCTG 3`
RS307 5` GCGGCGGGCGCGCCATTTCTCCATTTTGCCATCTTTT 3`
RS309 5` GGAAAGTAACGAGGGAGGCC 3`
RS310 5` GCGGCGGGCGCGCCCTAAACCGATGAAGCCTGTT 3`
EF1aA4-UP 5` ATGCCCCAGGACATCGTGATTTCAT 3`
EF1aA4-RP 5` TTGGCGGCACCCTTAGCTGGATCA 3`
grlfw 5` CACCATGGCGAATTCTCGTCAATAT 3`
grlrev 5` AGTCGGCGCGCCTTAGTTATGCTGTTTATATGAG 3`
actfw 5` TGCGACAATGGAACTGGAATG 3`
actrev 5` GGATAGCATGTGGAAGTGCATAC 3`
JM406 5` GCGAAAGTAATCGATGATACTATTGCAG 3`
JM407 5` TTAAAGCTTCCAACTACTTCGAGTTGGT 3`
JM408 5` CGATGATACTATTGCAGTCACATTC 3`
JM409 5` TAACTACTTCGAGTTGGTGTGATTG 3`
2.2 Methods
2.2.1 RNA isolation
Whole plants or plant organs were used to isolate RNA. Plant material was homogenized with a mortar and pistil under constant addition of liquid nitrogen. 1 ml Trizol (Molecular Research Center, Inc., Cincinnati, OH) was added per 100 mg of sample. After an incubation of 5 min at 25°C, 0.2 ml chloroform was added and samples were shaken for 15 sec. Additional incubation of 3 min at 25°C and centrifugation at 16000 g at 4°C followed.
The aqueous (=upper) phase was collected and transferred into a new 1.5-ml-tube. After adding 500 µl isopropanol (samples were incubated (10 min. 25°C) and centrifuged (10 min at 16000 g, 4°C). The resulting gelatinous pellet was washed with ice cold 70% (v/v) ethanol. After vigorous vortexing the resuspended pellet was centrifuged (10 min, 16000 g, 4°C). The RNA pellet was briefly air dried (3-5 min) and resolved in 50 μl diethylpyrocarbonate-treated H2O and incubated at 55-60°C for 10 min to ensure complete re-suspension.
2.2.2 cDNA synthesis
Reverse transcription was performed using the ‘RevertAidTM H Minus First Strand cDNA Synthesis Kit’ (Fermentas) following the instruction of the manufacturer.
2.2.3 Semiquantitative RT-PCR
The expression levels of SPI were quantified by semi-quantitative RT-PCR with primer pair RS197/RS198 and actin was used as control. For expression analysis of the GABI-Kat line the primer pair RS197/RS198 was used as a probe and the elongation factor 1 (primer pair EF1aA4-UP/EF1aA4-RP (Nesi et al. 2000)) as control. All RT-PCR analyses were done with 30 cycles.
2.2.4 Genomic plant DNA preparation
Genomic DNA for PCR analysis was prepared by using CTAB (Rogers and Bendich 1988).
2.2.5 Plasmid DNA preparation from bacteria
Plasmid preparation was performed using microcolumn-based pEQ-LAB Plasmid Miniprep Kit I (PEQLAB Biotechnology GmbH, Erlangen) according to the manufacturers protocol. Plasmid DNA from Agrobacterium tumefaciens was isolated using the Qiagen plasmid miniprep kit.
2.2.6 DNA-manipulation
DNA manipulation and cloning were carried out according to Sambrock and Russel (2001) or Ausubel et al. (1994). All polymerase-chain reaction (PCR)-amplified fragments were sequenced prior to further investigation. Sequencing was carried out on an ABI 310 Prism automated sequencer (Perkin-Elmer Applied Biosystems, Foster City, CA) according to the manufacturer’s instructions. Sequencing reactions were performed using Big-Dye kit 1.1 or Big-Dye kit 3.1 (Perkin Elmer Applied Biosystems, Foster City, CA).
2.2.7 Mapping approach
Various molecular simple sequence length polymorphism (SSLP) or derived cleaved amplified polymorphic sequence (dCAPS) markers were used. SSLP markers are based on PCR length differences obtained from different templates (mutant and wild- type background). dCAPS markers were used to utilize single nucleotide alteration between different ecotype to create a primer with a digestion site in the one but not in the other ecotype. For marker details see marker list (2.1.7).
2.2.8 TILLING Approach
Tilling is a fast and easy method to detect single nucleotide mismatches in a DNA heteroduplex (Till et al. 2003).
1.6 Kb PCR products were generated by using 86 appropriate primers (sequence on demand). Templates from several EMS mutant backgrounds (spi4.2, spi-11, spi12, spi139) and the corresponding wild type background were used for PCR. The PCR was conducted to generate single strands after the exponential PCR amplification, by decreasing the temperature. Equal amounts of mutant and wild type PCR products were mixed to produce heteroduplex or homoduplex DNA fragments. To identify single nucleotide mismatches in heteroduplex DNA fragments, a restriction digest was performed with CEL 1 that
exclusively cuts heteroduplex PCR fragments at the mismatch site. Single polymorphism between mutant and wild-type were analyzed on a 1% agarose gel.
2.2.9 Cloning of the DIS2-1 cDNA
For identification of the DIS2 gene a genomic fragment of At1g60430 WT gene from Landsberg erecta genomic DNA of approximately 900-bp was cloned using the PCR primers JM217F/JM218R (2.1.8). For the Atg1g30825 gene the primers were JMF406/JM407R (genomic clone ca. 1,900 bp) and JM408F/JM409R (cDNA clone ca.
960 bp) were used to amplify the DNA (2.1.8). The respective genomic and cDNA fragments were sub-cloned into a pGEM-T-easy vector (Promega), sequenced, and finally re-cloned into a trichome specific GLABRA2 promoter (Szymanski et al. 1998) for plant transformation using Hind III. Different transgenes were introduced into the dis2-1 mutant (Landsberg erecta background; (Feenstra 1978) by genetic crossing or by Agrobacterium tumefaciens (strain GV3101)-mediated floral dip transformation (Clough and Bent 1998).
For complementation through transient expression the BAC DNA (t17h7 containing the At1g30825 gene) was mixed with a green fluorescent protein (mGFP5) and precipitated on 1 μm diameter gold particles (BioRad, Hercules, CA, U.S.A.) following the manufacturer’s directions. The particles were loaded onto carrier membranes and shot into 7- to 10-day- old seedlings at 1,100 psi Helium pressure under a vacuum of 25 inches of Hg, using a PDS-1000/Helium driven Biolistic delivery apparatus (BioRad). Following complementation of the trichome cell phenotype, genomic and cDNA achieved from amplification (JMF406/JM407R for the Atg1g30825 gene) of the DIS2-1gene was cloned into pGEM-T-easy vector (Promega) and subjected to sequence analysis.
2.2.10 Cloning of the GRL cDNA
The GRL gene was identified by sequencing the Arabidopsis thaliana NAP125 homolog (At2g35110) in several grl alleles. Information on the genomic sequence was obtained from the MIPS Arabidopsis database (http://mips.gsf.de/cgi-bin/proj/thal/). Genomic DNA and cDNA were obtained by using primer combination grlfw and grlrev (2.1.8). The genomic and cDNA fragments were cloned in the pGEM-T-Easy vector (Promega) and sequenced.
2.2.11 Cloning of the SPI cDNA
The SPI gene was identified by sequencing various 1600 bp genomic DNA fragments obtained from the tilling experiment. These sequences were compared with sequence data from the MIPS Arabidopsis database (http://mips.gsf.de/cgi-bin/proj/thal/). Due to its large size, the cDNA was subdivided into 5 parts and sequenced. The fragments were generated with the following primer pairs: Fragment 1 (RS296 RS297), fragment 2 (RS300/RS301), fragment 3 (RS303/RS304), fragment 4 (RS306/RS307) and fragment 5 (RS309/RS310) (2.1.8). The PCR fragments were either directly sequenced or cloned into the pGEM-T- Easy vector (Promega) and then sequenced.
2.2.12 Plant growth conditions
Seeds were sawn on humid freshly prepared Arabidopsis culture soil. The trays were covered with a plastic lid and stored for two to three days at 4°C. Plants were grown under constant 16h light and 8h dark regime at a constant temperature of 22°C The lid was removed after three to four days. Rapid hypocotyl growth was induced by growing the seedlings for 8 days under low-light conditions.
Plates containing seeds were wrapped with aluminum foil and a 2 mm large hole was poked into the foil on top of the plates to allow light to enter. Root hair growth was challenged by tilting plates about 20 degree from the vertical plane. Under these growth conditions root hairs grew without surface contact.
2.2.13 Crossing of plants
Using fine-tweezers the anthers of flowers were removed when the petals grew out of the calyx. All remaining older and younger flowers were removed and the prepared flower was fixed on a wooden stick. After one to three days the stigma of the carpels were pollinated with pollen from another plant.
2.2.14 Plant transformation
Plants were transformed according to the “floral dip” method (Clough and Bent 1998). To increase plants fitness they were grown at 18°C until the first flowers appeared on inflorescence. Four days prior to plant transformation a 5 ml pre-culture in YEB medium of the transgenic Agrobacterium tumefaciens strain was incubated for two days at 29°C. 1
ml of this pre-culture was used to inoculate the final 200 ml culture, which was incubated for another two days at 29°C. The cells were pelleted at 5800 rpm for 12 minutes. The pellet was resuspended in 5% (w/v) sucrose solution containing 0.05% (v/v) Silwett L-77.
Inflorescence were dipped for approximately 20 seconds and afterwards covered with a lid.
The lid was removed after two days and after that plants were grown under standard growth conditions.
2.2.15 Seed sterilization
Seeds were incubated for 15 minutes in 3% NaClO3 (v/v) solution containing 0.1% triton X-100 (v/v). Afterwards they were washed three times with sterile water and then plated on MS-agar-plates (1% Murashige-Skoog salts, 3% sucrose, 0.7% agar-agar, pH5.7, (for screening: kanamycin (50 mg/ml))) (Murashige and Skoog 1962).
2.2.16 Drug treatments
Leaves of wild type (GFP-MAP4 transgenic plants) and dis2-1 carrying the GFP-MAP4 transgene were dipped in 2.5 µM Oryzalin and visualized at 5 min intervals for a total of 45 min.
2.2.17 Fluorescein diacetate staining
Plant material was incubated for 5 minutes in H2O containing 100 μg/ml Fluorescein diacetate (FDA). Afterwards the samples where washed with H2O, mounted on a slide, and analyzed under a spectrophotometric confocal laser scanning microscope (Leica TCS-SP2 AOBS).
2.2.18 Microscopy
Light and epifluorescence microscopy was performed using a LEICA-DMRE microscope using DIC optics (LEICA). Images were taken with a KY-F70 3-CCD JVC camera and frame grabbing DISKUS software (DISKUS, Technisches Büro, Königswinter) was used.
Plant measurements were performed with a Leica MZFLIII stereo binocular (LEICA) attached to an Hitachi HVC20 3 CCD camera and frame grabbing DISKUS software (DISKUS, Technisches Büro, Königswinter).
Scanning electron microscopy of dis2-1 trichomes was carried out as described previously (Mathur et al. 1999). For confocal laser scanning microscopy WT and dis2-1 plants carrying GFP-mTalin and GFP-MAP4 transgenes were grown on MS medium plates as described (Mathur et al. 1999), mounted in water and investigated using a 40× water- immersion lens. A spectrophotometric confocal laser scanning microscope (Leica TCS- SP2 AOBS) was used to visualize EGFP (excitation maximum 490/emission maximum 510 nm) as described (Mathur et al. 2003a). Images were sized and processed for brightness/contrast and CMYK alterations using the Adobe Photoshop 6.0 software.
2.2.19 Sequence analysis programs
PCR-Primers and constructs were designed using the Vector-NTI-suite 9 software (InforMax, Paisley PA4 9RF United Kingdom). DNA and protein sequence homology searches were performed with the BLAST search algorithm (Altschul et al. 1990) from NCBI. Amino-acid sequences were aligned with ClustalW to obtain multiple sequence alignments. Prediction programs were used such as PROSITE, NCBI conserved Domain search and PSORT (ExPASy Proteomics Server).
3 Results
Mutants belonging to the distorted class display prominent trichome cell distortions (Hülskamp et al. 1994). In this study three genes (DISTORTED2, GNARLED and SPIRRIG) were described and characterized with respect to molecular structure and mutant phenotypes.
3.1 The DISTORTED2 (DIS2) gene
3.1.1 Identification of DIS2 gene
Three members of the ‘distorted’ class mutants were identified as subunits of the ARP2/3 complex (Mathur et al. 2003a, Mathur et al. 2003b, Le et al. 2003, Li et al. 2003). As the ARP2/3 complex in animals consists out of seven subunits, a sequence homology comparison was carried out in which the four remaining ARP2/3 complex subunits were used as templates to identify putative homologs in the Arabidopsis thaliana genome. The A. thaliana homolog subunits ARPC2 (At1g30825) and ARPC3 (At1g60430) of the ARP2/3 complex are located on chromosome I (Mathur et al.2003a), in the region assigned to DIS2 (Feenstra 1978). The cDNAs from both genes (At1g60430 and At1g30825) were amplified and subsequently cloned under a cell-specific trichome promoter pGLABRA2 (Szymanski et al. 1998). The dis2-1 mutant was transformed with these constructs and T1 generation was screened for hygromycin-resistance.
Twenty-five independent hygromycin-resistant dis2-1 transgenic lines were obtained for each, pGL2::At1g60430 cDNA and pGL2::At1g30825. They were assayed for complementation of the distorted trichome phenotype. All 25 plants carrying the At1g30825 transgene displayed wild-type trichomes confirming that over expression of this gene in trichomes complemented the effects of the mutation. The T2 progeny of 18 pGL2::At1g30825 cDNA transgenic lines showed a 3:1 Mendelian segregation for the
wild-type:mutant trichome phenotype indicating that these lines had a single insertion. No rescue of the trichome phenotype was observed with the At1g60430 cDNA.
In addition, a genomic complementation was achieved by bombarding 8 to 10 days old dis2 seedlings with 1-μm gold particles coated with bacterial artificial chromosome (BAC)-DNA (whole BAC t17h7 containing the At1g30825 gene) and p35S::ER:GFP.
Wild-type like trichomes expressing GFP were observed between non-GFP-expressing distorted trichomes and confirmed that the BAC containing genomic DIS2 fragment rescued the trichome phenotype.
These experiments clearly showed that At1g30825 was DIS2 gene.
3.1.2 Molecular characterization of DIS2 gene
The primary structure of At1g30825 was evaluated by comparing the cDNA sequence amplified by RT-PCR and the sequence of cloned genomic DNA. The gene consists of 10 exons (Figure 6A) that encode a 957-bp wild-type (Landsberg ecotype) transcript (Figure 6B, wild-type cDNA) and showed conserved AG/GT nucleotides at the exon-intron splice junctions. The sequencing of the At1g30825 gene from dis2-1 genomic DNA revealed a G Æ A nucleotide exchange at position 1546 in the genomic clone (Figure 6C). This mutation abolished the GT splice donor site at the end of exon 5 and yielded two transcripts of different sizes (Figure 6B, dis2-1 cDNA): one transcript was 75 bp longer than the wild type due to an extension of exon 5, and the second one was 34 bp shorter than the wild type. In the first case the replacement of the G at the splice donor site by an A created an ATG codon and suppressed splicing. The intron was thus transcribed in continuation of the exon 5 (Figure 6C). The smaller transcript seemed to result from premature splicing that occurred 32 bp upstream of the mutation, at position 1522, where the GT nucleotide combination in exon 5 was apparently recognized as a new donor site (Figure 6D). The sequence alteration generated a new stop codon in both mutant open reading frames (Figure 6C, D, and Figure 7), leading to a non-functional, truncated protein.
Figure 6. Primary structure of the DISTORTED2 gene. (A) The DIS2 (At1g30825) gene contains 10 exons and yields a 957-bp transcript (B). The mutant yields two transcripts; a longer one (L) of 1,032 bp and a shorter one (S) of 923 bp. (C, D) A nucleotide exchange (G Æ A) at position 1,546 relative to the start codon destroys the GT splice donor site at the end of exon 5. This results in either a longer transcript (6B-L) as a new ATG is created, or generates a premature splice site that is recognized at 1,522 bp (6D) and leads to the excision of 34 bp from the transcript. Both situations lead to premature translational termination.
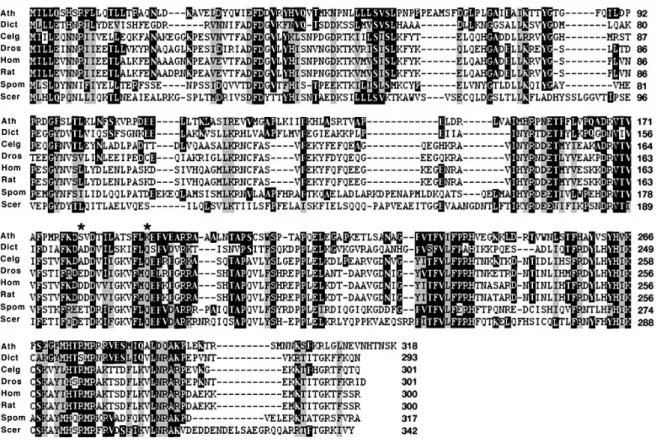
The 318 amino acid DIS2 protein featured amino acid identity to the ARPC2 subunit of the ARP2/3 complex. Sequence alignment to various animal proteins is shown in Figure 3.
BlastP searches in NCBI-database revealed a close plant homolog from Oryza sativa (68%
identity/ 84% similarity).
Figure 7. The derived amino acid sequence for DISTORTED2 aligned with protein sequences of the ARPC2 subunit of ARP2/3 complexes from reference organisms. (Ath, A. thaliana gi-28950897- At1g30825; Dict, D. discoideum: gi-10719881; 33% identity, 54% similarity; Celg, C. elegans gi- 25144430; 28% identity, 48% similarity; Dros, D. melanogaster gi-27923962; 26% identity, 48%
similarity; Hom, H. sapiens AF006085; 26% identity, 46% similarity; Rat, Rattus sps gi-27684953;
26% identity, 46% similarity; Spom, S. pombe gi-3121760; 26% identity, 46% similarity; Scer, S.
cervevisiae gi-1730675; 28% identity, 46% similarity). Black areas denote identical amino acids while grey-shaded residues are similar. Asterisks indicate the predicted protein truncation sites in the dis2-mutant.
3.1.3 Phenotype of distorted2-1
The distorted2 mutant was first described by its pronounced trichome phenotype (Feenstra 1978) and was found to be a member of the ‘distorted group’ (Hülskamp et al. 1994). The dis2-1 mutant developed leaf epidermal trichomes of irregular shape. Trichome branching occurred but branch lengths were significantly reduced and the branches appeared spike- like compared to wild type. Morphologically these trichomes were stubbed and more swollen (Figure 8). Furthermore, cell alterations were observed in hypocotyl, cotyledon, and root hair cells similar to those observed in wurm, distorted1 and crooked mutants (Mathur et al. 2003a, Mathur et al. 2003b). When grown under low-light conditions, leading to hypocotyl elongation, the hypocotyl length of dis2-1 mutants was reduced
and therefore significantly shorter than those of the wild type (10.3 mm ± 2.2 mm). On the other hand, mutant hypocotyls had increased diameters (367 µm ± 61 µm) in comparison to wild type (295 µm ± 29 µm). These size differences were reflected by alterations on the cellular level: the cells were wider (40 µm ± 6 µm in the mutant vs. 29 µm ± 4 µm in the wild type) and shorter (ranging from 43 µm to 347 µm in the mutant and from 340 µm to 1154 µm in the wild type). Under these conditions the hypocotyl and petiole cells of dis2-1 de-linked from each other and grew uncoordinatedly under rapid growth conditions as observed for other ARP2/3 mutants (Mathur et al. 2003a, Mathur et al. 2003b).
Figure 8. Comparison of leaf trichomes morphology in wild-type Arabidopsis thaliana (ecotype Landsberg erecta) and distorted 2–1 mutant. Wild-type trichomes (A) are erect, with well-extended stalks and branches (br). Inset ‘a’ shows an extended view of trichomes on wild-type leaves. (B) Mutant trichomes are short, randomly distorted and display spike-like (sp) stunted branches. dis2-1 trichomes (B) are swollen compared to wild-type (A) trichomes. Inset ‘b’ depicts the distribution of trichomes on mutant leaves. Length standard bars: A, B = 50 μm; a, b = 250 μm.
3.1.4 Subcellular phenotype of dis2-1 mutants
A detailed investigation of the aberrant F-actin cytoskeleton in dis2-1 mutant trichomes has been published recently (Schwab et al. 2003). The description matched the subcellular phenotype described for other ARP2/3 complex mutants (Mathur et al. 2003a, Mathur et al. 2003b).
The actin cytoskeleton defects accumulated during trichome cell expansion and reached the maximal strength in extending trichome branches of stable p35S::GFP:mTalin transformed dis2-1 plants. The F-actin, which usually evolved a fine-structure of thin, longitudinally extended cables (as in wild-type trichomes, Figure 9A, B), was typically assembled in short, thick, and cross-linked, bundles (Figure 9C, D). This aberrant F-actin organization increased the number of dense actin patches at the cell cortex (Figure 9C, d), and created local pockets of dense and fine actin (Figure 9D, d). Although dense actin- patches and fine F-actin regions are as well observed in wild-type trichomes at the junction and tips of branches (Mathur et al. 2003b), the number of dense actin patches and their location was characteristic in distorted trichomes.