• Keine Ergebnisse gefunden

Metabolic Programming

N/A
N/A
Protected

Academic year: 2021

Aktie "Metabolic Programming "

Copied!
135
0
0

Wird geladen.... (Jetzt Volltext ansehen)

Volltext

(1)

Metabolic Programming

of Hypothalamic Neurocircuits by Maternal High-Fat Feeding

Inaugural-Dissertation zur

Erlangung des Doktorgrades

der Mathematisch-Naturwissenschaftlichen Fakultät der Universität zu Köln

vorgelegt von

Merly Carlotta Vogt

aus Salzkotten

Köln, 2014

(2)

Berichterstatter/in: Prof. Dr. Jens C. Brüning Prof. Dr. Carien M. Niessen

Tag der mündlichen Prüfung: 8.4.2014

(3)

Table of contents

Table of contents ... I   Figure index ... IV   Table index ... VI   Abbreviations ... VII  

1   Introduction ... 1  

1.1   Metabolic disorders of epidemic proportions in the 21

st

century ... 1  

1.1.1   Obesity ... 1  

1.1.2   Type 2 diabetes mellitus ... 3  

1.1.3   Maternal obesity, maternal diabetes and the concept of metabolic programming... . 4  

1.1.3.1 Origin of the metabolic programming hypothesis ... 4  

1.1.3.2 Adverse pregnancy outcomes in response to maternal obesity and diabetes.. ... 5  

1.2   The role of the hypothalamus in the regulation of energy homeostasis ... 7  

1.2.1   Structural organization of the hypothalamus ... 8  

1.2.2 The Arcuate nucleus of the hypothalamus (ARH) ... 10  

1.2.2.1 ARH neuronal populations and the central melanocortin circuitry ... 10  

1.2.2.2 Intra-and extra-hypothalamic ARH neuronal circuits ... 13  

1.2.3 Hormonal signals regulating the melanocortin circuitry ... 15  

1.2.3.1 Insulin signaling ... 15  

1.2.3.2 Leptin signaling ... 17  

1.2.3.3 Insulin and leptin action on ARH neurons ... 18  

1.3   The hypothalamus as a primary target site for metabolic programming ... 23  

1.3.1 Development of hypothalamic neurocircuits ... 23  

1.3.2 Different animal models of metabolic programming show defects in hypothalamic neurocircuit development ... 25  

1.3.3 Hypothalamic insulin and leptin signaling in metabolic programming ... 27  

1.4   Objectives ... 28  

2   Materials and methods ... 30  

(4)

2.1   Chemicals and biological material ... 30  

2.2   Molecular biology ... 33  

2.2.1   Isolation of genomic DNA ... 33  

2.2.2   Quantification of nucleic acids ... 33  

2.2.3   PCR for genotyping ... 33  

2.2.4   Analysis of gene expression ... 34  

2.3   Cellular biology ... 36  

2.3.1   Immunohistochemistry ... 36  

2.3.1.1   POMC and AgRP neuronal cell count ... 36  

2.3.1.2   α-MSH and AgRP immunostaining ... 36  

2.3.1.3   Insulin and vAChT fluorescent double-immunostaining ... 38  

2.3.1.4   Analysis of pancreatic β-cell mass ... 38  

2.3.2   Electrophysiology ... 39  

2.4   Biochemistry ... 40  

2.4.1 Enzyme-linked immunosorbent assays (ELISA) ... 40  

2.4.2 MALDI-TOF mass spectrometry ... 41  

2.5   Mouse Experiments ... 42  

2.5.1   Animal care ... 42  

2.5.2   Generation of POMC

eGFP

, POMC

ΔIR

and AgRP

tdTomato

mice ... 42  

2.5.3   Analysis of body composition ... 42  

2.5.4   Serum analyses ... 43  

2.5.5   Determination of HOMA-IR ... 43  

2.5.6   Analysis of maternal milk composition ... 43  

2.5.7   Glucose- and insulin tolerance tests ... 44  

2.5.8   Determination of glucose-stimulated insulin, C-peptide, GLP-1 and FFA secretion ... 44  

2.5.9   Determination of L-arginine-stimulated insulin secretion ... 44  

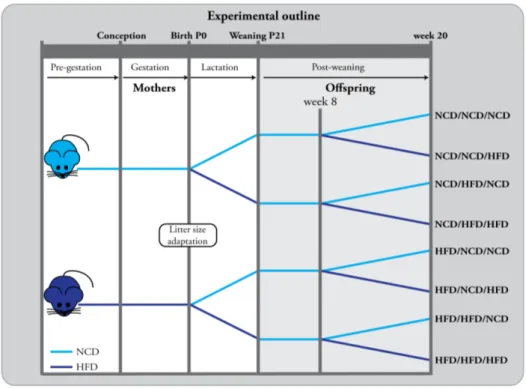
2.5.10   Maternal diet manipulation and analytical time-points of their offspring .... 44  

2.6   Computer analyses ... 45  

2.6.1   Software ... 45  

2.6.2   Statistical analyses ... 45  

3 Results ... 47  

(5)

3.1   Establishing a mouse model to define the critical timing of maternal high-fat

feeding on metabolic programming in the offspring ... 47  

3.2   Maternal HFD-feeding exclusively during lactation predisposes the offspring for metabolic disorders ... 49  

3.3   Effects of maternal HFD-feeding during lactation on hypothalamic neurocircuits 53   3.4   Maternal HFD-feeding exclusively during lactation impairs axonal projections of ARH neurons to intra-hypothalamic target sites ... 60  

3.5   Deciphering the role of neuronal insulin signaling in the predisposition for metabolic disorders in NCD/HFD offspring ... 62  

3.6   POMC-specific IR-deficiency in NCD/HFD offspring prevents altered axonal projections of POMC neurons to preautonomic PVH ... 65  

4 Discussion ... 72  

4.1 Altering maternal diet during hypothalamic neurocircuit development as a valuable model to study metabolic programming ... 72  

4.1.1 Environmental insults during the postnatal phase of development result in the strongest metabolic impairments in the offspring in rodents ... 73  

4.1.2 Impairment of ARH neuronal axon formation might be the common and main driver of metabolic programming ... 74  

4.1.3 Hormonal, cellular and molecular alterations possibly affecting ARH neuronal axon formation ... 77  

4.2 Abnormal neuronal insulin signaling disrupts POMC axon formation and predisposes for impaired glucose metabolism ... 80  

4.3 A novel brain-pancreas circuit regulating glucose homeostasis? ... 84  

4.4 Nice study in rodents, but how is this all relevant to the human situation? ... 88  

4.5 Conclusions ... 90  

5 Summary ... 92  

6 Zusammenfassung ... 93  

7 References ... 94  

8 Acknowledgements ... 120  

9 Erklärung ... 122  

(6)

Figure index

Figure 1.1 Schematic illustration of the global obesity and diabetes epidemic ... 1  

Figure 1.2 Schematic overview of the hypothalamus in the brain ... 9  

Figure 1.3 Schematic overview of ARH neuronal projections throughout the CNS ... 15  

Figure 1.4 Insulin and leptin signaling in POMC and AgRP/NPY neurons ... 22  

Figure 1.5 Development of hypothalamic neurocircuits in rodents and humans ... 25  

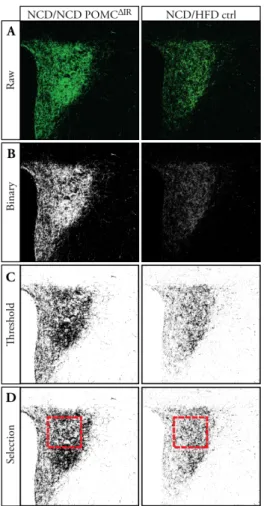
Figure 2.3.1 Representative step-by-step quantification of α-MSH and AgRP immunostaining ... 37  

Figure 3.1.1 Experimental outline to determine the critical timing of maternal HFD- feeding on metabolic programming in the offspring ... 48  

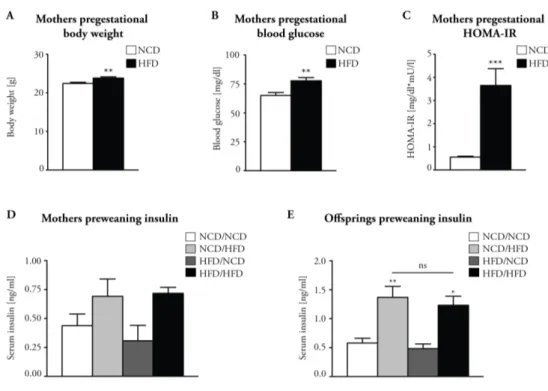
Figure 3.1.2 Maternal HFD-feeding induces pregestational metabolic abnormalities and hyperinsulinemia during lactation in the offspring ... 49  

Figure 3.2.1 Maternal HFD-feeding exclusively during lactation predisposes the offspring for metabolic disorders ... 51  

Figure 3.2.2 Maternal HFD-feeding exclusively during lactation predisposes the offspring for metabolic disorders - also in females ... 52  

Figure 3.3.1 Hypothalamic neuropeptide expression profile reveals alterations only in ARH downstream neurons ... 53  

Figure 3.3.2 Maternal HFD-feeding during lactation does not induce hypothalamic inflammation in the offspring ... 54  

Figure 3.3.3 Maternal HFD-feeding during lactation does not affect ARH neuronal cell number ... 55  

Figure 3.3.4 POMC processing to α-MSH is not impaired in response to postnatal HFD-exposure ... 57  

Figure 3.3.5 POMC electrophysiological properties are unaltered in offspring from postnatally HFD-fed mothers ... 58  

Figure 3.4.1 Maternal HFD-feeding exclusively during lactation impairs axonal projections of ARH neurons to intra-hypothalamic target sites ... 61  

Figure 3.5.1 Milk composition is highly enriched in mothers exposed to HFD during

lactation ... 62  

(7)

Figure 3.5.2 POMC-specific IR-deficiency does not protect from adiposity or

insulin resistance, but improves glucose tolerance in NCD/HFD offspring ... 64   Figure 3.6.1 POMC-specific IR-deficiency in NCD/HFD offspring rescues POMC axonal projections to preautonomic regions in the PVH ... 68   Figure 3.7.1 Increased parasympathetic innervation of pancreatic β-cells upon

POMC-specific IR-deficiency in NCD/HFD offspring ... 70  

Figure 3.7.2 POMC-specific IR-deficiency protects from impaired glucose-stimulated

insulin secretion in offspring from postnatally HFD-fed mothers ... 71  

(8)

Table index

Table 2.1.1 Chemicals and enzymes used in this study... 30

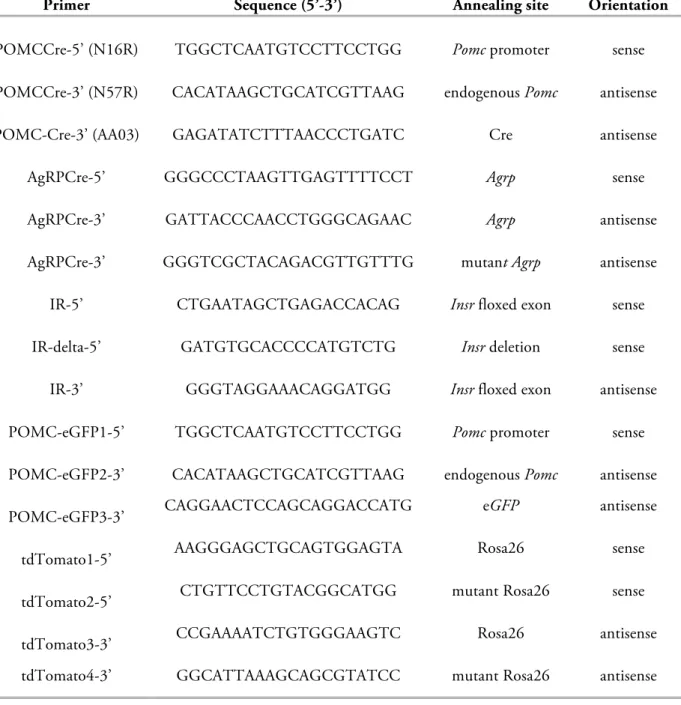
Table 2.2.1 Oligonucleotides used for genotyping... 34

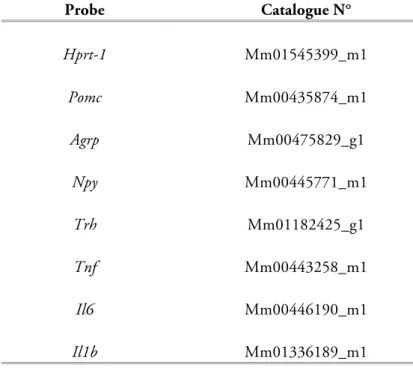
Table 2.2.2 Probes used for quantitative real-time PCR... 35

(9)

Abbreviations

(dd)H

2

O (double distilled) water

°C degrees Celsius

3’ three prime end of DNA sequences

5’ five prime end of DNA sequences

A adenosine

AAV adeno-associated virus

ACTH adrenocorticotropic hormone

AgRP agouti-related peptide ANOVA analysis of variance

ANS autonomic nervous system

ARH arcuate nucleus of the hypothalamus

ATP adenosine triphosphate

AUC area under the curve

BMI body mass index

BNST bed nucleus of the stria terminalis

BSA bovine serum albumin

C cytosine

Ca

2+

calcium

cAMP cyclic adenosine monophosphate

cDNA complementary DNA

CLIP cotricotropin-like intermediate peptide

CNS central nervous system

CPE carboxypeptidase E

Cre site-specific recombinase from phage 1 (causes recombination) CRH corticotropin-releasing hormone

DAPI 4’, 6-diamidino-2-phenylindole

DMH dorsomedial nucleus of the hypothalamus DMX motor nucleus of the vagus

DNA desoxyribonucleic acid

dNTP deoxynucleoside triphosphate

(10)

DOB day of birth

DVC dorsal vagal complex

E embryonic day

e.g. exempli gratia

eGFP enhanced green fluorescent protein ELISA enzyme-linked immunosorbent assay

EtOH ethanol

FFA free fatty acid

fl floxed

FOXO forkhead box

fx fornix

g gram

G guanosine

GABA γ-aminobutyric acid

GDM gestational diabetes mellitus GLP-1 glucagon-like peptide 1

GLUT glucose transporter

GTT glucose tolerance test

h hour

HCl hydrochloric acid

HFD high-fat diet

HGP hepatic glucose production

HOMA-IR homeostatic model assessment of insulin resistance HRP horse-radish peroxidase

i.p. intraperitoneal

i.v. intravenous

ICV intracerebroventricular

Il6/1b interleukin 6/1b

IML intermediolateral nucleus

IR insulin receptor

IRS insulin receptor substrate

ITT insulin tolerance test

(11)

JAK2 janus kinase 2

KATP ATP-dependent potassium channel

L liter

LepRb long form of the leptin receptor LGA large for gestational age

LH lateral hypothalamic area

LPH lipotropin hormone

m milli

MAP mitogen-activated protein MC(1-5)R melanocortin 1-5 receptor

ME median eminence

min minute

mTOR mammalian target of rapamycin

n nano

NCD normal chow diet

NEFA non-esterified fatty acid

NHP nonhuman primate

NPY neuropeptide Y

NTS nucleus of the solitary tract

ob leptin

p pico

P postnatal day

PAG periaqueductal grey

PBN parabrachial nucleus

PBS phosphate buffered saline

PC1/2/3 prohormone convertase 1/2/3 PCR polymerase chain reaction

PDK1 phosphoinositide-dependent kinase 1

PFA paraformaldehyde

PI3K phoshoinositol-3 kinase

PIP2 phosphatidyl-inositol-4,5-bisphosphate

PIP3 phosphatidyl-inositol-3,4,5-trisphosphate

(12)

POMC proopiomelanocortin

PVH paraventricular nucleus of the hypothalamus PVT paraventricular thalamus

RNA ribonucleic acid

RT room temperature

SEM standard error of the mean

SH Src-homology

SOCS3 suppressor of cytokine signaling 3 STAT3 signal transducer of transcription 3

STZ streptozotocin

T thymidine

T1DM type 1 diabetes mellitus T2DM type 2 diabetes mellitus

TH tyrosin hydroxylase

TNF tumor necrosis factor

TRH thyrotropin-releasing hormone TRPC transient receptor potential cation vACHT vesicular acetylcholine transporter

VMH ventromedial nucleus of the hypothalamus VTA ventral tegmental area

α-MSH α-melanocyte-stimulating hormone

µ micro

(13)

1 Introduction

1.1 Metabolic disorders of epidemic proportions in the 21

st

century

1.1.1 Obesity

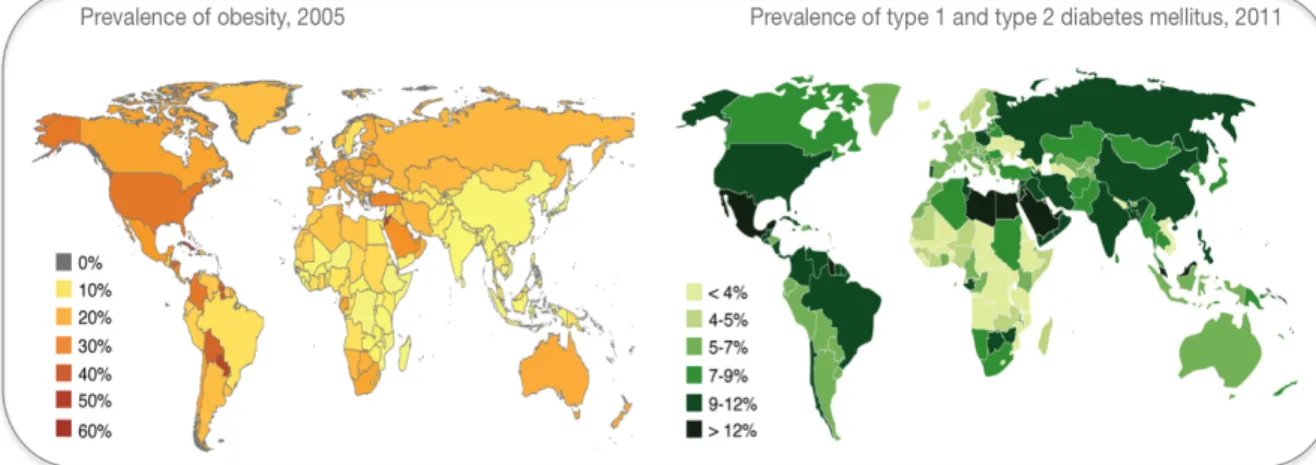
Hardly any other epidemic in history has been as apparent as the current global rise in the prevalence of overweight and obesity (Figure 1.1). Over the last 30 years the worldwide incidences of obesity have nearly doubled to approximately 500 million obese and 1.4 billion overweight people in 2008 (WHO, 2013c).

Figure 1.1: Schematic illustration of the global obesity and diabetes epidemic Over the last decades, the prevalence of obesity has dramatically increased, affecting approximately 20 % of the adult population in Central Europe and 30 % in the United States of America (USA).

Similarly, Diabetes mellitus is diagnosed in approximately 5-7 % and 7-9 % in Central Europe and the USA, respectively. Illustrations were adapted from the World Health Organization and the International Diabetes Federation (WHO and IDF).

Overweight and obesity are commonly assessed by the body mass index (BMI). The BMI is calculated by the body weight in kilogram divided by the square of the height in meter [kg/m

2

] of an individual (WHO, 2013c). Whereas a normal BMI ranges from 18.5 to 24.9, a person with a BMI above or equal to 25 is considered overweight and even diagnosed with obesity, if the BMI is equal to, or exceeds the critical threshold of 30 (WHO, 2013c).

However, the BMI as a measure of adiposity has been criticized as it neglects to distinguish

between fat and lean mass, as well as between the distribution of body fat (Snijder et al.,

2006). Intra-abdominal or visceral fat is considered to confer greater risk to develop obesity-

associated diseases than subcutaneous fat (Bergman et al., 2006). Therefore, measures other

(14)

than the BMI, such as the waist-to-hip ratio, the waist circumference, or the body fat percentage have been applied to categorize an individual’s state of adiposity (Snijder et al., 2006). Nevertheless, due to the inexpensive and simple measures needed to determine the BMI, as well as the large amount of epidemiological data available in the literature, the BMI is still the most commonly used measure to correlate an individual’s state of adiposity with the associated risks to develop certain co-morbidities.

Generally, obesity develops when the overall caloric intake exceeds the calories expended. Such a chronic imbalance in energy homeostasis can have long-term consequences: Apart from psychological problems resulting e.g. from social exclusion and subsequent introversion, overweight and/or obesity can lead to the development of Type 2 Diabetes mellitus (T2DM), cardiovascular diseases, stroke and certain forms of cancer (i.e.

endometrial, colon and breast cancer), linking overweight and obesity to the deaths of approximately 2.8 million people per year (WHO, 2013c). As a consequence, recent prognoses predict an overall decline in life expectancy for the first time in centuries (Olshansky et al., 2005).

In light of these developments, efforts have been made to identify the underlying causes responsible for the obesity epidemic. Although rare monogenetic mutations, such as mutations in key players involved in the central regulation of energy homeostasis, such as the melanocortin 4 receptor (Mc4r), proopiomelanocortin (Pomc), or leptin (ob) genes result in drastic obese phenotypes, they can only be found in a minority of patients, and can therefore not be held accountable for the epidemic dimensions of obesity (Farooqi, 2008; Krude et al., 1998; Montague et al., 1997; Santini et al., 2009). In contrast, complex polygenetic variations in combination with unfavorable environmental factors are thought to mainly contribute to the development of increased adiposity (Hetherington and Cecil, 2010).

Importantly, the global shift to a more sedentary lifestyle and increased consumption of

palatable, high-caloric, energy-dense food does not only increase an individual’s risk to

develop obesity, but also augments the susceptibility for future generations. Multiple human

epidemiological, as well as animal studies have demonstrated that children of obese mothers

are more susceptible to eventually develop metabolic disorders themselves, a phenomenon

that is often referred to as “metabolic programming” (see also Chapter 1.1.3) (for review, see

(Sullivan and Grove, 2010)).

(15)

Thus, further efforts have to be made to unravel molecular mechanisms contributing to the development and manifestation of obesity to not only find novel therapeutic strategies, but also preventative measures to effectively intervene with the obesity epidemic, as well as its associated diseases.

1.1.2 Type 2 diabetes mellitus

As one of the main consequences of overweight and obesity, T2DM has also evolved into a global epidemic. In 2012, the international diabetes federation estimated the total number of patients with diabetes mellitus to be 382 million worldwide (Figure 1.1) (IDF, 2013). Of these 382 million, approximately 10 % account for patients diagnosed with Type 1 diabetes mellitus (T1DM) (IDF, 2013), which is characterized by chronic hyperglycemia caused by the complete loss, or highly impaired production of insulin, secondary to an autoimmune- reaction-mediated destruction of pancreatic β-cells (WHO, 2013b). In contrast, T2DM is characterized by chronic hyperglycemia caused by the development of insulin resistance in peripheral organs, such as the muscle, white adipose tissue and the liver, as well as the central nervous system (CNS) (for review, see (Biddinger and Kahn, 2006)). As previously described, excessive caloric intake in combination with physical inactivity are the main reasons for the development of obesity, which is associated with chronic hyperglycemia. Under these pathological conditions, insulin is no longer able to efficiently stimulate glucose uptake into muscle and fat, and further fails to suppress hepatic glucose production, thereby additionally increasing blood glucose levels. Although hyperactivation of pancreatic β-cells is initially able to compensate for this insulin resistance, chronic hyperglycemia eventually leads to progressive deterioration of pancreatic β-cell function and finally, to exhaustion and loss of these cells, resulting in relative insulin deficiency in T2DM patients (Kahn et al., 1993;

Polonsky et al., 1988; Prentki and Nolan, 2006).

The T2DM-associated hyperglycemia can have tremendous effects on the function

of multiple organs as it increases the risk for microvascular damage (i.e. retinopathy,

nephropathy and neuropathy) (WHO, 2006). Moreover, T2DM is associated with an

increased risk of macrovascular complications and, – if left untreated, or poorly controlled –

can eventually lead to organ failure, ischemic heart disease or stroke (Vasudevan et al., 2006;

(16)

WHO, 2006). Therefore, despite the growing knowledge about cellular and molecular changes associated with T2DM, the ever-increasing incidences of T2DM highlight the necessity to decipher all underlying aspects contributing to the development and progression of this disease.

1.1.3 Maternal obesity, maternal diabetes and the concept of metabolic programming Coincident with the ever-increasing cases of obesity and T2DM, the number of obese and/or diabetic women of childbearing age has reached an all-time high. Depending on the country and ethnicity of the cohort analyzed, studies estimate that currently 15-40% of pregnancies are affected by maternal obesity, and 3-10% of pregnancies by maternal diabetes (i.e. T1DM, T2DM and gestational diabetes) (Anna et al., 2008; Yu et al., 2013). This epidemic development has been a matter of great concern, because maternal obesity and diabetes have been associated with a multitude of adverse pregnancy outcomes, both for the mother and the child (Catalano and Ehrenberg, 2006; Dabelea et al., 2000; Torloni et al., 2009a; Yu et al., 2013).

1.1.3.1 Origin of the metabolic programming hypothesis

The hypothesis that early life experience can determine the metabolic fate of an individual

evolved as early as during the 1960s. Dubos and colleagues were the first to find a direct

association between the nutritional content of maternal milk and the growth rate, as well as

the lifelong efficacy of energy utilization of the offspring in mice (Dubos et al., 1966). In

line with these results obtained in rodents, Ravelli and colleagues demonstrated that

nutritional deprivation during distinct phases of pregnancy enhances the propensity to

develop metabolic disorders during adulthood in humans. These findings demonstrated that

metabolic programming occurs in response to hormonal insults during a critical time

window of particular vulnerability: Exposure to the Dutch famine (which occurred in the

winter of 1944-1945) during the first half of pregnancy significantly increased the rate of

obesity later in life (Ravelli et al., 1976). In contrast, undernutrition during the third

trimester of pregnancy decreased the rate of obesity, while at the same time increasing the

(17)

1998). In similar retrospective studies, David Barker and his colleagues found a negative correlation between birth weight (as an indicator of poor maternal nutrition during pregnancy) and the risk of developing cardiovascular, as well as metabolic diseases during adult life in an independent human cohort (Barker et al., 1993; Barker and Osmond, 1986;

Barker et al., 1989; Hales et al., 1991).

Although the ideas of latent health effects stemming from the perinatal period preceded the work of David Barker (Forsdahl, 1977; Ravelli et al., 1976), he is considered as one the pioneers of metabolic programming research. Based on his findings, David Barker postulated the “fetal and infant origin of adult disease” hypothesis (Barker, 1990) (later rephrased into “developmental origins of health and disease”) (Barker, 2007), which was further extended and modified by the “thrifty phenotype hypothesis” (Hales and Barker, 1992, 2001), as well as the “developmental plasticity” (Barker, 2004) and “perinatal programming” theory ((Lucas, 1991), for review, see (McMillen and Robinson, 2005)).

Together, these concepts suggest that environmental factors in response to maternal health and nutrition during a critical plastic phase of development trigger adaptive responses in the developing fetus, which result in persistent morphological modifications and altered sensitivity of organs involved in metabolic regulation. From an evolutionary perspective, these adaptations would enable a highly efficient use of metabolites and thereby increase the chances of survival in times of scarce food availability. However, upon an imbalance between the developmental and postnatal (nutritional) environment, these adaptations could prove detrimental, resulting in cardiovascular and/or metabolic diseases. These persistent developmental changes on the efficacy and tight control of metabolism in the offspring are often referred to as “metabolic programming”. However, underlying mechanisms of how metabolic programming might be mediated still remain largely elusive.

1.1.3.2 Adverse pregnancy outcomes in response to maternal obesity and diabetes

Over the last decade, the main focus of metabolic programming research has expanded from

studying undernutrition to also include deciphering the effects of over and/or malnutrition,

as well as hyperglycemia during pregnancy on the future health of the offspring. Of note,

studies analyzing the effects of maternal overnutrition on the offspring’s metabolic health

found a similar link between elevated birth weight and an increased risk to develop

(18)

metabolic diseases as previously described for children born with low birth weight (Pettitt and Jovanovic, 2001). These findings highlight the crucial importance of a well-balanced hormonal and nutritional milieu for the developing fetus. In more recent studies, maternal BMI has replaced birth weight as an indicator for future health risks of the offspring.

Prepregnancy BMIs above 25 have been shown to increase the risk for complications during pregnancy, such as pre-eclampsia, extreme pre-term deliveries and need for caesarean sections, thereby further augmenting the risk for the necessity of neonatal intensive care and possibly neonatal death (Cnattingius et al., 2013; Doherty et al., 2006; Kalk et al., 2009).

Moreover, even under normal pregnancy progression, children of overweight and/or obese women have an increased risk to be large for gestational age (LGA) and are more likely to be born macrosomic (Yu et al., 2013). In turn, these neonatal abnormalities are associated with higher levels of obesity and T2DM during childhood that often persist throughout lifetime, possibly resulting in the development of certain co-morbidities including hypertension, coronary heart disease, or stroke (Ahlsson et al., 2007; Boney et al., 2005; Pham et al., 2013;

Salsberry and Reagan, 2005; Whitaker, 2004).

Apart from the direct effects of maternal adiposity on the offspring’s health, several studies clearly show a positive correlation between maternal BMI and the incidence of gestational diabetes mellitus (GDM) (Torloni et al., 2009b). GDM is defined as a state of glucose intolerance with onset or first recognition during pregnancy (WHO, 2013a).

Importantly, GDM also develops in normal weight women and has been shown to increase

the risk factors for adverse pregnancy outcomes independent of the maternal prepregnancy

BMI or weight gain during pregnancy (Jovanovic-Peterson et al., 1991; Schaefer-Graf et al.,

2003). Thus, children born to diabetic mothers are more likely to be LGA, to be born with

asymmetric macrosomia and to eventually develop obesity and T2DM irrespective of the

maternal state of adiposity (Alberico et al., 2014; Dabelea and Pettitt, 2001; Schaefer-Graf et

al., 2003; Silverman et al., 1998). However, dietary interventions in combination with well-

controlled physical exercise (and in some cases insulin therapy) have been proven to work

effectively against the chronic hyperglycemia in GDM patients, thereby protecting the

offspring from adverse pregnancy outcomes (Crowther et al., 2005). Nevertheless, even

slightly elevated glucose levels during pregnancy, which are below the official criteria to be

diagnosed with GDM, can lead to macrosomia, neonatal hyperinsulinemia and childhood

obesity (Metzger et al., 2008) (Deierlein et al., 2011). Together, these findings demonstrate

(19)

the necessity to unravel the molecular and cellular changes not only in response to pathological maternal conditions such as obesity or diabetes during pregnancy, but also in response to slightly elevated levels of hormones and nutrients, such as insulin and glucose, predisposing for metabolic disorders throughout lifetime. In the search of the cause for this predisposition, hypothalamic neurocircuits regulating energy and glucose homeostasis have been identified as primary targets of metabolic programming,

1.2 The role of the hypothalamus in the regulation of energy homeostasis

The hypothesis that a stable internal environment even under changing external conditions is essential for the health and survival of an organism was originally suggested by the French Physiologist Claude Bernard and further developed to the definition of “homeostasis” by Walter B. Cannon (Cannon, 1929; Gross, 1998). Accordingly, energy homeostasis is defined as the equilibrium of energy intake (food consumption) and energy expenditure (basal and exercise-induced metabolic rate) (WHO, 2013c). Similarly, the term glucose homeostasis has been used to describe all processes involved in maintaining blood glucose concentrations at relatively stable levels. The detrimental effects of an imbalance in energy and glucose homeostasis are evident by the current obesity and T2DM epidemics responsible for a multitude of health complications and exploding health care costs.

Whereas Claude Bernard suggested a significant role of the brain in the regulation of glucose homeostasis already in the middle of the 19

th

century, the notion of the central nervous system (CNS), specifically the hypothalamus, as being one of the most important regulators of energy homeostasis did not evolve until the beginning of the 20

th

century.

Tumors in that particular brain region lead to hyperphagia, obesity and retarded puberty

(known as the Babinski-Frohlich syndrome) (Bruch, 1993; Gross, 1998). Subsequent

lesioning and electrical stimulation studies of distinct regions in the hypothalamus in rodents

suggested the existence of specialized hypothalamic centers either mediating hunger, i.e. the

lateral hypothalamic area (LH) or satiety, i.e. the arcuate nucleus of the hypothalamus

(ARH), the ventromedial hypothalamus (VMH) and the paraventricular nucleus of the

hypothalamus (PVH) (Anand and Brobeck, 1951; Gold, 1973; Hetherington and Ranson,

1940). Although the functions of these hypothalamic areas are not as black and white as

(20)

initially thought, but more complex and intertwined, these experiments provided direct evidence that an intact hypothalamus was essential for maintaining energy homeostasis.

Since then, a completely new field of research has emerged, dedicated to understanding the mechanisms underlying an impaired efficiency of hypothalamic neurocircuits in regulating energy and glucose homeostasis and thereby contributing to the development and manifestation of metabolic disorders.

1.2.1 Structural organization of the hypothalamus

As the key site in the CNS for the integration and translation of multiple biological signals,

the hypothalamus has an array of unique features that enable the mediation of adaptive

endocrine, autonomic and behavioral responses to maintain homeostasis: First, the

hypothalamus displays an extensive structural complexity. Apart from its 11 major nuclei

and compartmental areas, which are situated symmetrically around the third ventricle, the

hypothalamus harbors several small nuclei as well as large fiber bundles (Figure 1.2) (Simerly,

1995). Second, the hypothalamus, which occupies the ventral part of the diencephalon

located beside the midbrain of the brainstem and below the thalamus, forms extensive

bilateral neuronal connections within intra-, but also extra-hypothalamic sites (such as

autonomic centers and the limbic system) (Hess, 1957; Simerly, 1995). Finally, its relative

localization in the CNS adjacent to the third ventricle enables reciprocal communication

with peripheral organs via blood-borne signals.

(21)

Figure 1.2: Schematic overview of the hypothalamus in the brain

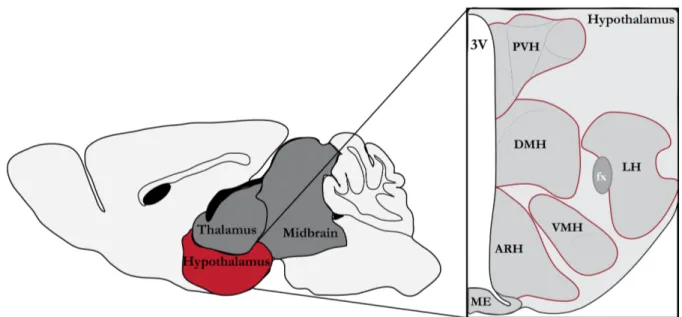
The hypothalamus is located beside the midbrain of the brainstem and below the thalamus. The major hypothalamic nuclei are situated symmetrically around the third ventricle above the median eminence. ME, median eminence; ARH, arcuate nucleus of the hypothalamus; VMH, ventromedial nucleus of the hypothalamus; DMH, dorsomedial nucleus of the hypothalamus; PVH, paraventricular nucleus of the hypothalamus; LH, lateral hypothalamic area; fx, fornix; 3V, third ventricle.

With regard to energy homeostasis, the ARH has evolved as one of the most intensively studied regions in the CNS. The ARH resides at the mediobasal hypothalamus adjacent to the third ventricle and the median eminence (ME). The ME is defined as a circumventricular organ with high permeability for blood-borne signals due to its fenestrated capillaries, high vascularization and a “leaky” blood-brain barrier (Ciofi et al., 2009;

Rodriguez et al., 2010). This unique location allows the ARH to integrate peripheral

nutritional and hormonal signals, which reflect the energy status of the body, into neuronal

responses to ultimately adapt behavior. At more rostral areas, the PVH resides in the

periventricular zone at the dorsal end of the third ventricle. The main functions of the PVH

are the regulation of pituitary hormones, as well as the modulation of the autonomic nervous

system in response to changes in energy status (Figure 1.2) (Biag et al., 2012). Additionally,

neurons of the VMH, an area that lies just above the ARH, have been established as crucial

regulators of feeding behavior and glucose homeostasis, e.g. in the detection and counter-

regulation of hypoglycemia (Beverly et al., 1995; Levin et al., 2008). Residing dorsally of the

(22)

VMH, the dorsomedial hypothalamus (DMH) represents one of the main downstream target sites of neuronal projections from other hypothalamic nuclei and is therefore suggested to play an integrative role, for example as a relay center of ARH to PVH neuronal connections, thereby modulating appetite and emotional behavior (Chao et al., 2011;

Thompson and Swanson, 1998). In contrast to the aforementioned hypothalamic nuclei, the LH is a loosely organized and heterogeneous zone that (as it name suggests) occupies most of the lateral area of the hypothalamus (Bernardis and Bellinger, 1993). Moreover, as the most-intensively interconnected areas of the hypothalamus, the LH has not only been implicated in the regulation of energy and glucose homeostasis via endocrine and autonomic mechanisms, but has further been shown to modulate cognitive and skeletal motor functions (Bernardis and Bellinger, 1993; Cui et al., 2012).

Although substantial progress has been made in unraveling the neuronal and hormonal circuits of these distinct hypothalamic nuclei controlling energy and glucose homeostasis, we are only starting to understand the complexity of their regulatory processes and how developmental and/or pathological insults may impair their efficiency to adapt energy balance to meet the prevailing demands of the organism.

1.2.2 The Arcuate nucleus of the hypothalamus (ARH)

1.2.2.1 ARH neuronal populations and the central melanocortin circuitry

Two functionally antagonistic neuronal populations that reside in the ARH orchestrate transduction of peripheral nutritional and hormonal signals into behavioral responses: the anorexigenic proopiomelanocortin (POMC)-expressing and the orexigenic agouti-related peptide/neuropeptide Y (AgRP/NPY)-coexpressing neurons (for review, see (Butler, 2006)).

To exert its anorexigenic effects, the pro-protein POMC has to undergo

posttranslational modifications mediated by cell type-specific prohormone convertases

resulting in the biologically active neurotransmitter α-melanocyte-stimulating-hormone (α-

MSH) (for review, see (Wardlaw, 2011)). Initially, POMC is endoproteolytically cleaved by

the prohormone convertase 1/3 (PC1/3) into two main derivatives: the adrenocorticotropic

hormone (ACTH) and β-lipotropin hormone (β-LPH), as well as a 16 kDa N-terminal

fragment. In the hypothalamus, further processing of ACTH by PC2 yields a truncated form

(23)

of ACTH (ACTH

1-17

) and the corticotropin-like intermediate peptide (CLIP). Subsequently, carboxypeptidase E (CPE) endoproteolytically cleaves the C-terminal part of ACTH

1-17

, which is then amidated to form desacetyl α-MSH, the predominant form of α-MSH in the rodent hypothalamus. Moreover, PC2 and CPE further process β-LPH into β-MSH and the opioid peptide β-endorphin, as well as the N-terminal part of POMC into γ-MSH, neuropeptides that have also been implicated in the modulation of energy balance (for review, see (Wardlaw, 2011)). Accordingly, mutations resulting in impaired sorting or processing of POMC have been associated with the development of obesity, both in humans and rodents (Creemers et al., 2008; Jackson et al., 1997; Lloyd et al., 2006).

Of note, POMC expression is not restricted to the ARH, but can also be found in extra-hypothalamic sites, such as the retina, spinal cord, the commissural part of the nucleus of the solitary tract (NTS) and the area postrema in the brainstem (Bronstein et al., 1992;

Knigge et al., 1981; Lein et al., 2007). Moreover, POMC has critical functions in peripheral organs, including the pituitary and melanocytes of the skin, where it is essential for the production of ACTH and α-MSH-mediated hair follicle pigmentation, respectively (Bornstein and Chrousos, 1999; Rees, 2003). In contrast to POMC, AgRP can be modulated by, but does not depend on posttranslational modifications to exert its orexigenic effects, i.e. stimulation of feeding and inhibition of energy expenditure (Creemers et al., 2006). Whereas AgRP expression in the CNS is restricted to the ARH, the co-expressed orexigenic NPY is one of the most abundant neuropeptides and widely expressed throughout the brain (Allen et al., 1983; Broberger et al., 1998; Minth et al., 1984; Sahu et al., 1988).

Consistently, NPY is not only involved in the regulation of energy homeostasis, but has also been implicated in the control of blood pressure and circadian rhythm in an AgRP- independent manner (Balasubramaniam, 1997).

POMC and AgRP/NPY neurons form the basis of the so-called “central

melanocortin system”, which is considered as one of the main neuronal circuits involved in

the regulation of energy balance. Downstream neurons of the melanocortin system are

defined by their expression of melanocortin receptors, a family of G-protein-coupled

receptors (for review, see (Yang, 2011)). Although a total of five isoforms of the

melanocortin receptors (MC1-5R) exist, only MC3Rs and MC4Rs are expressed in the brain,

of which the MC4R seems to be the main isoform for the central melanocortin circuitry

involved in the regulation of energy homeostasis (Cone, 2006; Yang, 2011). Second-order

(24)

neurons expressing the MC4Rs reside predominantly in the PVH, but can also be found in various other regions throughout the CNS (see Chapter 1.2.2.2 for further detail) (Balthasar et al., 2005; Warne and Xu, 2013). Upon feeding, binding of α-MSH to the MC4R stimulates neuronal activity, presumably by increasing intracellular cAMP levels in anorexigenic neurons in the PVH (Lee et al., 2001). However, in the fasted state, AgRP acts as an inverse agonist of the MC4Rs and prevents the anorectic effects mediated by α-MSH (Ollmann et al., 1997). In contrast to α-MSH and AgRP, NPY does not bind to MC4Rs, but inhibits the activity of MC4R-expressing neurons in the PVH by binding to NPYRs, a family of G

i/o

-protein-coupled receptors, resulting in decreased cAMP levels (Gerald et al., 1996). Moreover, AgRP/NPY neurons further mediate their orexigenic effects by synaptic release of the inhibitory neurotransmitter gamma-aminobutyric acid (GABA) directly onto neighboring POMC, as well as to other neurons throughout the CNS (see Chapter 1.2.2.2 for further detail) (Cowley et al., 2001; Horvath et al., 1997).

The importance of a functional central melanocortin system for maintaining energy homeostasis is supported by the fact that loss or mutations of POMC, MC3R, MC4R or ectopic expression of the MC3/4R antagonist Agouti in agouti viable yellow mutant mice (A

vy

) result in hyperphagia, obesity, hyperinsulinemia and hyperglycemia, both in rodents and in humans (Chen et al., 2000; Huszar et al., 1997; Lu et al., 1994; Smart et al., 2007;

Yaswen et al., 1999). Additionally, acute intracerebroventricular (ICV) injection of α-MSH

decreases, whereas ICV injections of AgRP and NPY stimulate food intake (Clark et al.,

1984; Millington et al., 2001; Rossi et al., 1998). However, genetic deletion of Agrp and/or

Npy does not lead to any metabolic impairment and ablation of AgRP neurons early during

neonatal development has only mild effects on body weight and feeding behavior,

questioning the relative contributions of these orexigenic neurotransmitters in the regulation

of energy homeostasis (Erickson et al., 1996; Luquet et al., 2005; Marsh et al., 1998; Qian

et al., 2002). Nevertheless, acute ablation of AgRP neurons in adult mice induces extreme

anorexia, eventually leading to starvation (Gropp et al., 2005; Luquet et al., 2005). These

findings suggest that the central orexigenic feeding circuits remain highly plastic during

development and that early loss of AgRP/NPY signaling can be compensated for by alternate

signaling pathways to ensure survival of the organism. Importantly, specific restoration of

GABA-signaling in one of the main extra-hypothalamic AgRP target sites, the parabrachial

nucleus (PBN) of the brainstem, rescues the starvation phenotype in adult AgRP-ablated

(25)

mice (Wu et al., 2009). Thus, AgRP/NPY neurons of the ARH play a pivotal role in regulating energy homeostasis not only via modulation of MC4R-expressing neurons, but also via GABA-ergic signaling throughout the CNS (for review, see (Wu et al., 2009)).

Taken together, central regulation of energy and glucose homeostasis depends upon a functional melanocortin circuitry, as well as melanocortin-independent ARH neuronal signaling to efficiently coordinate feeding behavior.

1.2.2.2 Intra-and extra-hypothalamic ARH neuronal circuits

To mediate central regulation of energy and glucose homeostasis, the ARH POMC and AgRP/NPY neurons project to various sites within the hypothalamus, such as the PVH, DMH and LH. In the PVH, α -MSH and AgRP directly act (among other neuronal populations) on anorexigenic MC4R-expressing neurons defined by their expression of either thyrotropin-releasing hormone (TRH) or corticotropin-releasing hormone (CRH), which regulate hormonal release from the pituitary. In contrast, the neuronal identity of ARH downstream neurons of the DMH and LH are not fully elucidated, yet. However, it has been suggested that POMC and AgRP/NPY neurons modulate the activity of MC4R- expressing GABA-ergic neurons in the DMH. Under conditions with increased energy demand or energy intake (e.g. during lactation or obesity), distinct neurons in the DMH express NPY, which are a direct target of MC4R-expressing GABA-ergig neurons of the DMH (Chen et al., 2004). These DMH NPY neurons in turn modulate the activity of anorexigenic PVH neurons, providing an additional, but indirect ARH neuronal circuit regulating feeding behavior. Similarly, MC4R-expressing neurons in the LH have been demonstrated to be GABA-ergic and to synapse onto the orexigenic orexin-expressing neurons implicated not only in the homeostatic, but also the hedonic modulation of food intake (Cui et al., 2012). In line with these findings, long-term blockage of MC4R-signaling by adeno-associated virus (AAV)-mediated expression of the MC4R antagonist Agouti in these distinct hypothalamic ARH neuronal target sites all resulted in robust, but differential effects on obesity development (Kas et al., 2004). Whereas Agouti expression in the PVH led to rapid hyperphagia and weight gain, Agouti expression in the DMH was associated with a delayed onset of increased food intake and body weight starting after approximately 6 weeks.

Moreover, LH-specific inhibition of MC4R-signaling had no effect on feeding behavior

(26)

under normal condition, but augmented diet-induced obesity. Together, these findings demonstrate the complexity of ARH neuronal mediated regulation of energy homeostasis with distinct roles of MC4R-dependent POMC and AgRP neuronal signaling in different intra-hypothalamic nuclei that differentially impact on obesity development.

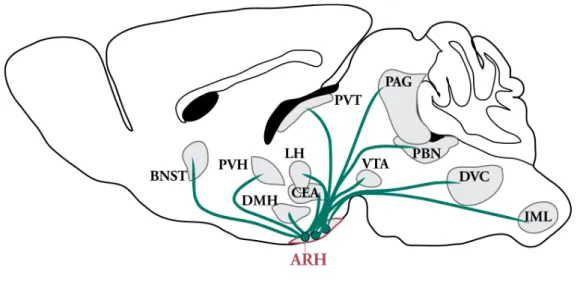
In addition to MC4R-dependent effects of POMC and AgRP neurons on energy balance via intra-hypothalamic target sites, these ARH neurons further modulate energy and glucose homeostasis by acting on brain regions implicated in the regulation of i) the autonomic nervous system, such as the dorsal vagal complex (DVC) in the brainstem and the intermediolateral nucleus (IML) in the spinal cord, ii) the reward circuitry, such as the amygdala, ventral tegmental area (VTA), nucleus accumbens and the bed nucleus of the stria terminalis (BNST) and iii) analgesia, such as the PBN, the periaqueductal grey (PAG) and dorsal raphe nucleus (Figure 1.3) (Betley et al., 2013; King and Hentges, 2011; O'Donohue et al., 1979). Of note, although there is a great convergence between the innervation pattern of POMC and AgRP/NPY axons throughout the CNS, not all target areas are innervated by both ARH neuronal populations to the same extent.

Given the distinct functions of the aforementioned regions, they also diverge in their relative contribution in the POMC and AgRP/NPY-mediated regulation of energy balance.

For example, while PVH- and amygdala-specific re-expression of the MC4R in an MC4R-

deficient background prevented approximately 60 % of obesity development due to

complete restoration of food intake to wildtype levels, these mice still displayed a decrease in

energy expenditure. In contrast, re-expression of the MC4R exclusively in the DVC and

IML restored energy expenditure and glucose homeostasis without affecting food intake

(Balthasar et al., 2005; Sohn et al., 2013). Thus, dissection of neuronal circuits emerging

from the very well defined POMC and AgRP/NPY neurons of the ARH throughout the

CNS revealed distinct cell-type and region-specific divergence in the relative contribution to

regulate different aspects of energy and glucose homeostasis.

(27)

Figure 1.3: Schematic overview of ARH neuronal projections throughout the CNS POMC and AgRP/NPY neurons residing in the ARH project to various intra-hypothalamic (i.e.

PVH, DMH, LH) nuclei, as well as to extra-hypothalamic target sites involved in the regulation of energy and glucose homeostasis, the control of the autonomic nervous system, the mesolimbic dopaminergic neurocircuitry and analgesia. POMC, proopiomelanocortin; AgRP, agouti-related peptide; NPY, neuropeptide Y; ARH, arcuate nucleus of the hypothalamus; BNST, bed nucleus of the stria terminalis; CEA, central nucleus of the amygdala; DMH, dorsomedial nucleus of the hypothalamus; DVC, dorsal vagal complex; IML, intermediolateral column; LH, lateral hypothalamic area; PAG, periaqueductal grey; PBN, parabrachial nucleus; PVH, paraventricular nucleus of the hypothalamus; PVT, paraventricular thalamic nucleus; VTA, ventral tegmental area.

1.2.3 Hormonal signals regulating the melanocortin circuitry

ARH-residing POMC and AgRP/NPY neurons act on their designated downstream neurons in response to hormonal and nutritional changes in the periphery. Here, the pancreas- derived hormone insulin and the adipocyte-derived hormone leptin have been shown to be critically involved in conveying information about the current energy status and overall energy stores into centrally mediated adaptation of feeding behavior and metabolism (for review, see (Belgardt and Bruning, 2010)).

1.2.3.1 Insulin signaling

Insulin is secreted postprandially in response to elevated blood glucose levels from pancreatic

β-cells. After meal-ingestion, glucose is imported into β-cells via glucose transporter (GLUT)

2. Subsequent metabolism of glucose via glycolysis and the citric-acid cycle rapidly increases

intracellular adenosine triphosphate (ATP) levels, which in turn leads to closure of ATP-

(28)

sensitive potassium (K

ATP

) channels and thus depolarization of the cell membrane. This depolarization opens voltage-gated Calcium (Ca

2+

) channels, thereby facilitating diffusion of Ca

2+

into the cell, which triggers additional Ca

2+

release from the endoplasmatic reticulum (ER) and finally insulin secretion into the blood stream (for review, see (Komatsu et al., 2013)).

Upon its secretion from pancreatic β-cells, insulin regulates various aspects of carbohydrate and lipid metabolism, e.g. insulin facilitates glucose uptake in muscle and adipose tissue, stimulates lipid and glycogen synthesis and suppresses hepatic glucose production (HGP), as well as lipolysis (Bluher et al., 2002; Bruning et al., 1998; Claycombe et al., 1998; Cross et al., 1995; Kershaw et al., 2006; Puigserver et al., 2003). Although these functions used to be primarily attributed to direct systemic effects of insulin, the CNS has emerged as a critical target site for insulin-mediated regulation of energy and glucose homeostasis, as well as reproduction (see chapter 1.2.3.3 for further detail). Insulin receptors (IR) are widely distributed throughout the CNS with marked regional variation in receptor density, showing the highest levels of expression in the hypothalamus, as well as in the olfactory bulb, cerebral cortex, cerebellum, hippocampus, thalamus and midbrain (Havrankova et al., 1978; van Houten et al., 1979). Insulin passes through the blood-brain barrier via a saturable, receptor-mediated process that yields insulin levels in the CNS proportional to plasma insulin (Baura et al., 1993). Identical to insulin signaling in the periphery, binding of insulin to its receptors in the CNS leads to rapid autophosphorylation of the IR and thereby to further activation of its intrinsic kinase activity, resulting in tyrosine-phosphorylation of insulin receptor substrate (IRS) proteins (for review, see (Biddinger and Kahn, 2006). Unlike in the periphery, where IRS-1 is essential for signal- transduction, IRS-2 is the main mediator of insulin’s intracellular responses in the brain (Araki et al., 1994). Phosphorylated IRS-2 serves as a docking platform for proteins harboring a Src-homology (SH) domain, e.g. the p85 regulatory subunit of the phosphatidylinositide-3 kinase (PI3K). Subsequent phosphorylation of the membrane- bound phosphatidyl-inositol-4,5-bisphosphate (PIP2) to phosphatidyl-inositol-3,4,5- trisphosphate (PIP3) by the p110 catalytic subunit of PI3K results in a context-specific activation of several downstream molecules (for review, see (Cheatham and Kahn, 1995)).

On the one hand, PIP3 activates K

ATP

channels, leading to potassium outflow and thus,

hyperpolarization and silencing of neurons (MacGregor et al., 2002; Plum et al., 2006). On

(29)

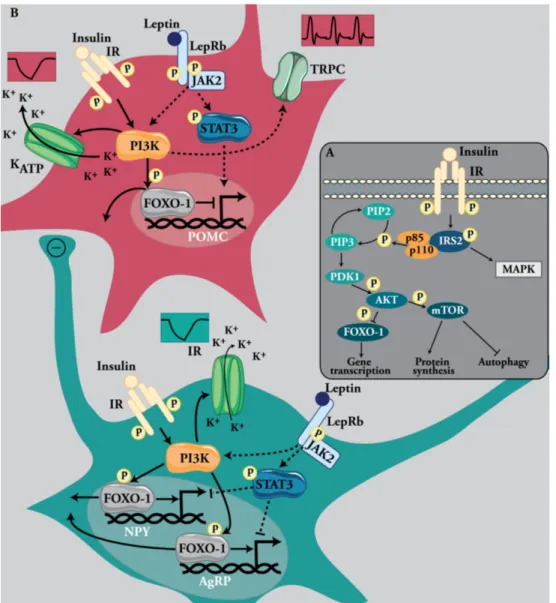
the other hand, PIP3 activates phosphoinositide-dependent kinase 1 (PDK1), which in turn phosphorylates and thus activates the kinase AKT to elicit downstream signaling events (for review, see (Vanhaesebroeck and Alessi, 2000)). Among other targets, AKT phosphorylates forkhead box-1 (FOXO-1), which results in nuclear-exclusion and thus inhibition of FOXO-1-mediated activation and/or repression of target genes (for review, see (Biddinger and Kahn, 2006)). Moreover, AKT phosphorylates the mammalian target of rapamycin (mTOR), a critical regulator of protein synthesis and inhibitor of autophagy (Figure 1.4B) (for review, see (Wullschleger et al., 2006)). Similar to insulin’s action in peripheral target tissues, insulin signaling in the brain mediates its variety of effects not only via PI3K, but also via the mitogen-activated protein (MAPK) signaling pathways (Figure 1.4 A). However, the role of IR-mediated activation of the MAPK-signaling in the regulation of energy homeostasis is less well defined so far.

1.2.3.2 Leptin signaling

In addition to insulin, central leptin action is critically involved in the regulation of energy and glucose homeostasis. As early as the 1950s, Gordon C. Kennedy postulated the lipostatic theory suggesting that a humoral signal produced by adipose tissue in direct proportion to fat mass could act on the hypothalamus to decrease food intake and increase energy expenditure (Kennedy, 1953). The brain would thereby monitor fat levels and maintain them at certain fix points. With the discovery of leptin in 1994, a hormone that is secreted in direct proportion to fat mass and acts in the brain to modulate energy and glucose metabolism, this humoral factor was identified and proved Kennedy’s theory correct in many aspects (Zhang et al., 1994).

Leptin signals via the long form of its receptor (LepRb) to induce multiple intracellular signaling cascades, one of them being the JAK/STAT pathway. Upon leptin binding, the Janus kinase 2 (JAK2) is recruited to the receptor, where it autophosphorylates itself, as well as multiple tyrosine residues of the LepRb, which serve as binding sites for signal transducer and activator of transcription 3 (STAT3) proteins (Banks et al., 2000;

Tartaglia, 1997). Subsequent JAK2-mediated phosphorylation of STAT3 leads to STAT3

homodimerization, the exposure of its nuclear-localization domain and consequently to

nuclear localization. In the nucleus, STAT3 serves as a transcription factor at various

(30)

promoter sites to regulate gene expression, e.g. upregulation of its own negative regulator suppressor of cytokine signaling 3 (SOCS3) (Bjorbaek et al., 1998). In addition to activating the JAK/STAT signaling cascade, leptin has also been described to signal via the PI3K pathway (Mirshamsi et al., 2004). Thus, the PI3K pathway resembles a point of convergence between insulin and leptin signaling. While studies have shown independent, as well as synergistic effects of insulin and leptin signaling in the regulation of energy and glucose homeostasis, we are only starting to understand the relative contribution of these hormones in adapting cellular and molecular processes in the CNS, to ultimately meet the immediate demands of the body.

1.2.3.3 Insulin and leptin action on ARH neurons

The notion that insulin acts in the brain to modulate feeding behavior has been demonstrated across species, as centrally administered insulin (either via ICV injection or intranasal application) decreases food intake, which is associated with loss of body weight in rodents, non-human primates and humans (Benedict et al., 2008; Woods et al., 1979;

Zhang et al., 2008). Identical effects have been shown for central leptin injections, at least in rodents (Calapai et al., 1998; Schulz et al., 2012). Consistently, genetic deletion of the IR in the brain results in mild obesity, insulin resistance and infertility (Bruning et al., 2000); and neuron-specific LepRb ablation induces obesity and impaired neuroendocrine functions essential for energy and glucose homeostasis in mice (Cohen et al., 2001).

To decipher the relative contribution of insulin and leptin action on ARH neurons

in mediating these effects, studies have genetically ablated the IR and LepRb from these

distinct neuronal populations. Surprisingly, specific deletion of the IR in either of these

neuronal subtypes did not affect feeding behavior, or energy expenditure (Konner et al.,

2007). However, insulin-mediated suppression of HGP was blunted in mice lacking the IR

specifically on AgRP neurons, demonstrating the role of central insulin in the regulation of

glucose metabolism (Konner et al., 2007). In addition, specific reconstitution of the IR in

AgRP neurons of L1 mice (mice that exclusively express the IR in liver, pancreatic cells and

several regions in the brain, but which exhibit a 90 % reduction of IR expression in the

ARH) further supported this finding. Here, HGP levels of L1 mice were restored to normal

levels upon AgRP-specific reconstitution of the IR (Lin et al., 2010). By contrast, POMC-

(31)

specific IR deletion had no effect on HGP (Konner et al., 2007). However, reconstitution of the IR in POMC neurons of L1 mice further exacerbated their hepatic insulin resistance, while at the same time restoring locomotor activity, suggesting a role for insulin signaling in POMC neurons in the regulation of energy expenditure (Lin et al., 2010). Similarly, LepRb deficiency in POMC or AgRP/NPY neurons had only mild effects on body weight gain and adiposity, which was slightly augmented upon LepRb ablation from both neuronal populations at the same time (van de Wall et al., 2008).

Nonetheless, insulin and leptin have been shown to act via POMC and AgRP/NPY neurons to mediate central regulation of energy balance. On a molecular level, insulin and leptin are able to regulate Pomc, Agrp and Npy gene transcription. Whereas insulin increases POMC mRNA expression in a PI3K-dependent manner, upregulation of POMC mRNA expression via leptin depends on phosphorylation of STAT3 (pSTAT3) (Belgardt et al., 2008; Xu et al., 2007). In contrast, both insulin and leptin decrease NPY and AgRP expression in a PI3K-dependent manner. Crucial for both of these effects is FOXO-1, which acts as a transcriptional repressor of Pomc by recruiting histone deacetylases, and as a transcriptional activator of Agrp and Npy, respectively (Kim et al., 2006; Kitamura et al., 2006). Thus, in POMC neurons, PI3K-mediated phosphorylation and subsequent nuclear exclusion of FOXO-1 allows pSTAT3 to bind and induce Pomc transcription, whereas in AgRP/NPY neurons, PI3K-mediated phosphorylation of FOXO-1 indirectly inhibits Agrp and Npy expression, as subsequent nuclear exclusion allows for pSTAT3 to act as a transcriptional repressor of these orexigenic neuropeptides (Figure 1.4 B) (Fukuda et al., 2008; Morrison et al., 2005).

Moreover, insulin and leptin directly modulate the activity of both POMC and

AgRP/NPY neurons. Central leptin administration depolarizes and thus increases POMC

neuronal activity in a PI3K-dependent manner (presumably via transient receptor potential

cation (TRPC) channels and, at the same time, hyperpolarizes and thus inhibits AgRP/NPY

neurons by modulating K

ATP

channel activity (Mirshamsi et al., 2004; Qiu et al., 2010; van

den Top et al., 2004). Collectively, these changes in neuronal activity lead to an increased α-

MSH and decreased NPY synaptic release, thereby mediating anorexigenic behavior. Insulin

on the other hand leads to a PI3K-dependent activation of K

ATP

channels and thus

hyperpolarization of both POMC and AgRP/NPY neurons (Figure 1.4 B) (Konner et al.,

2007; Plum et al., 2006). To date, this seemingly paradoxical situation, where insulin exerts

(32)

the same effect on neuronal activity of two functionally opposing neurons is not yet resolved.

Moreover, the question arises how two “anorexigenic” hormones, i.e. insulin and leptin, which both require PI3K-mediated signaling cascades in POMC neurons to exert their functions, can result in opposite effects regarding the net outcome of POMC neuronal activity. Interestingly, insulin- and leptin-mediated changes in POMC neuronal activity occur in two distinct neuronal subpopulations (Williams et al., 2010). Furthermore, this segregation in POMC neuronal insulin and leptin responses show a neuroanatomical pattern, further supporting the existence of distinct POMC neuronal subpopulations. However, whether this selective responsiveness of POMC neurons to these differences in hormone sensitivity with regards to neuronal activity are due to 1) differential expression of their respective hormone receptors, 2) different ion channel distribution, 3) distinctive activation of specific signaling intermediates or 4) completely different mechanisms, remains to be elucidated.

In contrast, such heterogeneity in terms of hormone-mediated changes in neuronal activity has not been described for AgRP neurons so far. However, a recent paper from Betley and colleagues investigated the efficacy of distinct AgRP/NPY neurocircuits to stimulate feeding in response to channelrhodopsin 2 (ChR2)-mediated AgRP neuronal activation (Betley et al., 2013). Here, they could show that distinct AgRP/NPY neuronal subgroups located in distinct areas of the ARH innervate only one specific target area.

Moreover, neuronal activation of AgRP/NPY circuits only from ARH->PVH, ARH->LH and ARH->BNST were sufficient to induce rapid feeding, whereas optogenetic activation of AgRP/NPY circuits from ARH->PBN, ARH->CEA and ARH->PAG were not associated with changes in feeding behavior. Thus, similar to the specialization of POMC neurons in terms of hormone-responsiveness, AgRP/NPY neurons can be divided into subgroups depending on their relative topographic distribution and their specific downstream target area of innervation, as well as their relative contribution to regulate feeding behavior. The findings that discrete subgroups of defined neuronal populations of the ARH segregate not only in their sensitivity towards hormonal and nutritional changes, but also in their innervation pattern, as well as their relative contribution to mediate different aspects of metabolism, highlight the complexity of hypothalamic regulated energy and glucose balance.

To further complicate matters, one hallmark of obesity is the development of insulin

and leptin resistance not only in peripheral organs, such as liver, muscle and fat, but also in

(33)

the CNS. Thus, although insulin and leptin might be secreted in obese patients in response

to glucose excursions and elevated fat mass, respectively, IR and LepRb-expressing target

cells are incapable of converting these signals into adaptive behavioral and systemic

metabolic changes. Thus, a better understanding of how cell-type specific central insulin and

leptin signaling contribute to the regulation of energy and glucose homeostasis, in

combination with a clearer picture of the mechanisms underlying hormonal resistance at the

level of the CNS, is of utmost importance to develop effective therapeutics and preventative

strategies in the fight against obesity.

(34)

Figure 1.4: Insulin and leptin signaling in POMC and AgRP/NPY neurons

A) Binding of insulin to the insulin receptor (IR) results in a conformational change, activation of the membrane bound receptor tyrosine kinase and autophosphorylation of the IR. IRS2 is phosphorylated, binds to the p85-regulatory subunit of PI3K, leading to phosphorylation of PIP2 to PIP3 by the p110-catalytic domain of PI3K. PIP3 activates PDK1, which phosphorylates AKT,which activates several downstream signaling events, e.g. phosphorylation and nuclear exclusion of FOXO-1 and phosphorylation of mTOR. B) Insulin-mediated phosphorylation of FOXO-1 allows leptin-mediated phosphorylated STAT3 to bind to the promoter of the Pomc, as well as Agrp and Npy gene, resulting in their upregulation and downregulation, respectively. Moreover, insulin activates K

ATP

channels in POMC (red) and AgRP (green) neurons, resulting in their hyperpolarization, whereas leptin depolarizes POMC in a TRPC-dependent and hyperpolarizes AgRP neurons in a JAK2/PI3K-depenendent manner. PI3K, phosphatidylinositol 3 kinase; IRS2, insulin receptor substrate 2; PIP2, phosphatidylinositol (4,5) bisphosphate; PIP3, phosphatidylinositol (3,4,5) trisphosphate; PDK1, protein-dependent kinase 1; AKT, protein kinase B; mTOR, mammalian target of rapamycin; FOXO-1, forkhead box 1; JAK2, janus kinase 2;

STAT3, signal transducer and activator of transcription 3; KATP, ATP-dependent potassium

channel; TRPC, transient receptor potential cation channel; POMC, proopiomelanocortin; AgRP,

agouti-related peptide; NPY, neuropeptide Y; P, phosphorylation; dashed lines indicate leptin-

mediated signaling.

(35)

1.3 The hypothalamus as a primary target site for metabolic programming

Given its crucial role in the regulation of energy and glucose homeostasis, the hypothalamus has been in the focus as one of the main target sites for metabolic programming in offspring of obese, diabetic, hyperglycemic or malnourished mothers. Moreover, both mother and child are highly sensitive towards nutritional and/or hormonal changes during pregnancy and development, respectively. Thus, alterations in the nutritional environment in response to impaired maternal health or quality of food during pregnancy have been demonstrated to have a direct impact on hypothalamic neurocircuit development, which is associated with a lifelong predisposition for metabolic disorders in the offspring.

1.3.1 Development of hypothalamic neurocircuits

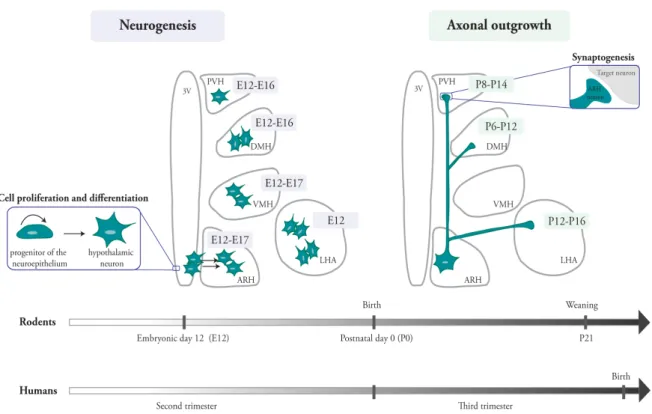
Hypothalamic neurocircuit development follows a specific pattern of events that can be roughly divided into two major phases: 1) Determination of neuronal cell number, which involves neurogenesis, neuronal death, neuronal differentiation and migration and 2) Formation of functional circuits, which includes axonal outgrowth and synaptogenesis (for review, see (Bouret, 2012)). Whereas the sequence of events is thought to be identical between rodents and humans, the relative timing is highly distinct between these species:

Unlike in humans, where both of these phases occur in utero, axon formation and synaptogenesis of hypothalamic neurocircuits occur during the first three weeks after birth in rodents (Figure 1.5) (Grove et al., 2005; Koutcherov et al., 2002) .

Hypothalamic neurons are generated predominantly in the neuroepithelium of the

third ventricle. Extensive thymidine labeling and BrdU incorporation studies in the rodent

could further pinpoint the period(s) of neurogenesis of distinct hypothalamic nuclei, which

occurs in a rostral to caudal and lateral to medial pattern (thus, cells that have to migrate the

farthest, are born the earliest) (Shimada and Nakamura, 1973). The peak of hypothalamic

neurogenesis is considered to be E12, at which most LH neurons are born. Moreover,

neurogenesis of PVH and DMH neurons extends from E12-E16 and that of ARH and

VMH neurons from E12 to E17 (Ishii and Bouret, 2012; Padilla et al., 2010). Similarly, in

non-human primates neurogenesis of distinct neuronal subgroups occurs in specific time

Abbildung

Figure 1.1: Schematic illustration of the global obesity and diabetes epidemic   Over  the  last  decades,  the  prevalence  of  obesity  has  dramatically  increased,  affecting  approximately  20 % of the adult population in Central Europe and 30 % in th
Figure 1.2: Schematic overview of the hypothalamus in the brain
Figure 1.3: Schematic overview of ARH neuronal projections throughout the CNS   POMC  and  AgRP/NPY  neurons  residing  in  the  ARH  project  to  various  intra-hypothalamic  (i.e
Figure 1.4: Insulin and leptin signaling in POMC and AgRP/NPY neurons
+7

Referenzen

ÄHNLICHE DOKUMENTE

Constant hires - the condititon for a stable Beveridge curve - together with the common assumption of a fixed labor force (which allows for mobility between employment and

The intake of the fermented milk resulted in specific serum metabolomics profiles and was characterised by the modulation of metabolites of exogenous or endogenous origin, such as

fumigatus grown under normoxic or hypoxic conditions revealed an increased abundance of enzymes involved in the biosynthesis of secondary metabolites (Table 1 and Figure 1),

For instance, ethosux- imide is only effective in the GAERS model and almost exclusively used for the treatment of absence seizures in humans; phenytoin and carbamazepine act

Table 1 | Summary of typical examples of analysis methods and corresponding results produced with different modeling formalisms grouped in data types, which will be assigned

Welsh Water (Dŵr Cymru), Severn Trent Water, South West Water, Yorkshire Water and Anglian Water utilised paid social media promotion or geo-targeted posting to ensure they

The structure of brivaracetam was shown incorrectly (a hydroxyl group was shown instead of a keto group)2. In addition, the order of brivaracetam and levetiracetam was

The aim of my suggested approach (Möhner 2015) was to develop a method, which can even be applied to pub- lished results from cohort studies like the US coal miner mortality