Essays on the Determinants of Corporate Bond Yield Spreads
Inauguraldissertation zur
Erlangung des Doktorgrades der
Wirtschafts- und Sozialwissenschaftlichen Fakultät der
Universität zu Köln
2016
vorgelegt von
Diplom-Wirtschaftsmathematiker Sebastian Bethke aus
Bergisch Gladbach
Referent: Univ.-Prof. Dr. Alexander Kempf, Universität zu Köln
Korreferent: Univ.-Prof. Dr. Thomas Hartmann-Wendels, Universität zu Köln Vorsitz: Univ.-Prof. Dr. Dieter Hess, Universität zu Köln
Tag der Promotion: 30. November 2016
This thesis consists of the following works:
Bethke, Sebastian, Monika Gehde-Trapp, and Alexander Kempf, 2015. Investor Sentiment, Flight-to-Quality, and Corporate Bond Comovement. Working Paper.
Bethke, Sebastian, and Monika Gehde-Trapp, 2016. Forecasting Credit Default Swap Premiums with Google Search Volume. Working Paper.
Bethke, Sebastian, 2016. Commonality in Liquidity in the US Corporate Bond Market.
Working Paper.
Acknowledgements
The completion of this thesis would not have been possible without the support and encouragement from many people, whom I would like to thank.
First of all, I would like to express my gratitude to Prof. Dr. Alexander Kempf for taking the responsibility to supervise my thesis as well as for giving me the opportunity to pursue research in my favorite research topics. His steady encouragement and continuous support decisively helped me to write this thesis. I am especially grateful for his critical advice that improved my research and colored my way of thinking. Furthermore, I would like to thank Prof. Dr. Thomas Hartmann-Wendels for serving as co-referee and Prof. Dr. Dieter Hess for chairing the dissertation committee.
Moreover, I am indebted to my co-author Prof. Dr. Monika Gehde-Trapp for numerous inspiring and fruitful discussions. Particularly, I am grateful for her enthusiasm and ongoing encouragement that pushed my research forward.
Many thanks also go to my former colleagues at the Department of Finance: Laura Dahm, Marc Göricke, Marc Hennes, Dr. Alexander Pütz, Dr. Christoph Sorhage, and Julius Watermann. My special thanks go to Stefan Jaspersen and Dr. Florian Sonnenburg for their critiques, suggestions, and for always taking their time to discuss my latest findings.
Finally, I thank my friends for relaxing leisure activities and I am deeply grateful to my family who paved the way for this thesis. Especially, I would like to thank my parents and sister who always believed in me. Most of all, I wish to thank my wife Jennifer for her love, patience, and comfort. Seeing her and our son Vincent smile always dispelled my worries and doubts.
Cologne, January 2017 Sebastian Bethke
Contents
List of Tables viii
List of Figures x
1.
Introduction 1
2.
Investor Sentiment, Flight-to-Quality, and Corporate Bond Comovement 9
2.1. Introduction... 9
2.2. Bond correlation over time ... 12
2.2.1. Bond sample ... 12
2.2.2. Bond correlation ... 14
2.3. Explaining bond and risk factor correlation ... 16
2.3.1. Risk factor correlation and investor sentiment ... 16
2.3.2. Bond correlation and risk factor correlation ... 19
2.4. Hypotheses tests... 20
2.4.1. Measuring investor sentiment and risk factor correlation ... 20
2.4.2. The link between sentiment and risk factor correlation ... 22
2.4.3. The link between risk factor correlation and bond correlation ... 24
2.5. Robustness ... 27
2.5.1. Alternative credit risk and liquidity premium ... 27
2.5.2. Correlations adjusted for interest rate risk and unexpected inflation ... 29
2.5.3. Alternative proxies for investor sentiment ... 31
2.5.4. Alternative proxy for the risk-free rate ... 33
2.5.5. Stability over time ... 34
2.6. Conclusion ... 35
Contents vi
2.A. Model relating investor sentiment to bond correlation ... 36
2.A.1. Model setup ... 36
2.A.2. Impact of investor sentiment on risk factor correlation ... 40
2.A.3. Bond correlation and risk factor correlation ... 46
3.
Forecasting Credit Default Swap Premiums with Google Search Volume 52
2.1. Introduction... 52
3.2. Data and Google index construction ... 57
3.2.1. CDS sample ... 57
3.2.2. ALL-SVI and FIN-SVI Google index construction ... 59
3.3. In-sample predictive power of Google indices ... 65
3.4. Out-of-sample predictive power of Google indices ... 67
3.4.1. One-day ahead out-of-sample forecasts ... 67
3.4.2. Out-of-sample forecasts for different periods ... 70
3.4.3. Out-of sample forecasts for different forecasts horizons ... 74
3.5. Robustness ... 76
3.5.1. Granger causality ... 76
3.5.2. ALL-SVI and FIN-SVI Google index vs. FEARS index ... 78
3.5.3. Modifications of the Google index construction... 83
3.6. Conclusion ... 84
3.A. Google Trends data processing ... 85
4.
Commonality in Liquidity in the US Corporate Bond Market 86
2.1. Introduction... 86
4.2. Bond sample and liquidity measures ... 90
4.3. Commonality in liquidity and cross-sectional determinants ... 93
4.3.1. Existence of commonality in liquidity ... 93
4.3.2. Cross-sectional determinants of commonality in liquidity ... 97
4.3.2.1. Commonality in liquidity by credit rating bucket ... 98
4.3.2.2. Commonality in liquidity by time to maturity ... 100
4.3.2.3. Commonality in liquidity by amount outstanding ... 102
4.3.2.4. Commonality in liquidity by industry ... 104
4.3.2.5. Panel analysis of determinants of commonality in liquidity ... 105
4.3.3. Alternative sources of individual bonds’ comovement in liquidity ... 111
Contents vii
4.4. Commonality in liquidity over time ... 115
4.4.1. Time-series evolution of commonality in liquidity... 115
4.4.2. Time-series determinants of commonality in liquidity ... 118
4.5. Robustness ... 123
4.5.1. Cross-sectional robustness analyses ... 123
4.5.2. Time-series robustness analyses ... 125
4.6. Conclusion ... 127
4.A. Description of liquidity measures ... 128
5.
Bibliography 130
List of Tables
Table 2.1: Summary statistics of the TRACE sample ... 13
Table 2.2: Summary statistics of bond correlations ... 16
Table 2.3: Summary statistics of risk factor correlations ... 21
Table 2.4: Risk factor correlation and investor sentiment ... 23
Table 2.5: Bond correlation and risk factor correlation ... 26
Table 2.6: Alternative credit risk and liquidity premium ... 28
Table 2.7: Correlations adjusted for interest rate risk and unexpected inflation ... 30
Table 2.8: Alternative proxies for investor sentiment ... 32
Table 2.9: Swap rate as proxy for the risk-free rate ... 33
Table 2.10: Temporal stability ... 34
Table 3.1: Summary statistics of sample variables ... 59
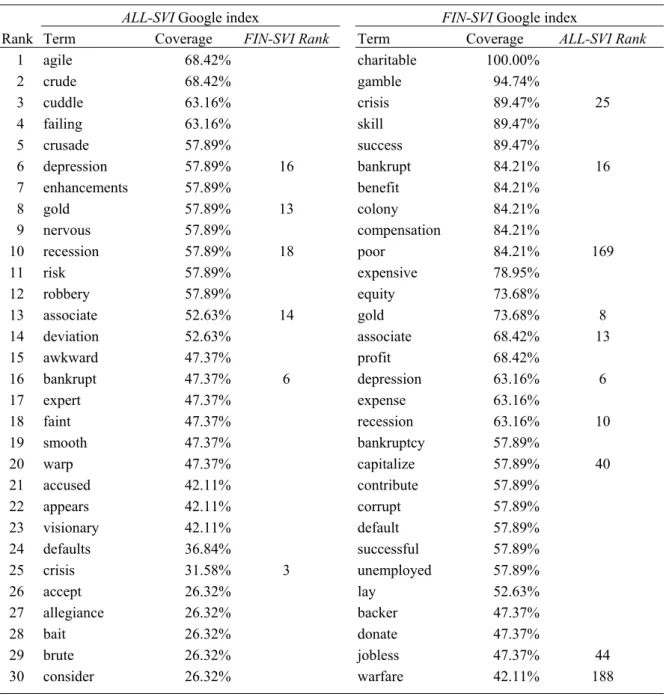
Table 3.2: Google index constituents ... 61
Table 3.3: Contemporaneous impact of Google indices on CDS premium changes ... 63
Table 3.4: In-sample predictive power of Google indices for CDS premium changes ... 66
Table 3.5: Out-of-sample predictive power of Google indices for CDS premium changes .. 69
Table 3.6: Out-of-sample predictive power of Google indices for different periods ... 71
Table 3.7: Out-of-sample predictive power for different forecasting horizons ... 75
Table 3.8: ALL-SVI Google index and CDS premium changes: Granger causality test ... 77
Table 3.9: FIN-SVI Google index and CDS premium changes: Granger causality test ... 78
Table 3.10: ALL-SVI and FIN-SVI Google index vs. FEARS index ... 80
Table 3.11: In-sample predictive power of Google index modifications ... 83
Table 4.1: Summary statistics of the bond sample ... 92
Table 4.2: Commonality in liquidity among US corporate bonds ... 95
Table 4.3: Commonality in liquidity by credit rating bucket ... 99
List of Tables ix
Table 4.4: Commonality in liquidity by maturity group ... 101
Table 4.5: Commonality in liquidity by amount outstanding quintile ... 103
Table 4.6: Commonality in liquidity – financial vs. non-financial firms ... 105
Table 4.7: Cross-sectional determinants of commonality in liquidity ... 108
Table 4.8: Alternative sources of commonality in liquidity ... 113
Table 4.9: Time-series analyses of commonality in liquidity ... 120
Table 4.10: Financial stress and commonality in liquidity ... 122
Table 4.11: Cross-sectional robustness analyses of commonality in liquidity ... 124
Table 4.12: Time-series robustness analyses of commonality in liquidity ... 126
List of Figures
Figure 2.1: Bond correlation time series ... 15
Figure 2.2: Reduced-form credit risk and liquidity model ... 38
Figure 2.3: Risk factor correlation and sentiment ... 42
Figure 2.4: Bond correlation and risk factor correlation ... 47
Figure 3.1: Markit CDX Investment Grade Index time series ... 57
Figure 4.1: Commonality in liquidity over time... 116
Chapter 1
1. Introduction
This thesis consists of three essays on the determinants of corporate bond yield spreads.
Specifically, it focuses on (1) the impact of investor sentiment on the correlation between corporate bond yield spreads through the correlation between credit risk and liquidity, (2) the impact of consumer sentiment on issuers’ credit risk, and (3) the comovement of individual corporate bonds’ liquidity with market liquidity.
1Several studies document the rise in corporate bond yield spreads during times of financial stress (e.g., Driessen, 2005; Friewald et al., 2012; Dick-Nielsen et al., 2012; Chun et al., 2014). For instance, the collapse of Long-Term Capital Management in 1998, the downgrades of the General Motors Corporation and the Ford Motor Company to junk status in 2005, or the US subprime crisis in 2008 are examples of severe financial stress events that have highlighted the importance of credit risk, liquidity, and the influence of sentiment for the US corporate bond market. Corporate bonds’ simultaneously falling credit quality and liquidity lead to rising yield spreads, decreasing investors‘ portfolio values, and increasing issuers‘ financing costs. The overall impact likely has been reinforced through investors’ fear of even larger future losses leading to flight-to-quality behavior (e.g., Longstaff et al., 2005;
Dick-Nielsen et al., 2012). This raises several questions: What are the risk factors affecting corporate bond yield spreads? What are the determinants of credit risk and liquidity, and how
1 A corporate bond’s yield spread is defined as the difference between a bond’s yield and a benchmark risk-free rate. The yield spread compensates investors for bearing risks (e.g., Fisher, 1959; Collin-Dufresne et al. (2001);
Longstaff et al., 2005; Dick-Nielsen et al., 2012). As such, credit risk describes the risk that the issuer of a bond may default or its default probability changes (e.g., Fisher, 1959; Merton, 1974). Liquidity has several meanings. This thesis focuses on bonds’ trading liquidity. Bonds are liquid, if they can be traded quickly and in large quantities without significant deviations from their fundamental value (e.g., Fisher, 1959; Amihud and Mendelson, 1986).
1. Introduction 2 do both affect corporate bond yield spreads? Does investor or consumer sentiment have an impact on corporate bond yield spreads? What determines diversification opportunities among corporate bonds? These questions are of vital interest for researchers, investors, issuers, and policy makers, especially when considering the growth in the outstanding amount of US corporate bonds. It steadily increased over the last two decades from 2 trillion USD in 1995 to 8 trillion USD in 2015 accounting, on average, to more than 30% of the US stock market capitalization.
2In providing answers to these questions, this thesis contributes to the literature analyzing the determinants of corporate bond yield spreads.
The academic literature on the determinants of corporate bond yield spreads can be broadly separated into three strands. The first strand of the literature analyzes the risk factors affecting corporate bond yield spreads. By corporate bonds’ nature of being debt capital, the issuers’ credit risk should be the main risk factor driving yield spreads (Merton, 1974).
However, the literature documents that credit risk models are not able to fully explain empirically observed yield spreads.
3More precisely, the literature shows that corporate bond yield spreads have both a credit risk as well as a non-credit risk component with a large fraction of the latter being often attributed to liquidity.
4More recent research documents that also the correlation between credit risk and liquidity influences corporate bond yield spreads.
5This underlines the importance of understanding the determinants of corporate bond credit risk and liquidity.
Hence, the second strand of the literature focuses on the analysis of issuers’ credit risk.
For this purpose, the literature analyzes the determinants of credit ratings and credit default swap
6(CDS) premiums.
7By definition, credit ratings measure issuers’ credit risk and CDS
2 See Securities Industry and Financial Markets Association (SIFMA) (2016) and World Bank (2016).
3 Examples of studies that document the existence of the so called “credit spread puzzle” are Collin-Dufresne et al. (2001), Elton et al. (2001), and Huang and Huang (2012).
4 Examples of studies that document liquidity to be an important risk factor influencing corporate bond yield spreads are Longstaff et al. (2005), Nashikkar et al. (2011), Dick-Nielsen et al. (2012), and Friewald et al.
(2012).
5 In this context, Longstaff et al. (2005) find a negative correlation between credit risk and liquidity premiums for corporate bonds while Ericsson and Renault (2006) motivate and document a positive correlation. Bühler and Trapp (2009), Dick-Nielsen et al. (2012), and Friewald et al. (2012) find risk factor correlation to be positive.For stocks, Rösch and Kaserer (2013) document a positive relation between credit risk and liquidity.
6 A credit default swap is a credit derivative designed as an insurance contract whose payoff is linked to the credit risk of an underlying reference bond or issuer.
7 The determinants of credit ratings are analyzed by, e.g., Pottier and Sommer (1999), Jorion et al. (2005); Güttler and Wahrenburg (2007), Cheng and Neamtiu (2009), Becker and Milbourn (2011), and Jiang et al. (2012) who, for instance, document differences between the credit ratings of different agencies and an impact of credit rating market competition on rating quality. Among others, Ericsson et al. (2009), Zhang et al. (2009), Cao et al.
(2010), Tang and Yan (2013), and Wang et al. (2013) analyze the determinants of CDS premiums and document that firm value information, either accounting-based or from the equity market, determines CDS premiums.
1. Introduction 3 premiums reflect the market price of issuers’ credit risk (e.g., Hull et al., 2004; Norden and Weber, 2004). The literature documents that both are linked while CDS premiums are the more efficient credit risk measure summarizing firm value and credit rating information.
8However, neither credit risk measured by CDS premiums, credit ratings, nor additional firm value information, can fully explain corporate bond yield spreads. This finally underlines the importance of the non-credit risk component in corporate bond yield spreads.
Thus, the third strand of the literature focuses on the analysis of corporate bonds’ non- credit risk component which has been mainly linked to liquidity. Given the over-the-counter (OTC) market structure of the corporate bond market, it is not possible to observe a limit order book as for centralized markets such as the New York Stock Exchange. Thus, measuring liquidity for corporate bonds is even more challenging. Therefore, on the one hand, this strand of the literature focuses on the measurement of corporate bond liquidity.
9On the other hand, it investigates the determinants of liquidity and its influence on corporate bond yield spreads.
10The essays in this thesis contribute to the previous three strands of the literature on the determinants of corporate bond yield spreads. The first essay (Bethke et al., 2015) adds to the strand of the literature on the risk factors affecting corporate bond yield spreads by identifying an economic mechanism of investor sentiment driving the correlation between yield spreads through the correlation between credit risk and liquidity. While the risk factors affecting corporate bond yield spreads are already extensively studied, the literature on the correlation between yield spreads is scarce.
11This is surprising as correlations are crucial when managing
8 In this context, e.g., Hull et al. (2004) and Norden and Weber (2004) provide evidence of the predictive power of CDS premiums for credit rating downgrades. Examples of studies showing that CDS lead corporate bonds are, e.g., Blanco et al. (2005), Forte and Peña (2009) , Norden and Weber (2009), and Coudert and Gex (2010).
9 An overview of existing studies with respect to the used liquidity proxies is given by Friewald et al. (2012).
Several studies exist that use bond characteristics as liquidity proxies, e.g., issuance volume, issuers’ industries, or trading activity variables such as trade volume or number of trades. Examples are, e.g., Collin-Dufresne et al. (2001), Houweling et al. (2005), Longstaff et al. (2005), and Friewald et al. (2012). In addition, several studies exist that develop liquidity proxies or apply liquidity proxies already used in studies for other asset classes. For instance, the Roll measure and the inter-quartile range are proxies for bid-ask spreads (e.g., Han and Zhou, 2007; Pu, 2009; Bao et al., 2011) while the Amihud measure proxies for the price impact of a trade (e.g., Dick-Nielsen et al., 2012; Friewald et al., 2012).
10 Studies that analyze corporate bond liquidity are, among others, Alexander et al. (2000), Schultz (2001), Longstaff et al. (2005), Chacko et al. (2005), Houweling et al. (2005), Bessembinder et al. (2006), Edwards et al. (2007), Chen et al. (2007), Bao et al. (2011), Dick-Nielsen et al. (2012), Friewald et al. (2012), Acharya et al. (2013), and Schestag et al. (2016). Overall, the studies show that liquidity influences corporate bond yield spreads and its magnitude varies over time and across bonds.
11 Examples of studies that analyze correlations for other asset classes are, e.g., Ang and Chen (2002), Connolly et al. (2007), and Christiansen and Ranaldo (2009) for stocks, Abad et al. (2010), Piljak (2013), and Abad et al. (2014) for sovereign bonds, and Connolly et al. (2005), Baele et al. (2010), Bansal et al. (2014), and Nieto and Rodriguez (2015) between asset classes.
1. Introduction 4 portfolios. Moreover, economic mechanisms known from the stock market are not easily transferable. This is because studies related to the stock market often document retail investors’ herding behavior to determine higher correlations in market downturns. However, this explanation is unlikely to apply for the corporate bond market due to a higher fraction of institutional investors who are less prone to herding behavior in market downturns (e.g., Kumar and Lee, 2006; Borensztein and Gelos, 2003). As a consequence, we develop a theoretical model that proposes an economic mechanism for bond correlations that takes two main effects of investor sentiment induced behavior into account. First, investors with low sentiment avoid risky assets (e.g., Baker and Wurgler, 2006; Ben-Rephael et al., 2012; Da et al., 2015). Second, investors react more to negative information than to positive information (e.g., Mian and Sankaraguruswamy, 2012; Kaplanski and Levy, forthcoming). Thus, low sentiment makes investors less willing to invest in bonds with high credit risk and these bonds are less liquid than when sentiment is good due to investors’ stronger reactions. As a result of these two effects, liquidity premiums increase more with credit risk premiums when sentiment is low. This higher correlation between the two main corporate bond risk factors is consistent with investors’ flight-to-quality into safer assets, e.g., Treasury bonds or cash. Finally, high risk factor correlation translates into high correlation between corporate bond yield spreads.
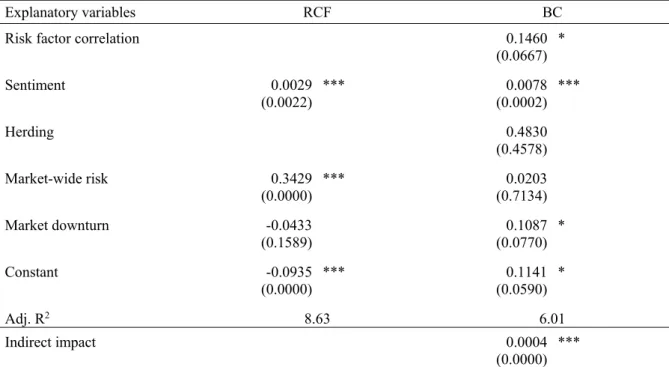
In particular, our model predicts that investors’ sentiment influences bond correlation through risk factor correlation.
In our empirical analyses we focus on a sample of US corporate bond transaction data from October 2004 to September 2010. We first document that bond correlation varies heavily over time. Second, consistent with our model’s predictions, our main results confirm that the correlation between risk factors is high when investor sentiment is low and high risk factor correlation translates into high bond correlation. Investor sentiment has a significant indirect impact on bond correlation via risk factor correlation even after controlling for a possible direct impact of sentiment, herding behavior, and the state of the economy.
Taken together, this essay documents the importance of risk factor correlation for corporate bond yield spreads. Our results are consistent with investor sentiment driving investors’ flight-to-quality behavior and thereby influencing corporate bond investors’
diversification opportunities. Thus, the findings of this essay are highly important for portfolio
and risk managers.
1. Introduction 5 Having shown that investor sentiment plays an important role in the corporate bond market, it is of further interest whether the sentiment of consumers, i.e. investors and all other individuals acting in an economy, also has an impact on corporate bond yield spreads.
Consumer sentiment might influence corporate bond yield spreads through their credit risk component. This is because consumer sentiment drives economic output (e.g., Ludvigson, 2004; Golinelli and Parigi, 2004; Gelper et al., 2007; Fornell et al., 2010). Thus, consumer sentiment should impact firms’ credit risk as firms’ economic success depends on the willingness to consume (e.g., Ittner and Larcker, 1998; Anderson et al., 2004).
Adhering to this idea, in the second essay (Bethke and Gehde-Trapp, 2016) we add to the strand of the literature analyzing the determinants of credit risk by investigating whether aggregated volume of Google search queries possesses fundamental value for the CDS market.
Today, Google is one of the major internet search engines.
12It is likely that individuals’ also use Google to gather information for their consumer decisions. Thereby they reveal their sentiment through their search queries (Demartini and Siersdorfer, 2010) which, in the end, influences their consumption. Consistent with this view, the aggregated volume of Google search queries contains consumption information before other financial variables or economic indicators (e.g., McLaren and Shanbhogue, 2011; Vosen and Schmidt, 2011; Choi and Varian, 2012). However, it is still an open issue whether aggregated Google search volume contains fundamental information for capital markets (e.g., Da et al., 2011b; Da et al., 2015; Dimpfl and Jank, 2016). In this context, the CDS market is an ideal laboratory to further analyze this open issue. This is because only institutional investors are active in the CDS market which reduces the influence of uninformed noise trading (e.g., Piotroski and Roulstone, 2004;
Boehmer and Kelley, 2009). In line with this view, the literature documents that information is priced efficiently (e.g., Norden and Weber, 2004; Acharya and Johnson, 2007). Finally, Tang and Yan (2010) show that monthly measured consumer sentiment is a determinant of CDS premiums while Google allows us to capture daily consumer sentiment before any other financial variable. If aggregated volume of Google search queries possesses fundamental value for the CDS market, we expect it to improve CDS premium change forecasts. If it even contains fundamental information not yet reflected in CDS premiums, we expect the Google indices to predict trends in CDS premium changes.
12 Nearly 80% of US households had access to the internet and 64% of US citizens used Google for their internet searches in 2015 (e.g., eMarketer, 2016; Comscore, 2016).
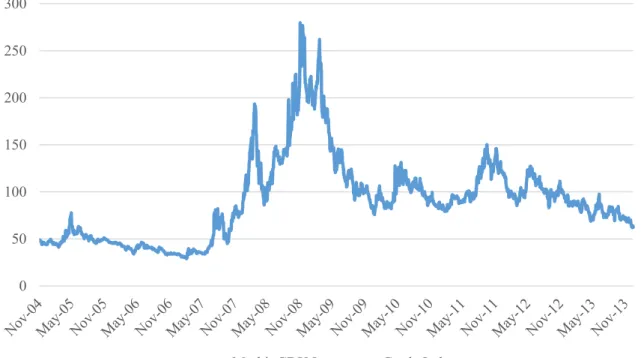
1. Introduction 6 Our analyses focus on the Markit CDX Investment Grade Index.
13Additionally, we use time series of aggregated volume of Google search queries from January 2004 to December 2013 for a large set of positive and negative connoted terms. These terms are used to compute two Google indices, one based on all positive and negative connoted terms and one based on positive and negative connoted economic terms. In line with the existing literature, we find the contemporaneous Google indices to positively determine CDS premium changes (e.g., Tang and Yan, 2010; Tang and Yan, 2013). We then document in-sample predictive power for both Google indices. However, the Google indices predict CDS premium change reversals. Thus, our results show that the Google indices contain no new fundamental information for the CDS market. Instead, the results are consistent with shocks in overall risk aversion temporarily influencing CDS premiums (e.g., Tetlock, 2007, Tang and Yan, 2010, and Tang and Yan, 2013). However, as indicated by the predictive power of both indices, analyzing Google search volume is valuable. In support of this result, we find that both Google indices improve out-of-sample forecasts especially in times when forecasts are more demanding. Overall, although both indices contain no new fundamental information, their in- and out-of-sample predictive power documents their fundamental value for the CDS market and its market participants.
The first two essays look at different aspects of sentiment and its influence on credit markets. Thereby the first essay identifies investor sentiment to be a driver of flight-to-quality behavior which is related to decreasing corporate bond liquidity. In this context, the question arises which corporate bonds are most affected by sharp decreases of corporate bond market liquidity.
For this reason, the third essay (Bethke, 2016) contributes to the strand of the literature that analyzes the determinants of corporate bond liquidity. While liquidity as a risk factor affecting individual corporate bond yield spreads has already been extensively analyzed, the literature on the comovement of individual bonds’ liquidity with market liquidity, commonality in liquidity, is scarce.
14This is surprising as commonality in liquidity influences investors’ opportunities to benefit from diversification (Domowitz et al., 2005). This is even more surprising given the size of the US corporate bond market and the fact that liquidity
13 A CDS index is designed as a credit insurance contract whose payoff is linked to the credit risk of a basket of firms.
14 Among others, Chordia et al. (2000), Hasbrouck and Seppi (2001), Huberman and Halka (2001), Kempf and Mayston (2008), and Karolyi et al. (2012) study commonality in liquidity among stocks, Chordia et al. (2005) between sovereign bonds and stocks, and Cao and Wei (2010), Marshall et al. (2013), and Frino et al. (2014) for derivative markets.
1. Introduction 7 significantly dropped for all US corporate bonds during the financial crisis in 2008 (e.g., Dick- Nielsen et al., 2012; Friewald et al., 2012). This suggests that the liquidity of individual corporate bonds depends on the overall market liquidity leading to commonality in liquidity.
My empirical analyses base on a sample of US corporate bond transaction data from July 2002 to December 2012. First, I document that commonality in liquidity exists among US corporate bonds. Given this result, it is then essential to get a better understanding of the determinants of commonality in liquidity. The theoretical literature suggests comovement in liquidity supply and demand to determine the degree of commonality in liquidity.
15For the cross-section of corporate bonds, my analyses reveal that the degree of commonality in liquidity is higher for bonds with an investment grade credit rating, with longer time to maturity, with higher amount outstanding, and for bonds issued by financial firms. In multivariate analyses that consider a broader set of possible bond, firm, and industry characteristics, I find support for supply- and demand-side effects both influencing individual bonds’ comovement with market liquidity.
For the time series of market-wide commonality in liquidity, I document that it varies heavily over time and peaks in months with more financial stress events. As for the cross- sectional results, I find supply- and demand-side effects to determine market-wide commonality in liquidity while the results provide evidence on supply-side effects, such as funding liquidity, being more important. In summary, my results contribute to the literature by providing a detailed picture of commonality in liquidity among corporate bonds.
Overall, the three essays provide new insights into the determinants of corporate bond risk factors and their impact on corporate bond yield spreads. First, the correlation between corporate bonds is higher when sentiment is low. This effect arises through higher risk factor correlation which is consistent with investors’ flight-to-quality behavior. Thus, risk factor correlation is important to consider when pricing corporate bonds. Second, not only investor sentiment but also consumer sentiment measured by aggregated volume of Google search queries is important as it determines and forecasts CDS premium changes. The results are consistent with a temporary impact of overall risk aversion on CDS premiums and show that
15 Regarding liquidity supply, higher inventory risk (e.g., Kyle and Xiong, 2001; Gromb and Vayanos, 2002), tighter risk management (Gârleanu and Pedersen, 2007), or lower funding liquidity (Brunnermeier and Pedersen, 2009) of liquidity suppliers may induce higher commonality in liquidity. Correlated demand for liquidity may arise through investors’ correlated selling activities arising through initial losses that raise the fear of even larger future losses (e.g., Bernardo and Welch, 2004; Morris and Shin, 2004), increased demand for more liquid assets (Vayanos, 2004), or preference for cheap information resulting in a common subset of information that is used to price different assets (Veldkamp, 2006).
1. Introduction 8
Google search volume is valuable for forecasting CDS premium changes especially in times
when forecasts are more demanding. Finally, this thesis documents that investors’ demand and
supply for corporate bonds influences the relation of individual corporate bonds’ liquidity to
market liquidity. In summary, the results are highly relevant for investors’ diversification
benefits across corporate bonds, firms’ financing costs, and policy makers’ basis for decision-
making.
Chapter 2 *
2. Investor Sentiment, Flight-to-Quality, and Corporate Bond Comovement
2.1. Introduction
Correlations are crucial when setting up efficient portfolios, taking appropriate hedging decisions, and managing risks. Thus, it is not surprising that correlations are widely studied in the financial literature (e.g., Ang and Chen, 2002; Connolly et al., 2007; Baele et al., 2010;
Abad et al., 2014; Nieto and Rodriguez, 2015). This evidence is based on correlations between equity markets, government bond markets, individual stocks and bonds, and common factors in asset prices and returns. Our paper contributes to this literature by identifying an economic mechanism of correlated risk factors driving corporate bond correlations.
Using a sample of US corporate bonds, we document that bond correlation varies heavily over time. Correlation between high-yield and investment-grade bonds is, for example, about three times higher in the financial crisis beginning in July 2007 than it was before.
Why does bond correlation display this time-series behavior? One possible explanation, typically adopted to explain correlations in equity markets, is investors’ herding. Kumar and Lee (2006) show that trading is correlated across retail investors and influences stock comovements. However, it is unlikely that retail investor herding is as important in bond markets as in equity markets since bond markets are dominated by institutional investors less prone to herding in market downturns (Borensztein and Gelos, 2003).
* This chapter is based on Bethke et al. (2015).
2. Investor Sentiment, Flight-to-Quality, and Corporate Bond Comovement 10 We propose an alternative explanation. In a nutshell, our theoretical model is based on the idea that investor sentiment has two main effects on investor behavior: Investors with low sentiment avoid risky assets (Baker and Wurgler, 2006) and react more to negative information (e.g., Mian and Sankaraguruswamy, 2012; Kaplanski and Levy, forthcoming). Thus, when sentiment is low, investors are less prone to invest in bonds with high credit risk and these bonds are less liquid than when sentiment is high. Consequently, liquidity premiums increase more with credit risk premiums when sentiment is low, i.e., correlation between these two main risk factors in corporate bonds is higher. High risk factor correlation translates into high correlation between corporate bonds. Thus, low investor sentiment ultimately goes along with high bond correlation.
In the empirical part of our paper, we use TRACE (Trade Reporting and Compliance Engine) data from October 2004 to September 2010. We document how bond correlation evolves over time and test our model that links bond correlation to risk factor correlation and risk factor correlation to investor sentiment. We find strong support for the predictions of our model. Correlation between risk factors in the corporate bond market is high when investor sentiment is low and high risk factor correlation translates into high bond correlation. Investor sentiment has a significant indirect impact on bond correlation via risk factor correlation even after controlling for a possible direct impact of sentiment, herding behavior, and state of the economy. Our results are stable over time and remain stable when we dig deeper into the cross- section by analyzing correlations between more detailed credit rating buckets.
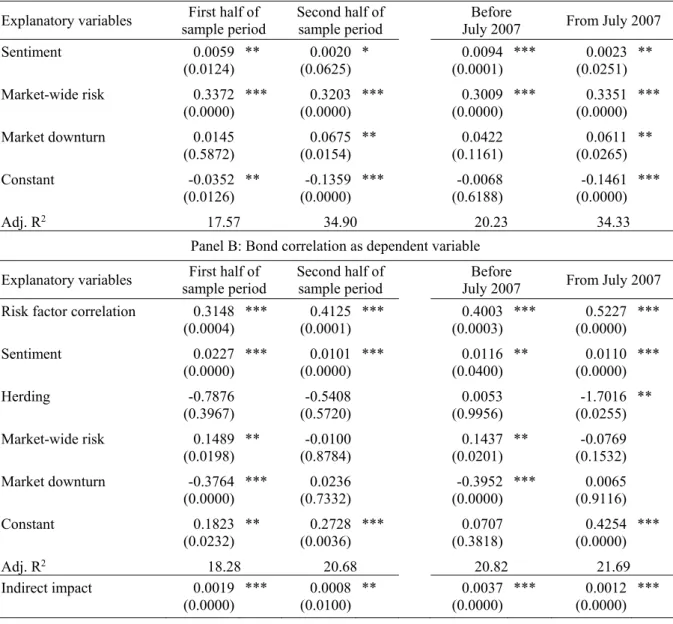
After establishing our main results, we run several tests to determine robustness of our findings. We show that our main findings depend neither on how we measure credit risk and liquidity premiums nor on how we proxy investor sentiment. They remain robust when we adjust correlations for interest rate risk and unexpected inflation, use the swap rate as proxy for the risk-free rate, or split the sample into a pre-crisis and crisis interval.
Our study is related to several strands of the literature. First, we contribute to the large
body of literature measuring asset correlations across countries and asset classes. Inter-market
studies for sovereign bonds (for Europe, e.g., Kim et al., 2006; Abad et al., 2010; Abad et al.,
2014; for Europe and the US, e.g., Skintzi and Refenes, 2006; Christiansen, 2007; for
developed countries, Driessen et al., 2003; for emerging and frontier countries, Nowak et al.,
2011; and Piljak, 2013) and equities (Connolly et al., 2007; Christiansen and Ranaldo, 2009)
focus on increasing financial integration at the international level. Studies that span asset
2. Investor Sentiment, Flight-to-Quality, and Corporate Bond Comovement 11 classes such as sovereign bond and equity markets (e.g., Connolly et al., 2005; Yang et al., 2009; Baele et al., 2010; Baker and Wurgler, 2012; and Bansal et al., 2014) or sovereign bond, corporate bond and equity markets at the aggregate level (e.g., Baur and Lucey, 2009; Brière et al., 2012) document the evolution of financial integration and flight to low-risk sovereign bonds in market downturns. At the individual security level, Acharya et al. (2013) find higher inter-market correlation between distressed stocks and corporate bonds in times of market downturns; Nieto and Rodriguez (2015) document common factors driving correlation between US stocks and corporate bonds of the same issuer. Correlations within asset classes are assessed either directly (e.g., Steeley, 2006 for different maturity segments of the UK sovereign bond market) or via common risk factors (e.g., Steeley, 1990; Litterman and Scheinkman, 1991 for UK and US sovereign bonds; Fama and French, 1993; Collin-Dufresne et al., 2001; Elton et al., 2001; Gebhardt et al., 2005; and Lin et al., 2011 for US corporate bonds; Klein and Stellner, 2014 and Aussenegg et al., 2015 for European corporate bonds).
We add to this literature by analyzing correlations within the US corporate bond market, determining and analyzing the correlation of systematic credit risk and liquidity, and interpreting this correlation as a flight-to-quality phenomenon.
Second, our paper is related to the literature that analyzes the economic mechanisms leading to higher correlation between asset returns. King and Wadhwani (1990) suggest that investors infer asset values in one market from values in another market to a larger degree when the information environment becomes more complex, which leads to higher correlations.
Connolly et al. (2007) trace high correlation back to high market uncertainty. In Brunnermeier and Pedersen (2009), a sudden drying up of investors’ funding ability leads to low market liquidity and high correlation. Barberis et al. (2005) argue that groups of investors are prone to "investment habitats". Investors within one habitat trade more similarly. Kumar and Lee (2006) show that such herding is caused by investor sentiment. Chordia et al. (2011) find that market downturns lead to retail investors’ herding and to higher stock correlations. We add to this literature by showing that low investor sentiment increases risk factor correlation, and high risk factor correlation leads to high bond correlation.
Third, we contribute to the literature analyzing the relation between liquidity and credit
risk. Vayanos (2004) argues that investors attach a higher value to liquidity when markets are
volatile. Ericsson and Renault (2006) motivate and document a positive correlation between
credit risk and liquidity premiums for corporate bonds. Dick-Nielsen et al. (2012) and Friewald
2. Investor Sentiment, Flight-to-Quality, and Corporate Bond Comovement 12 et al. (2012) show that – consistent with flight-to-quality behavior – liquidity premiums increase more for low-rated than for high-rated corporate bonds during the recent financial crisis. In contrast, Longstaff et al. (2005) find a negative correlation between credit risk and liquidity premiums for corporate bonds. Our paper reconciles this contradictory evidence by showing that risk factor correlation varies over time and depends on investor sentiment. In addition, we show that stronger flight-to-quality increases the comovement within corporate bond markets.
Finally, our results extend the growing literature on the influence of investor sentiment in the US corporate bond market. Nayak (2010) finds that corporate bond spreads are affected by investor sentiment. Tang and Yan (2010) show that market-wide credit spreads negatively depend on investor sentiment. We add to this literature by showing that low investor sentiment leads to high risk factor correlation and, ultimately, high bond correlation.
The remainder of the paper is organized as follows. In Section 2.2, we document how bond correlation evolves over time. In Section 2.3, we develop our model to explain varying bond correlation and state our main hypotheses linking bond correlation to risk factor correlation and risk factor correlation to investor sentiment. Our hypotheses are tested in Section 2.4. In Section 2.5, we provide various robustness tests and Section 2.6 concludes.
2.2. Bond correlation over time
2.2.1. Bond sample
We calculate bond correlations based on bond transaction data (actual trade price, yield resulting from this price, trade size, trade time, and trade date) from TRACE (Trade Reporting and Compliance Engine). We filter out erroneous trades with the algorithm described in Dick- Nielsen (2009) and use only plain vanilla bonds with fixed coupons. We exclude bonds without S&P rating (obtained from Thomson Reuters Datastream) and initial time to maturity of more than 30 years. Additionally, we exclude bonds for which Thomson Reuters Datastream does not provide 5-year credit default swap (CDS) mid quotes, since we use these to calculate credit risk premiums.
As TRACE does not cover BBB-rated and high yield bonds before October 2004
(Goldstein and Hotchkiss, 2012), our sample starts on October 1, 2004. It ends on September
30, 2010, since Thomson Reuters Datastream provides CDS data only until that date. We
2. Investor Sentiment, Flight-to-Quality, and Corporate Bond Comovement 13 exclude federal holidays as only sparse trading occurs on these days. The final sample consists of 4,266 corporate bonds of 426 companies. Table 2.1 displays summary statistics.
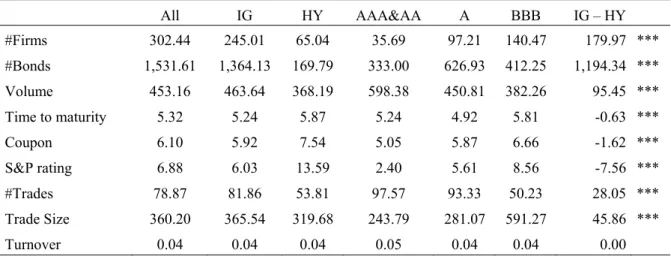
Table 2.1: Summary statistics of the TRACE sample
All IG HY AAA&AA A BBB IG – HY
#Firms 302.44 245.01 65.04 35.69 97.21 140.47 179.97 ***
#Bonds 1,531.61 1,364.13 169.79 333.00 626.93 412.25 1,194.34 ***
Volume 453.16 463.64 368.19 598.38 450.81 382.26 95.45 ***
Time to maturity 5.32 5.24 5.87 5.24 4.92 5.81 -0.63 ***
Coupon 6.10 5.92 7.54 5.05 5.87 6.66 -1.62 ***
S&P rating 6.88 6.03 13.59 2.40 5.61 8.56 -7.56 ***
#Trades 78.87 81.86 53.81 97.57 93.33 50.23 28.05 ***
Trade Size 360.20 365.54 319.68 243.79 281.07 591.27 45.86 ***
Turnover 0.04 0.04 0.04 0.05 0.04 0.04 0.00
Notes: The table reports characteristics of the TRACE corporate bond sample. We report the mean of these characteristics for the full sample, the investment grade (IG) sample and high yield (HY) sample. The IG sample is further split into three subsamples consisting of all bonds belonging to specific credit rating buckets. The buckets are AAA and AA, A, and BBB. #Firms is the average number of companies with actively traded bonds,
#Bonds is the average number of actively traded bonds per month. Volume is the average outstanding volume per actively traded bond in million USD. Time to maturity is the average time to maturity in years. Coupon is the average per annum coupon rate in percentage points. S&P rating is the average S&P rating expressed as a number (AAA=1, …, C=21). #Trades is the average number of trades per bond per month. Trade size is the average trade size per bond in thousand USD. Turnover is the average monthly trading volume per bond as a percentage of issue volume. In the last column, we report the difference between the IG and HY sample ***, **, and * denote significance of a t-test for differences from zero at the 1%, 5%, and 10% significance level, respectively.
Table 2.1 shows that the mean number of companies with actively traded bonds per month is 302, the majority with an investment grade (IG) rating (245 companies). The mean number of actively traded bonds per month (1,531) indicates that five bonds per issuing company are traded. Again, most bonds are in the IG segment, but even the high yield (HY) segment contains a broad bond portfolio (170 bonds). Mean outstanding volume is 453.64 m USD. It is significantly higher in the IG segment than in the HY segment (IG: 463.64 m USD;
HY: 368.79 m USD). Mean time to maturity roughly equals 5 years and is significantly higher
in the HY segment (IG: 5.24 years; HY: 5.87 years). The mean S&P rating for IG bonds is
6 (=A), the mean HY rating is almost 14 (=B+). Regarding trading activity, IG bonds trade
significantly more frequently: 82 trades per bond per month, on average, compared to 54 trades
of HY bonds. Mean trade size is 14% larger for IG bonds than for HY bonds. Despite the
2. Investor Sentiment, Flight-to-Quality, and Corporate Bond Comovement 14 higher trading frequency and trading size, mean turnover is not larger for IG bonds than for HY bonds due to higher issuance volume in the IG segment.
An analysis of the specific credit rating buckets shows most bonds are rated A or BBB, but average bond volumes and number of trades (but not trade size) are larger in the AAA&AA bucket.
16Time to maturity equals roughly five years in all buckets, and turnover is also similar in all buckets. As expected, coupon rates are larger for lower credit rating buckets.
2.2.2. Bond correlation
To calculate bond correlation, we first aggregate corporate bonds into two portfolios: an investment grade and a high yield corporate bond portfolio. Like Longstaff et al. (2005), we focus on bond spreads as the difference between the yield and the maturity-matched risk-free rate (obtained by interpolating US Treasury yields).
17For each trading day, we compute one IG and one HY portfolio yield spread as the average yield spread across all traded bonds in the respective segment. We then calculate bond correlation as the 22-day rolling Pearson’s correlation between the two portfolios’ daily yield spread changes.
18We focus on changes instead of levels to ensure stationarity. Figure 2.1 shows how bond correlation evolves over time.
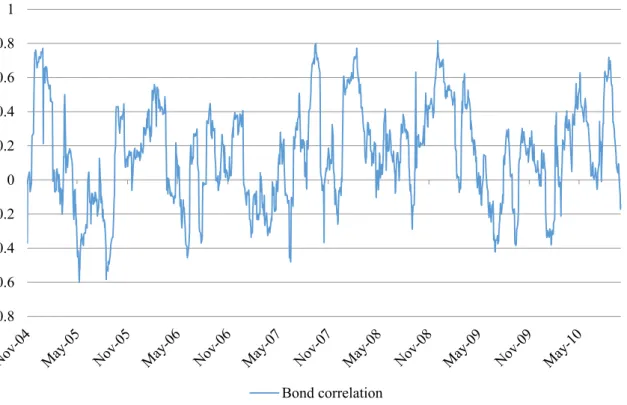
Figure 2.1 clearly shows that bond correlation varies strongly over time. It exhibits spikes around the acquisition of Bear Stearns by JPMorgan (March 16, 2008) and the September 2008 turmoil (federal takeover of Fannie Mae and Freddie Mac on September 7, the acquisition of Merrill Lynch by Bank of America on September 14, and the Lehman default on September 15). It is easy to see that bond correlation is much higher at the start of the financial crisis (July 2007). A numerical analysis shows that it is about three times as large,
16 Like Wang and Wu (2015), we split the IG segment into three credit rating buckets and do not split the HY segment due to its much lower number of bonds and trading frequency. The first IG bucket (AAA&AA) consists of all bonds rated AAA or AA. The second and third IG buckets consist of bonds rated A and BBB, respectively.
17 More specifically, on each trading day we collect constant maturity US Treasury yields from Thomson Reuters Datastream of maturities between one month and 30 years. We then fit a cubic function with maturity as the independent variable to the observed yields, and use the interpolated yield as a proxy for the maturity-matched risk-free rate at this date.
18 As an alternative, we could measure time-varying correlation via a dynamic conditional correlation (DCC)- GARCH model, as Nieto and Rodriguez (2015) and Bartram and Wang (2015), or a smooth transition Markov- switching model, as Yang et al. (2009). We choose the conventional rolling window estimation as in Connolly et al. (2007); Panchenko and Wu (2009); Chordia et al. (2011); and Bansal et al. (2014) because it is more parsimonious with respect to the number of parameters that need to be estimated, does not depend on a specific distribution assumption or a specific functional form for the transition function, and is less likely to be dominated by past dynamics, and thus overstate persistence, if the data contains structural breaks.
2. Investor Sentiment, Flight-to-Quality, and Corporate Bond Comovement 15 Figure 2.1: Bond correlation time series
Notes: The figure displays bond correlation time series. The depicted time period lasts from November 2, 2004 to September 30, 2010. Bond correlation is computed as the 22-day rolling Pearson’s correlation between the average investment grade and the average high yield bond yield spread changes.
with 21.3% after July 2007 but only 6.3% before, and the difference is statistically significant at the 1% level. This increase in correlation mirrors the higher correlation between equities in crises widely documented in the empirical literature (King and Wadhwani, 1990; Longin and Solnik, 1995; De Santis and Gerard, 1997; Longin and Solnik, 2001; Connolly et al., 2007;
Chordia et al., 2011).
Next we analyze bond correlations in the ratings cross-section. We use the same buckets as before, and compute correlation between two credit rating buckets using the same portfolio approach as for Figure 2.1 and Table 2.1. Table 2.2 reports summary statistics.
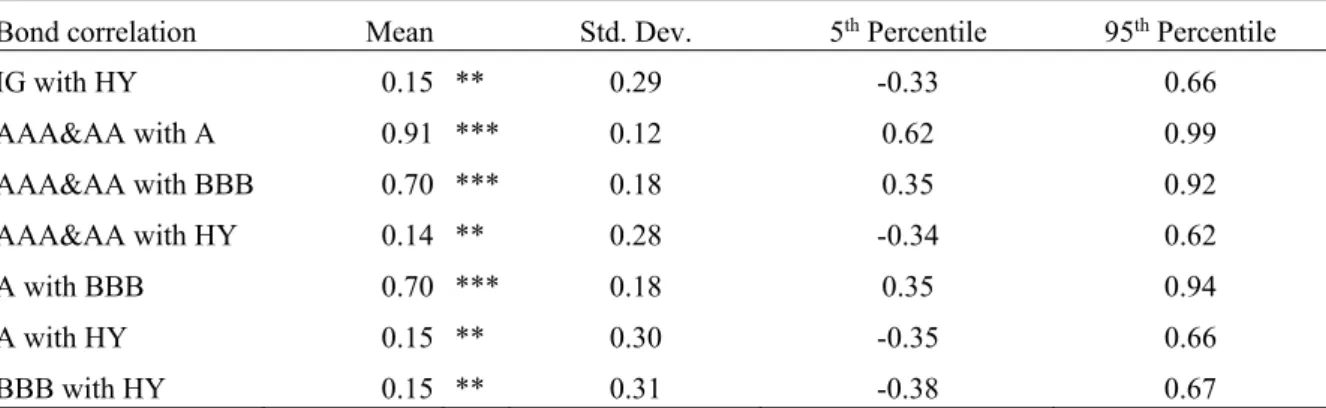
Table 2.2 shows that correlations between the different buckets are positive on average.
However, average correlation is much lower (around 0.15) and only significant at the 5% level when the HY segment is involved, compared to correlations between the IG buckets (0.70 at least, always significant at the 1% level). This difference is consistent with empirical evidence in Brière et al. (2012) that cross-country correlations across the IG and HY segment are lower than correlations within the IG and the HY segment. The standard deviation and the 5
thand
-0.8 -0.6 -0.4 -0.2 0 0.2 0.4 0.6 0.8 1
Bond correlation
2. Investor Sentiment, Flight-to-Quality, and Corporate Bond Comovement 16 95
thpercentile indicate high variation over time in all correlations, in line with the visual impression obtained from Figure 2.1.
Table 2.2: Summary statistics of bond correlations
Bond correlation Mean Std. Dev. 5th Percentile 95th Percentile
IG with HY 0.15 ** 0.29 -0.33 0.66
AAA&AA with A 0.91 *** 0.12 0.62 0.99
AAA&AA with BBB 0.70 *** 0.18 0.35 0.92
AAA&AA with HY 0.14 ** 0.28 -0.34 0.62
A with BBB 0.70 *** 0.18 0.35 0.94
A with HY 0.15 ** 0.30 -0.35 0.66
BBB with HY 0.15 ** 0.31 -0.38 0.67
Notes: This table reports the mean, standard deviation, 5th, and 95th percentile of bond correlations. Bond correlations are determined as described in Section 2.2.2. We report correlations between investment grade (IG) and high yield (HY) bonds. The IG sample is further split into three subsamples consisting of all bonds belonging to specific credit rating buckets. The buckets are AAA and AA, A, and BBB. ***, **, and * denote significance of a t-test for differences from zero at the 1%, 5%, and 10% significance level, respectively. Significance is determined using Newey-West standard errors.
2.3. Explaining bond and risk factor correlation
In this section, we propose a model to explain the evolution of bond correlation. The model uses the fact that the main risk factors priced in bond yield spreads are credit risk and liquidity.
Therefore, higher correlation between these risk factors translates into higher bond correlation.
This raises the question: What drives risk factor correlation? We show that low sentiment translates into high risk factor correlation and, thus, high bond correlation.
Our model consists of two basic ingredients: First, correlation between risk factors (credit risk premiums, liquidity premiums) depends crucially on investor sentiment. Second, bond correlation is determined by this correlation between credit risk premiums and liquidity premiums. We focus on the economic intuition in this section. In the appendix, we formally derive our hypotheses in a reduced-form model based on a discrete two-factor Hull and White (1994) term structure model.
2.3.1. Risk factor correlation and investor sentiment
We first derive the impact of investor sentiment on risk factor correlation. Consider a corporate
bond whose credit risk and liquidity vary over time. For simplicity, consider a zero bond
2. Investor Sentiment, Flight-to-Quality, and Corporate Bond Comovement 17 maturing at date t=2 with notional value 1 and assume that the risk-free interest rate is r=0 and the recovery rate is R=0 as well. We can express the bond’s risk-neutral price at time t=1 as
1 1
B 1, 2 exp , (2.1)
where
1is the bond’s risk-neutral default intensity and
1is the bond’s risk-neutral illiquidity intensity, both known at t=1. From the perspective of time t=0, the default and illiquidity intensities at t=1 are unknown, and the price at time t=0 is
0 0
0
1 1
B 0, 2 exp E exp , (2.2)
where expectations are computed under the risk-neutral measure. The corresponding per- period log yields at time t=0 and time t=1 are ys
0 1 2
0
0 log E
0 exp
1
1
and ys
1
1
1, and the corresponding credit risk and liquidity premiums
19are
1
0 0 0
1 1
1 log exp
2 ,
,
cr E
cr
(2.3)
0 1
0 0 0 0 0
1
1 1
1
1 1
1 log exp log exp ,
2 .
liq ys cr E E
liq ys cr
(2.4)
Equations (2.3) and (2.4) show that in this model, the covariance between credit risk and liquidity premium changes Cov ar
0 c r , liq equals the covariance between the intensities
0
1,
1Covar .
In the empirical literature (e.g., Ericsson and Renault, 2006 or Dick-Nielsen et al., 2012), credit risk and liquidity premiums are usually assumed to be positively correlated, which corresponds to positively correlated intensities in our model (as in Schönbucher, 2002).
Economically, this positive correlation reflects the pricing effect of the well-known flight-to- quality behavior of investors: bonds become less liquid when their credit quality deteriorates
19 Since we consider a risk-neutral investor, we use the term “risk premium“ for the compensation this investor requires for expected losses. As Equations (2.2) to (2.4) show, the investor does not demand additional compensation for possible variations in the credit quality or liquidity of the bond.
2. Investor Sentiment, Flight-to-Quality, and Corporate Bond Comovement 18 (e.g., Dick-Nielsen et al., 2012; Friewald et al., 2012; and Acharya et al., 2013) as investors shift their portfolios towards risk-free bonds or cash.
The novel mechanism we suggest is that the extent of flight-to-quality depends on investor sentiment. The economic rationale is twofold. First, low investor sentiment reduces an investor’s propensity to invest in risky assets (Baker and Wurgler, 2006). Hence, the overall bond liquidity premium level is high when investor sentiment is low. We therefore link sentiment to liquidity premium levels. Second, the extent to which liquidity premiums change as a reaction to shocks in credit quality depends on sentiment. Investors perceive risks more severely when their sentiment is low (e.g., Kaplanski and Levy, forthcoming), and low sentiment affects an investor’s reaction to negative information about firm fundamentals more than her reaction to positive information (e.g., Mian and Sankaraguruswamy, 2012).
Therefore, we make the impact of credit risk shocks on liquidity premiums dependent on the sentiment level.
We model both effects in our setting by introducing a general investor sentiment parameter x and an impact variable a
twhich depends on the default intensity
t. Both x and
ta jointly determine the magnitude of the flight-to-quality effect that investors exhibit as a reaction to a credit risk shock.
20Larger values of x (-1 < x < 1, where x = 0 corresponds to neutral sentiment) indicate lower investor sentiment; a
tdepends on whether the fundamental information is negative (then, a
t a
tu), neutral ( a
t a
tm), or positive ( a
t a
tdwith
1d
1m
1ua a a ). To illustrate the sentiment impact, consider a negative fundamental information ( a
t a
tu) about the firm implying a credit risk shock at t=1 (
1
0). If investor sentiment is low, i.e., x is positive, investors react more strongly to this information, which leads to a higher flight-to-quality effect compared to the case of neutral sentiment (x=0). Conversely, positive sentiment (x<0) reduces the flight-to-quality effect compared to the case of neutral sentiment.
We model this sentiment-dependent flight-to-quality effect by multiplying the liquidity intensity
1with 1 a x
1u .
21Therefore, the liquidity risk premium depends on sentiment:
20 Conceivably, causality could also run in the opposite direction: a liquidity shock could be the fundamental information, and this could affect credit risk. In our model, we choose credit risk as the fundamental information for two reasons: First, only this direction of the effect is consistent with the economic intuition of Baker and Wurgler (2006), Kaplanski and Levy (forthcoming), and Mian and Sankaraguruswamy (2012).
Second, this is consistent with empirical evidence of Kalimipalli and Nayak (2012) and Kalimipalli et al. (2013) that liquidity shocks have a second-order effect on corporate bond spreads compared to credit risk shocks.
21 Positive sentiment (x<0) can generate negative risk factor correlation in our model, leading to a flight-from- quality effect. Longstaff et al. (2005) and Ericsson and Renault (2006) have empirically documented that
2. Investor Sentiment, Flight-to-Quality, and Corporate Bond Comovement 19
0 0 1
0 0 1 0
1 1
1 1
1
1 log exp log exp ,
2 1
1
1
,
liq E E
liq a
a x a
x
x
(2.5)
and the covariance between credit risk and liquidity premium changes Cov ar
0 c r , liq
equals the covariance between the credit risk intensity and the sentiment-adjusted liquidity intensities Covar
0
1,
1 1 a x
1 .
22This covariance as well as the corresponding correlation both increase in the sentiment parameter x as shown in the appendix. This leads to our first hypothesis: risk factor correlation increases when investor sentiment decreases.
2.3.2. Bond correlation and risk factor correlation
Second, we link risk factor correlation and bond correlation. Consider two corporate bonds, for example, one investment grade bond i and one high yield bond h with positive default and liquidity intensities
i h t/ ,and
i h t/ , 1 a x
t
.Without loss of generality, the default (liquidity) intensity of a bond can be split into a systematic part
,
/ ,m t i h
(
m t, 1 a x
t
i h/ ,) and an idiosyncratic part,
i h/(
i h/). Under the standard assumption that idiosyncratic factors are uncorrelated with systematic risk factors and across bonds, the covariance between yield spread changes of the two bonds results solely from covariance between systematic credit risk and systematic liquidity:
23
0 , , ,1 , , ,1 1
, , , , ,1 ,1 1
, 1
, 1 .
i h m i h m
i h
i h i h m m
Covar ys ys Var Var a x
Covar a x (2.6)
negative and positive correlations alternate in corporate bond markets. However, models that can explain both positive and negative risk factor correlations are scarce: for example, Ericsson and Renault (2006) can only generate consistently positive risk factor correlations. Beber et al. (2009), on the other hand, document average negative correlations between credit risk and liquidity premiums, and Chan et al. (2011) find flight-from- quality episodes in equity and commodity markets.
22 Alternatively, one could interpret a xt as the time-varying market price of liquidity risk, which could be caused by variations in the risk-free interest rate or in unexpected inflation. Since our model is derived from the perspective of a risk-neutral investor, we only account for these effects in our empirical analysis. In Section 2.5.2, we show that sentiment remains significant as a determinant of risk factor correlation even after adjusting credit risk and liquidity premiums for interest rate risk and unexpected inflation.
23 There is a large body of literature on correlated defaults and systematic credit risk: see, e.g., Das et al. (2007) or Duffie et al. (2009). Among others, Chacko (2006) and Lin et al. (2011) show that systematic liquidity is priced for corporate bonds. Bao et al. (2011) document a positive relation between systematic credit risk and systematic illiquidity in corporate bond markets.