Gross National Happiness and Material Welfare
in Bhutan and Japan
Gross National Happiness
and Material Welfare in Bhutan and Japan
Tashi Choden
Centre for Bhutan Studies with
Takayoshi Kusago, Kokoro Shirai Osaka University, Japan
Centre for Bhutan Studies
Gross National Happiness and Material Welfare in Bhutan and Japan
Copyright © 2007 the Centre for Bhutan Studies
First Published: 2007
The Centre for Bhutan Studies PO Box No. 1111 Thimphu, Bhutan Tel: 975-2-321005, 321111
Fax: 975-2-321001 e-mail: cbs@druknet.bt http://www.bhutanstudies.org.bt
ISBN 99936 -14-40-2
Printed at Phama Printing & Publishers
Contents
1 Notes vi
2 Acknowledgement vii
3 Introduction viii
4 Subjective Wellbeing in Bhutan 1
5 Background 3
6 Overview of the pilot survey data 4
7 Descriptive analysis of data 6
8 Wellbeing and PWB/SWB measures 8
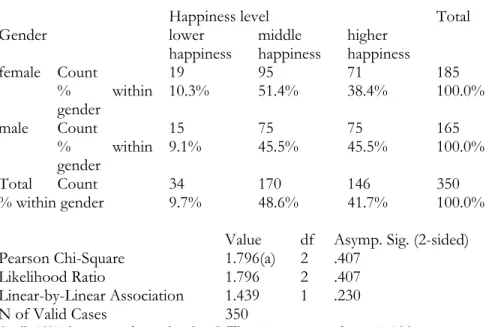
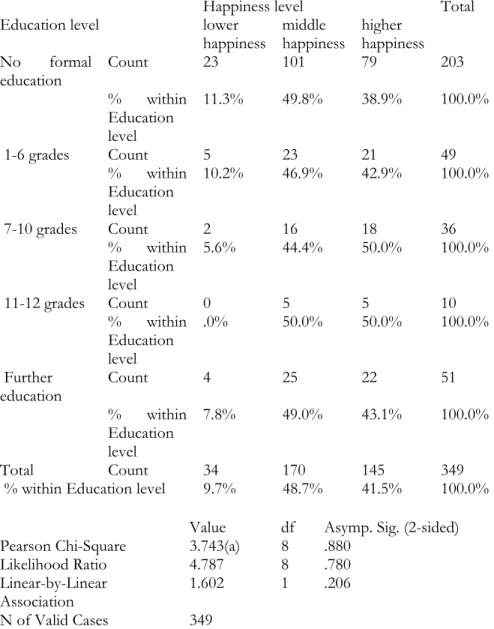
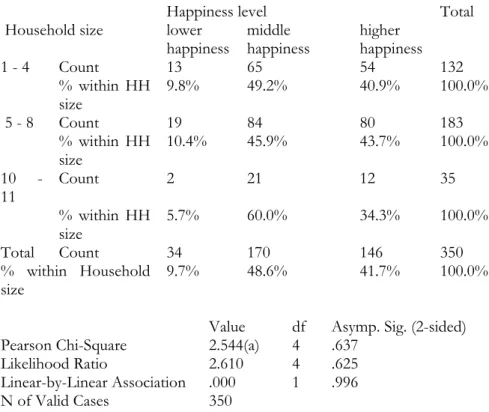
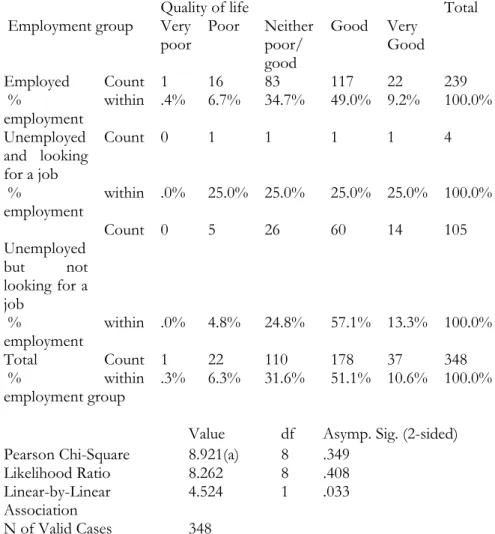
9 Cross-tabulation analysis of data on PWB/SWB 22 Factors related to happiness and psychological wellbeing 51 10 Overall result of exploratory data analysis of PWB/SWB in
Bhutan 77
11 Japan: A Miraculous economic growth after WWW II 81 12 Has GDP expansion brought about safe and secured lives for
the Japanese 85
13 Examining Japanese growth by GPI and HDI 86 14 Measuring quality of growth by GPI 87 15 HDI (Human Development Index) for Japan 988 16 Regional variations and discrepancies between GDP and HDI 89 17 Analysis of people’s life satisfaction in Japan: who feel more
satisfied with their life? 95
18 GNH-based governance: A case of the Arakawa-ward, 102
19 Concluding discussions 108
20 Bibliography 112
21 Appendix I 114
22 Appendix II 121
23 Appendix III 161
24 Appendix IV 208
25 Appendix V 216
vi
Note
This is a joint collaboration study between the Centre for Bhutan Studies and Dr. Takayoshi Kusago of Osaka University.
As the executing agency, the Centre has been responsible for coordination and implementation of the project from January 2006 until June-end 2007;
and the designing of survey questionnaire and conduct of pilot survey on Psychological Wellbeing/Subjective Wellbeing (PWB/SWB) in Bhutan.
Dr. Kusago provided technical support to the Centre with the assistance of Dr. Kokoro Shirai of Osaka University for statistical analysis of the data on PWB/SWB pilot survey in Bhutan.
Main parts of this joint report have been authored as follows:
Dr. Takayoshi Kusago: Introduction, Part 2, conclusion Dr. Kokoro Shirai: Part 1.5 -1.6
Tashi Choden: Introduction, Part 1.1 – 1.4, report compilation and editing During the initial stages of project conception and formulation, Dorji Penjore, senior researcher at CBS, developed the project proposal to Japan Foundation. It should be noted that much of his text in the project proposal has been utilized in the introduction section of this report.
vii
Acknowledgements
We would like to thank The Japan Foundation in Tokyo, Japan and New Delhi, India for their generous funding of this project, which enabled us to carry out several significant activities over the course of one and half years.
The field survey in Bhutan was carried out by CBS researchers and temporary staff who spent long hours each day interviewing respondents across the country over the course of five months. Our appreciation goes out in particular to Phuntsho Rapten, Karma Wangdi, Karma Galay, Tshering Phuntsho, Sangay Chophel, Kuenzang Lhadon, Samdrup, Wangchuk Rinzin, Ugen Chhophel, Jigme Tshering, Chhothuen Thinley, Tshoki Zangmo and Ugen Yangchen for their hard work and dedication.
We are also grateful for the support extended by the Dzongdas, Dungpas, Gups, Tshogpas District Statistical Officers and other officials of Paro, Punakha, Thimphu, Chhukha, Sarpang, Trongsa, Bumthang, Mongar and Lhuentse Dzongkhags.
Central to the whole process were the respondents to our survey from all across Bhutan; to them we would like to express our deepest appreciation for their valuable time, warm hospitality, and for sharing with us their perceptions on their sense of happiness and wellbeing.
The results of the pilot survey in Bhutan and a report on Japan’s economic growth and life satisfaction were presented by the authors at a seminar held on 5th June 2007 by the Centre in Thimphu. At this event, local participants and several others from across the region took active part in the discussions, and we would like to thank them all for their contribution. In particular, we extend our appreciation to the following invitees who made presentations during the latter half of the seminar:
Dr. Andre Beteille FBA, Chairman, Indian Council of Social Science Research, India on Social Science Research; Professor Kenji Kosaka, Dean, Dept. of Sociology, Kwansei Gakuin University, Japan on Sociology of Happiness; Ms. Sauwalak Kittiprapas, Director, Public Policy Development Office, Thailand on A brief concept on 'happiness measurement and implications to public policy’; Dr. Noppadon Kannika, Director of ABAC Poll, Assumption University, Thailand on Designing the Gross Domestic Happiness Survey in Thailand; and Mr. Yoichi Noguchi who was a discussant at the seminar
viii .
ix
Introduction
Empirical evidence strongly suggests that modern economic development has not increased subjective wellbeing in high-income countries, despite manifold increases of incomes over just a couple of decades. In many domains, people even experience a deterioration of their quality of life as competitive forces grow along with incomes. Stress at the work place, longer work weeks and less sleep, inequality-induced discrimination and poverty are just a few examples. Rising depression and suicide rates, high incidence of obesity and large-scale environmental destruction are also typical side effects of the pursuit of economic growth by many of the high- income states. While Japan clearly belongs to these high-income countries and, incidentally, has one of the longest series of subjective wellbeing data in the world, Bhutan belongs to the group of low or medium-income countries.
Unlike most of them, however, Bhutan has taken ownership of its development strategy and has come up with a unique development philosophy under the title “Gross National Happiness” (GNH) formulated by His Majesty the fourth King of Bhutan in the late 1970s. This expresses the idea that development should serve the wellbeing of the people and that economic growth is only a means for, not the end of, development.
Recently, GNH has received international attention from development practitioners, academics, the media and even policy makers who are looking for potent new concepts to reverse the destructive social developments in their own countries. The Bhutanese government is now working on the Bhutan Development Index which will be composed of GNH indicators to monitor and evaluate its development process.
x
In Asia, Japan has been seen as the most industrialized country since its Meiji Restoration in the late 19th century with its clear goal of being a strong nation comparative to industrial nations in the West. This tradition has been kept after 1945 when Japan lost the pacific war. Since then, Japan showed miraculous economic growth performance and increased per capita real GDP more than eight times between the 1950s and 2000. The Japanese government has used GDP and other objective economic measures to monitor and evaluate its performance, assuming that this approach brings about advancement of people’s wellbeing.
Bhutan and Japan can be seen to be at two distinctive places in terms of
‘development’ as ranked by different performance indicators shown in the table below:
Bhutan: Gross National Happiness
Bhutanese Well-bein Realization and
Enhancement Development:
Four pillars
Good Governance
Cultural Preservation
Environment Conservation
GNH indicators as a set of measures over
holistic human development and
ecological sustainablity
Set the target and Check the
progress by GNH Equitable
Socio- Economic Development
Measurements Expectation
Post-WWII in Japan:
Reconstruction of economic and social livelihood
Japanese Well-being Realization and
Enhancement Economic
Development through Industrialization
Higher Education Technicaql and Skills
Technological Advancement
Expansion of markets (overseas)
GDP as a good proxy for the overall performance of the Japanese economic
development
Set the target and Check the progress by GDP Priority
Production
Strategy Measurements Expectation
xi
Bhutan and Japan: contrast in development performance
GDP Rank (PPP value) HDI Rank (value) HPI Rank (value)
Bhutan 137th
(US1,969) 135th
(0.538) 13th
(61.1)
Japan 18th
(US29,251) 7th
(0.949) 95th
(41.7)
Gross Domestic Products: GDP (UNDP 2006); Human Development Index: HDI (UNDP 2006); Happy Planet Index: HPI (NEF 2006)
It is interesting to note the contrast that while Japan is placed much higher than Bhutan in terms of Gross Domestic Product (GDP) and Human Development Index (HDI), Bhutan is placed much higher than Japan by the Happy Planet Index (HPI). What can be understood from this is that the core areas of emphasis placed by each of these indicators significantly influences the projected performance of each country, highlighting their specific areas of strength and weaknesses. As such, it is clear that Japan’s progress when measured in terms of economic growth (GDP) and human development (HDI) is very high, while the consequential impact of its industrial growth on the environment and sustainability is reflected by its low rank on the HPI. On the contrary, Bhutan’s progress in terms of economic growth and human development as defined by the UNDP are far behind that of Japan as reflected by its GDP and HDI ranking, but it’s much lower impact on the environment and comparatively sustainable approach to development is reflected in its high rank on the HPI.
In recent years, studies on alternative development paradigms and subjective wellbeing have increased. For example, in the late 1980s, our common future known as the Bruntland report (WCED 1987), warned of the negative impacts of economic growth strategy on the eco-system and environment.
In the 1990s, human development and human capability became inter- twined pillars of development1, as they gained popularity among economists and social scientists who were becoming increasingly dissatisfied with conventional economic development strategy as a measure of progress.
With growing concerns over excessive economic growth and its use of existing economic development measures such as GDP, researchers around the world have attempted to come up with subjective wellbeing measures to assess the outcome of development policies and plans adopted by
1 This includes pro-poor economic growth approaches and capability approaches (Sen 1983), and development of human development index (UNDP 1990).
xii
governments, based on people’s expressed satisfaction or dissatisfaction with their lives.
In the field of psychology, subjective wellbeing studies have been carried out, challenging the concept of utility used in modern economics (Kahneman, Diener and Schwarz 1999; Diener and Suh 2000; Frey and Stutzer 2002). In the field of sociology, worldwide inter-country comparisons on subjective wellbeing have been made for many countries (Veenhoven 1993). In the field of economics, attempts are being made to examine what factors influence the level of one’s happiness and life satisfaction (Frey and Stutzer 2002).
Coming back to the purpose of this project, it is through this collaborative study between the Centre for Bhutan Studies and Osaka University that we take a closer look at Bhutan and Japan’s experiences and outlook in terms of subjective wellbeing and economic growth. While the two countries contrast in many respects, in particular with respect to geography and the stage of economic development, they also share common features. Both are largely Buddhist countries, and both can be said to be at a critical stage in their socio-economic development, although in quite different ways. While Japan must find a way to overcome a decade of economic crisis and to cope with the requirements of post-modern development, Bhutan must find an answer to the questions of how to deal with the changes triggered by its fairly recent modernization policy and how to position itself in the global economy. The challenge for both is essentially the same: how can economic progress be harnessed for the happiness of the people?
This study on Gross National Happiness and Material Welfare in Bhutan and Japan is an attempt to find some answers to this question, through the utilization of existing data on life satisfaction in Japan, and through a pilot survey inventorying people’s perceptions on happiness and wellbeing in Bhutan.
With their many differences as well as similarities, Bhutan and Japan are two uniquely positioned countries in Asia providing an interesting opportunity to understand the relation between economic or material prosperity and people’s subjective perceptions on what is most important for their wellbeing.
This report consists of the two major parts:
xiii
PART I is the analysis report of the pilot survey carried out by the Centre for Bhutan Studies on psychological and subjective wellbeing (PWB/SWB) in Bhutan2.
PART II is the report on relationship between economic prosperity and people’s perceptions of their lives through the long-term trend data regularly collected by the government of Japan.
2 Analysis comprise of descriptive analysis and simple cross tabulation analysis from section 1.3 to 1.4, and further levels of analysis including GLM, ANOVA, MANOVA, logistic regression analysis, linear regression analysis, path analysis, and factor analysis in section 1.5.
xiv
1
PART I
Subjective Wellbeing in Bhutan:
Results of the Pilot Survey on Psychological/
Subjective Wellbeing
2
3
1 Subjective Wellbeing in Bhutan 1.1 Background
Gross National Happiness, a concept enunciated and inspired by the Fourth Druk Gyalpo3 Jigme Singye Wangchuck, is Bhutan’s development philosophy by which emphasis is placed on broader development goals such as spiritual wellbeing and happiness, and not economic growth alone. When planned development began in Bhutan in the early 1960s, the focus was primarily on the build up of basic infrastructure such as motor roads and the provision of social services in health and education. As Bhutan diversified its development activities over the decades, several priority areas were identified as essential to the overall direction of the development process.
By the late ‘90s, these priority areas of culture, environment, governance, and balanced and equitable development came to be known as the four pillars of Gross National Happiness (GNH).
In order to ensure that Bhutan progresses along the GNH path, an important step in recent times has been the decision of the government to develop indicators for GNH that would facilitate in tracking development along such principles. In December 2005, the Centre for Bhutan Studies was assigned this task and has since been working on developing GNH indicators and testing out their feasibility through a pilot survey encompassing nine broad themes.4 In brief, these nine themes that are considered vital elements of GNH fall within the domains of psychological wellbeing, health, time-use and balance, education, cultural diversity and resilience, good governance, community vitality, ecosystem diversity and vitality, and living standards.
Complementing this effort is the present report on Gross National Happiness and Material Welfare in Bhutan and Japan; it is a much smaller project and an independent one from the GNH indicator development project mentioned hitherto. Its focus is primarily on one dimension of GNH i.e. people’s perceptions and subjective assessments regarding their state of wellbeing and happiness. Therefore, this report on PWB/SWB in Bhutan only broaches the basic question of what is important for wellbeing of Bhutanese at the psychological and internal level; it does not attempt to assess the external causal and conditional elements encompassing other dimensions of
3 Druk Gyalpo: King of Bhutan
4 This is a two-year project that CBS has been executing upon the directive of the government, with funding from the UNDP Bhutan Program Office.
4
GNH. This is an important exercise in itself; after all, psychological wellbeing is partly an outcome and reflection of life circumstances and conditions existing at the individual, family, community and state level.
1.2 Overview of the pilot survey data
The survey data used in preparing this report were generated from questions covering demographics, psychological/subjective wellbeing, and individual income level. The bulk of the analysis is based on the psychological/subjective wellbeing data, and the survey questionnaire on this section is given in Appendix I.
In this questionnaire, qualitative and open-ended responses were obtained by asking respondents to list the things that they consider to be most important for their happiness and life contentment. They were encouraged to make subjective evaluations of their lives through questions that ask them to rate: their level of happiness in general; the quality of their life; their life enjoyment level; and their satisfaction with the major life domains of health, financial security, major occupations, and familial relationships. In order to get a sense of the social support available based on individual perception, respondents were asked how often various kinds of support are available to them when they need it. To get a general idea of self-assessed stress levels and major causes of stress amongst the sampled population, respondents were asked how stressful life was over the past year as well as the main source(s) of stress. The GHQ-12 (12-item General Health Questionnaire) was used to get an indication of general mental state amongst the sample i.e.
possible indication of depression and anxiety, severe mental problems, or normal mental health. On spirituality, people were asked how spiritual they consider themselves to be, and a number of questions enquiring about the frequency of various spiritual practices and teachings in daily life. Emotional experiences of the people were captured by asking how frequently they experienced several positive and negative moods/emotions over the past few weeks.
While there is data on income, amount of land and agricultural equipments owned amongst other detailed questions on living standards at the household level, only respondents who happened to be heads of households were asked to answer these sections. However, the question on individual income i.e. “Approximately how much cash income did you receive during the past 12 months?” was asked of all respondents regardless of whether they were heads of households or a member of the family/household.
5
Therefore, only individual income data is used in this report to ensure that all respondents can be included in analysis involving income level.
The demographic section contains the usual items: gender, age, marital status, education background & literacy, religion, geographical region, language, occupation and employment status, household size, and mobility pattern. Keeping in consideration the prevailing situation in Bhutan, education includes not only formal modern education, but also Non-Formal Education (NFE), instruction from lay monks/nuns and monastic education. Again, given the reality of Bhutan, people were asked to list their main activities or occupations during the past 12 months whereby the multiple areas of work that individuals undertake would be reflected.
However, for our purposes, we have used only the current employment status data which reflects whether one is employed, unemployed and looking for work, or unemployed but not looking for work (student, homemaker, retired persons, others).
Prior to formulation of the survey questions, literature review was carried out exclusively for four months to study the existing body of work on happiness, subjective wellbeing, psychological wellbeing, and the like.
Literature review continued alongside the construction of questions for the survey over the following three months, keeping in consideration the local Bhutanese context. Internationally used scales and items such as the happiness scale, quality of life scales, life satisfaction scales, and social support items have been used in this questionnaire to the extant of their relevance and applicability, so that there may be some basis for international comparison with the data. However, complete sets of questions could not be used in most of these cases as not all items could be translated meaningfully into local languages and dialects, and some items were not comprehensible in local context.
6
1.3 Descriptive analysis of data
1.3.1 Demographic Aspects 1.3.1.1 Geographic distribution
The survey was conducted in nine Dzongkhag (districts) to cover various geographical regions in Bhutan. Of the total 350 respondents, 123 persons or 35.1% are from the western districts of Paro, Punakha and Thimphu.
There are 53 respondents or 15.1% of the sample from the central districts of Trongsa and Bumthang; 90 persons or 25.7% from the eastern districts of Mongar and Lhuentse; and the remaining 84 persons or 24% from the southern regions of Chhukha (Phuentsholing) and Sarpang.
1.3.1.2 Gender, marital status and religious background
Female respondents account for 185 or 52.9% of the sample, and male respondents 165 or 47.1%. At the time of the survey, 72.3% of the respondents were married, 18.3% had never been married, 5.7% were divorced, 0.6% were separated, and 3.1% were widowed. Buddhism is reported as the main religion by 97.1% of the sample, and Hinduism by 2.9%.
1.3.1.3 Education background
Of all the respondents 58% have not attended any formal schooling, 10.9%
have completed their undergraduate studies, and 2% have completed their Master’s level studies. Those who studied up to the primary level (between grades 1-6) make up 14% of the respondents, and 28% have studied at the secondary level (grades 7-12). Those with vocational training background make up 2% of the respondents, and 9.5% of the respondents attended non-formal education (NFE). 7.1% of the respondents had some form of instructions from gomchen (lay monk), while 4.9% had formal monastic education. In terms of literacy, 32.6% are literate only in Dzongkha; 3.7%
literate only in English; 0.9% literate only in Nepali; 0.3% literate in both English and Nepali; 1.7% literate in Dzongkha, English and Nepali; and 15.1% literate in both Dzongkha and English.
1.3.1.4 Linguistic background
Bhutan’s national language is Dzongkha, but other languages and dialects are also prevalent in the country. When asked what is most commonly spoken at their homes, 35.7% said Dzongkha, 11.7% said Sharchop, 23.4%
said Cho-ca-nga-ca, 11.7% said Bumthangkha, 4.3 said Khengkha, 4% said Kurtop, 1.4% said Mangdebikha, 3.7 said Monpakha, 3.1 said Lhotshamkha, 0.3 said Dranjobikha, 0.3 said Chalikha, and 0.3 said English.
7
1.3.1.5 Employment status
Of the 329 persons who responded to this question, 72.7% were employed, and 1.2% were unemployed and looking for work at the time of the survey.
In other groups, students accounted for 8.5%, retired persons 1.5%, and homemakers (housewives) 16.1%. The latter three (students, retirees, homemakers) are categorized together as ‘unemployed but not looking for work’ in the rest of the report.
1.3.1.6 Age grouping
The youngest respondent in this survey was a 13 year old boy, and the oldest an 87 year old women. 3.7% of the respondents fall in the age group of 0-17 years, 31.3% fall in the 18-30 years age group, 33.3% fall in the 31- 45 years age group, 21% fall in the 46-60 years age group, and 10.6% fall in the 60 years and older age group.
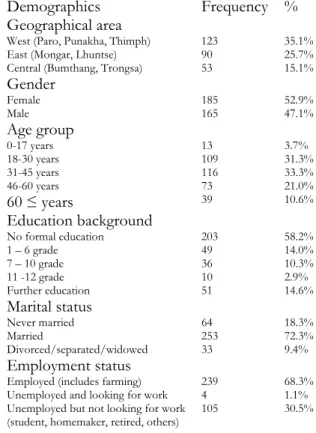
Table 1.1: Demographic aspects
Demographics Frequency %
Geographical area
West (Paro, Punakha, Thimph) 123 35.1%
East (Mongar, Lhuntse) 90 25.7%
Central (Bumthang, Trongsa) 53 15.1%
Gender
Female 185 52.9%
Male 165 47.1%
Age group
0-17 years 13 3.7%
18-30 years 109 31.3%
31-45 years 116 33.3%
46-60 years 73 21.0%
60 ≤ years 39 10.6%
Education background
No formal education 203 58.2%
1 – 6 grade 49 14.0%
7 – 10 grade 36 10.3%
11 -12 grade 10 2.9%
Further education 51 14.6%
Marital status
Never married 64 18.3%
Married 253 72.3%
Divorced/separated/widowed 33 9.4%
Employment status
Employed (includes farming) 239 68.3%
Unemployed and looking for work 4 1.1%
Unemployed but not looking for work
(student, homemaker, retired, others) 105 30.5%
8
1.4 Wellbeing and PWB/SWB Measures
1.4.1 Sources of wellbeing and happiness
The first question that was asked of all respondents was: “What are the six or seven things that you consider to be most important in leading to a happy and contented life?” This open-ended question was asked in order to hear directly from individuals their own thoughts and ideas on the constituents of a happy and contented life for themselves. The respondents were given the option of listing a minimum of one and a maximum of seven items in their response. Of the survey sample of 350 respondents, 2 persons did not answer this question at all.
Based on the responses of 348 persons, the answers were coded under 16 categories.5 For each of these categories, the frequency of responses (number of people whose responses fall under each of these categories) is also given below:
Table 1.2: Source of wellbeing and happiness
What are the six or seven things that you consider to be most important in leading to a happy and contended life?
N = 350 Valid
%
1 Financial security 231 66.0
2 Good family life and wellbeing of family 155 44.3
3 Good health 151 43.1
4 Resources for farm production 117 33.4
5 Access to basic facilities 88 25.1
6 Personal development and education 69 19.7 7 Faith and spiritual pursuits 60 17.1 8 Employment & job satisfaction 57 16.3 9 Good governance & welfare system 40 11.4 10 Good inter-personal relations 35 10.0 11 Principles & responsibility 30 8.6
12 Community vitality 28 8.0
13 Country’s peace & security 28 8.0
15 Recreation 17 4.9
5 The responses to this question were grouped under general themes or categories as could be applied to them. For example, there were several responses such as “no disease and sickness”, “healthy life”, “health facilities”, which could all be clubbed together under a general category created as “Good Health”. In the same manner, other categories were created based on people’s responses (and not by supplying fixed set of responses for them to choose from).
9
16 Mental peace 12 3.4
1.4.1.1 Financial security: 231 respondents
Financial security is the most common requirement for happiness and wellbeing as cited by the respondents. Within this category, respondents are mainly concerned about being self-sufficient and independent in earning their livelihood, in earning adequate income to provide a decent standard of living for themselves and family members, in owning land and house.
Except for a few individuals who specifically identified their desire for luxury cars and cash, most of the respondents identified with wanting to lead a decent and secure life in terms of finances.
1.4.1.2 Good family life and wellbeing of family: 155 respondents
Most of the respondents listing family talked about the importance of family relations and the wellbeing of family members. This category includes the importance of maintaining good ties and relationships, close and understanding family, enough time to spend together, having children as well as good future for them, supportive spouse or life partner, and the general wellbeing of family.
1.4.1.3 Good Health: 151 respondents
Personal good health, as well as the good health of children and other family members, is listed by respondents as an important condition to their overall wellbeing and happiness. Some explained that in the absence of sickness and death among family members, they do not carry as much worry or stress as they would otherwise have to go through.
1.4.1.4 Resources for farm production: 117 respondents
Most of the respondents who listed this are farmers residing in rural and semi-rural areas. They referred mostly to the importance of being able to reap good agricultural harvest with the availability of livestock, agricultural equipments, farm land and government support in these areas.
1.4.1.5 Access to basic facilities: 88 respondents
The majority of the respondents who listed under this category are people residing in semi-rural and rural areas of the country. Their main point is that access to basic facilities such as clean water, electricity, education & health facilities, road and other communication facilities are important for them to be able to lead comfortable lives. A few of the respondents also pointed to the need for easy access to loan and financial support institutions.
1.4.1.6 Personal development and education: 69 respondents
Individuals mentioned the need for personal development of themselves through education qualifications and other means, for the good quality of
10
education for their children, and the importance of free education available in the country for the general population.
1.4.1.7 Faith and spiritual pursuits: 60 respondents
Praying, visiting sacred places, meeting religious figures and lama, and carrying out various religious ceremonies were some of the most commonly listed items under this category.
1.4.1.8 Employment and job satisfaction: 57 respondents
This category includes the respondents’ expressed needs for adequate job opportunities, job security, job satisfaction and good working environment.
1.4.1.9 Good governance and welfare system: 40 respondents
Respondents expressed appreciation for, as well as importance of continued support provided by the government towards people’s welfare, and emphasized the importance of strong law and justice system.
1.4.1.10 Good inter-personal relations: 35 respondents
This category includes the need for good social relations in terms of being able to maintain and enjoy personal friendships, and good relations with relatives, neighbours and other people.
1.4.1.11 Principles and responsibility: 30 respondents
This category summarizes the need to uphold ethics, morals and responsibility as expressed by the respondents. These include the idea that it is important to lead uncorrupted life, being kind to others, supporting family and relatives, living up to parents’ expectation and being productive citizens.
1.4.1.12 Country’s peace & security: 28 respondents
Most respondents pointed to the need for general peace of the country, and a few referred to military security and the absence of war.
1.4.1.13 Community vitality: 28 respondents
Most respondents stressed the importance of cooperation within the community, good neighbourhood, and the absence of social and community problems such as drug abuse.
1.4.1.14 Recreation: 17 respondents
Respondents cited the importance of having adequate time for relaxation, sports and entertainment.
1.4.1.15 Mental peace: 12 respondents
Under this category, respondents said that it is important to maintain a sense of calm, to have no worries and stress, and to feel at peace.
11
1.4.2 Level of happiness
Asking people to rate themselves on a happiness scale is a commonly-used measure of subjective wellbeing. Respondents are asked what kind of person they consider themselves to be by asking them to rate their level of happiness from 1 to 10, whereby 1 is rated as “not a very happy person”
and 10 is rated as “a very happy person”. The average happiness score for 350 respondents in this survey is 6.93, which indicates that overall self-rated happiness is on the higher side. In contrast to 1.4% or 5 persons reporting the lowest level of happiness (1 on the scale), 16% or 56 persons reported the maximum level of happiness (10 on the scale). Overall, 27.1% scored along the first half of the scale (1 through 5) while 72.9% scored along the second half of the scale (6 through 10).
Figure 1.1
Level of happiness
Level of happiness
10 9 8 7 6 5 4 3 2 1
Percent
20
10
0
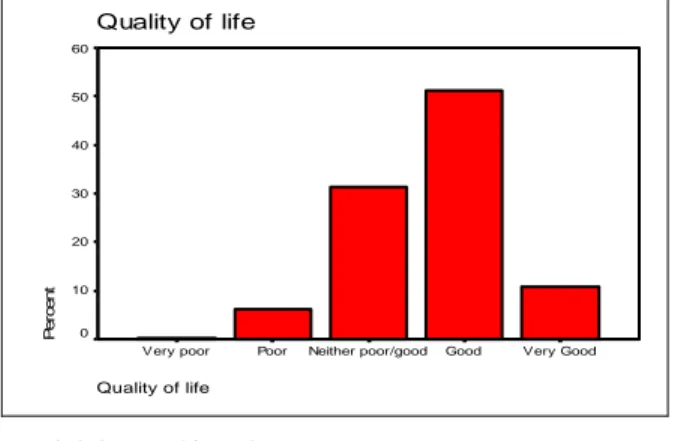
1.4.3 Quality of life (QOL)
Asking people to rate the quality of their life in general is another measure of subjective wellbeing. In response to the question, “How would you rate the quality of your life?” 62% of the respondents reported having good quality of life (very good 10.9%, good 51.1%), 6.6% reported poor life quality (0.3% very poor, 6.3% poor), and 31.4% reported in between (neither poor nor good).
Figure 1.2
12
Quality of life
Quality of life
Very Good Good
Neither poor/good Poor
Very poor
Percent
60
50
40
30
20
10
0
1.4.4 Life enjoyment
The ability to enjoy life is also a measure of subjective wellbeing. In response to the question “How much do you enjoy life”, 66.6% (233 persons) answered “quite a lot”, and 12% (42 persons) reported “an extreme amount”. Only 5 persons or 1.4% reported not enjoying life at all, and 20%
(70 persons) reported enjoying life only “a little”.
Figure 1.3
Enjoyment of life
Enjoyment of life
An extreme amount Quite a lot
A little Not at all
Percent
80
70
60
50
40
30
20
10 0
1.4.5 Life satisfaction
The satisfaction-with-life scale is also a common measure of subjective wellbeing. In this survey, people were asked to rate their satisfaction with major areas of life such as health, security of finances/livelihood, major occupation, and familial relationships in order to assess overall satisfaction with life. The total life satisfaction score averaged 13.80 based on a total minimum score of 3 and a total maximum score of 16. The outcome shows that the majority of the respondents are satisfied with life overall, with 24.6% of the respondents scoring 16 points (the maximum score), 19.7%
13
scoring 15 points, and 19.1% scoring 14. Below the average score level, only 0.3% or 1 person scored an absolute minimum of 3 points.
Figure 1.4
Total Life Satisfaction Score
Total Life Satisfaction Score
16.00 15.00 14.00 13.00 12.00 11.00 10.00 9.00 8.00 7.00 3.00
Percent
30
20
10
0
In individual areas of life, 56% reported complete satisfaction with their general health, 34% reported being fairly satisfied, 5.4% reported being not very satisfied, and 3.4% reported dissatisfaction with their health.
With regard to the security of their finances and livelihood, 39.4% reported complete satisfaction, 40.9% reported being fairly satisfied, 13.4% reported being not very satisfied, and 5.4% reported total dissatisfaction.
As for major occupations (farming, other jobs, studies), 62.9% reported complete satisfaction, 26.9% reported being fairly satisfied, 6% reported being not very satisfied, and 1.7% reported dissatisfaction with their occupation.
And lastly, 86.6% reported complete satisfaction with their relationships with family, 10.3% reported being fairly satisfied; only 2.3% and 0.3%
reported being not very satisfied and total dissatisfaction respectively. The details of these responses are given in table 1.3.
14
Table 1.3: Satisfaction with major life domains
Health Finances/
livelihood security
Major life
occupation Familial relationship N % N % N % N % Satisfied 196 56.0 138 39.4 220 62.9 303 86.6 Fairly satisfied 119 34.0 143 40.9 94 26.9 36 10.3 Not very
satisfied 19 5.4 47 13.4 21 6.0 8 2.3 Dissatisfied 12 3.4 19 5.4 6 1.7 1 0.3 Don’t know 4 1.1 3 0.9 2.6 2.6 2 0.6
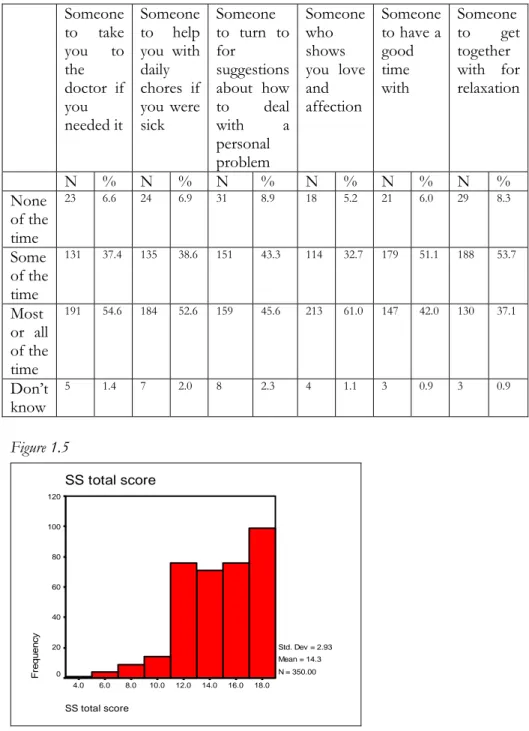
1.4.6 Social Support
Social support is considered an important element for wellbeing and positive functioning in life. Respondents are asked how often specific types of support are available to them i.e. (1) Instrumental support: someone to take you to the doctor if needed it, someone to help you with your daily chores if you are sick, someone to turn to for suggestions about how to deal with a personal problem; and (2) Emotional support: someone who shows you love and affection, someone to have a good time with, someone to get together with for relaxation.
The total social support score ranged from a minimum 4 points through to a maximum 18 points. The average score across all respondents is 14.32, with a mode of 18. Of the 350 respondents, 29.7% or 104 persons reported less social support, 20.3% or 71 persons reported moderate social support, 31.7% or 111 persons reported relatively high social support, and 18.3% or 64 persons reported very high social support.
15
Table 1.4: Social support Someone
to take you to the doctor if you needed it
Someone to help you with daily chores if you were sick
Someone to turn to for
suggestions about how to deal with a personal
problem
Someone who shows you love and affection
Someone to have a good time with
Someone to get together with for relaxation
N % N % N % N % N % N % None
of the time
23 6.6 24 6.9 31 8.9 18 5.2 21 6.0 29 8.3
Some of the time
131 37.4 135 38.6 151 43.3 114 32.7 179 51.1 188 53.7
Most or all of the time
191 54.6 184 52.6 159 45.6 213 61.0 147 42.0 130 37.1
Don’t know
5 1.4 7 2.0 8 2.3 4 1.1 3 0.9 3 0.9
Figure 1.5
SS total score
18.0 16.0 14.0 12.0 10.0 8.0 6.0 4.0
SS total score
Frequency
120
100
80
60
40
20
0
Std. Dev = 2.93 Mean = 14.3 N = 350.00
16
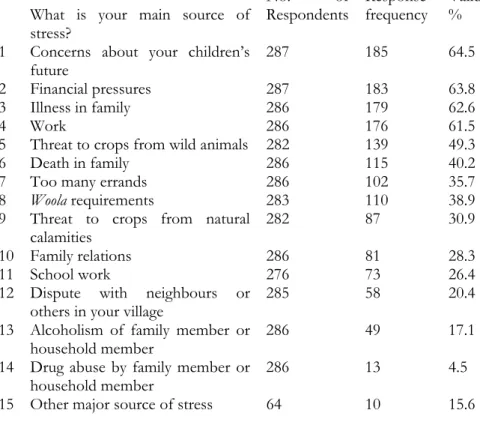
1.4.7 Stress
Depending on the amount and frequency, stress and worry can gradually or eventually affect one’s sense of wellbeing and mental peace. In asking respondents about the degree of stress in their lives in the past one year, 19.5% reported life as being very stressful, 42% reported life as being somewhat stressful, 22.4% reported life was not very stressful, 15.8%
reported that life was not at all stressful in the past one year, and 0.3 responded ‘don’t know’.
The major source of stress for each individual varied, but the most common sources cited by 83.9% of the total sample (who responded that there was some degree of stress in their lives) were: concern about children’s future, financial pressure, illness in the family, and work.
Table 1.5: Stress
What is your main source of stress?
No. of Respondents Response
frequency Valid
% 1 Concerns about your children’s
future 287 185 64.5
2 Financial pressures 287 183 63.8
3 Illness in family 286 179 62.6
4 Work 286 176 61.5
5 Threat to crops from wild animals 282 139 49.3
6 Death in family 286 115 40.2
7 Too many errands 286 102 35.7
8 Woola requirements 283 110 38.9
9 Threat to crops from natural
calamities 282 87 30.9
10 Family relations 286 81 28.3
11 School work 276 73 26.4
12 Dispute with neighbours or
others in your village 285 58 20.4
13 Alcoholism of family member or
household member 286 49 17.1
14 Drug abuse by family member or
household member 286 13 4.5
15 Other major source of stress 64 10 15.6
17
1.4.8 General Health Questionnaire (GHQ)
The twelve-item General Health Questionnaire (GHQ-12) is being used in this survey to get a general idea of the respondents’ state of mental health (it is not intended as a diagnostic tool). Consisting of questions that assess mood symptoms, biological and social functions over the past one month, GHQ is calculated and interpreted here using the Likert scale with the lowest score at 0 and the highest possible score at 36. A lower score between the range of 0-15 indicates normal mental wellbeing, a score between 16-20 indicates some distress, and higher scores of 21 and above are symptomatic of severe problems and psychological distress.
The average GHQ score of the sample is 10.9, the mode is 6, and median is 10, indicating that on average most of the respondents fall within normal range.
Of the 305 respondents who responded to the GHQ items, 84.6% or 258 persons show no evidence of mental problems, 10.2% or 31 persons show some evidence of distress, and 5.2% or 15 persons show evidence of severe problems and psychological distress.
Figure 1.6
GHQ total score
30.0 27.5 25.0 22.5 20.0 17.5 15.0 12.5 10.0 7.5 5.0 2.5 0.0
GHQ total score
Frequency
80
60
40
20
0
Std. Dev = 4.93 Mean = 10.9 N = 305.00
18
1.4.9 Spirituality
Although the concept of spirituality is constantly debated, the assumption here is that a spiritual person is more likely to have contemplated on issues beyond the materialistic aspects of life, and that he or she would therefore find this to be a contributing factor to general sense of wellbeing. When asked “How spiritual do you consider yourself to be”, 59.4% reported being
“very spiritual, ” 36.3% reported being “moderately spiritual”, while 3.1%
reported being “not very spiritual” and 1.1% being “not at all spiritual”.
Figure 1.7
The following table shows the responses to the questions asked in the survey on some of the practices of the Bhutanese people that may be understood as acts demonstrating spirituality.
How spiritual do you consider yourself to be Frequency
Very 60%
Moderately 36%
Not very 3%
Not at all 1%
19 Table 1.6
Spirituality Freq Valid%
1. How spiritual do you consider yourself to be: (n = 350)
Very 208 59.4
Moderately 127 36.3
Not very 11 3.1
Not at all 4 1.1
2. If you are a parent, do you discuss spiritual issues with your children: (n = 346)
Daily 26 7.5
Weekly 10 2.9
Occasionally 184 53.2
Not at all 55 15.9
Not a parent 71 20.5
3. Do you attempt to follow spiritual teachings and practices in your daily life: (n = 350)
All the time 110 31.4
Most of the time 106 30.3
Occasionally 124 35.4
Not at all 10 2.9
4. How important are your spiritual beliefs to the way you live your life: (n = 350)
Very 277 79.1
Moderately 67 19.1
Not very 5 1.4
Not at all 1 0.3
5. Do you say/recite prayers: (n = 345)
Daily 185 53.6
Weekly 16 4.6
Occasionally 107 31.0
Not at all 37 10.7
6. Do you practice meditation: (n = 350)
Daily 23 6.6
Weekly 4 1.1
Occasionally 25 7.1
Not at all 298 85.1
7. Do you make offerings in the chhoshom: (n = 349)
Daily 271 77.7
Weekly 4 1.1
20
Occasionally 61 17.5
Not at all 13 3.7
8. Do you visit local temples and other places of spiritual significance in your community: (n = 348)
Daily 16 4.6
Weekly 12 3.4
Occasionally 309 88.8
Not at all 11 3.2
9. Do you go on pilgrimages to place outside your community: (n = 348)
Monthly 3 0.9
A few times a year 72 20.7
Once a year 124 35.6
Not at all 149 42.8
10. Do you take part in spiritual discussions with other people: (n = 350)
Daily 11 3.1
Weekly 6 1.7
Occasionally 289 82.6
Not at all 44 12.6
11. Do you consider Karma in the course of your daily life:
(n = 349)
Always 185 53
Sometimes 124 35.5
Rarely 32 9.2
Never 8 2.3
1.4.10 Emotional experience
Another constituent of general wellbeing is emotional wellness detected through the experience of positive and negative emotions over time.
Respondents were asked how often they experienced various emotions over the course of the past few weeks up to the day they were interviewed.
21 Table 1.7
How often do you experience: Often
(%) Sometimes
(%) Never
(%) Total (%)
Calmness 23.8 61.9 14.3 100.0
Empathy/compassion 35.0 56.7 8.3 100.0 Forgiveness 23.3 65.2 11.5 100.0 Contentment 23.5 61.6 14.9 100.0
Generosity 30.4 63.3 6.3 100.0
Anger 13.5 51.6 35.0 100.0
Envy 7.4 41.0 51.6 100.0
Guilt 4.9 37.0 58.2 100.0
Resentment 4.6 43.0 52.4 100.0
Selfishness 2.3 24.1 73.6 100.0
Jealousy 1.4 15.2 83.4 100.0
Pride 5.7 28.7 65.6 100.0
Disappointment 5.2 60.2 34.7 100.0
Sadness 7.7 53.9 38.4 100.0
Frustration 5.2 55.5 39.4 100.0
Whether some of these emotions listed are positive or negative would certainly vary according to cultural contexts elsewhere. However, within this survey context for Bhutan, calmness, empathy, forgiveness, contentment, and generosity are considered positive emotions; and anger, envy, guilt, resentment, selfishness, jealousy, pride, disappointment, sadness, and frustration are considered negative emotions as described in Buddhist philosophy. The general tendency amongst the survey respondents, as shown in Table 1.7, is that they report experiencing positive emotions more in the ‘sometimes’ and ‘often’ range, than ‘never’; on the other hand, the experience of most negative emotions is reported to be ‘often’ only by a small percentage of the respondents, as most report experiencing negative emotions only sometimes and never.
The idea followed here is that the more often one experiences such positive emotions, the better it is for one’s sense of wellbeing; reversely, the experience of negative emotions is considered harmful to one’s sense of wellbeing if experienced frequently.