• Keine Ergebnisse gefunden

Energy transitions in Europe

N/A
N/A
Protected

Academic year: 2021

Aktie "Energy transitions in Europe"

Copied!
35
0
0

Wird geladen.... (Jetzt Volltext ansehen)

Volltext

(1)

Energy transitions in Europe

common goals

but different paths

(2)

Energy transitions in Europe common goals but different paths

A Euro-CASE report

Euro-CASE Energy Platform

(3)

5 About Euro-CASE

The European Council of Academies of Applied Sciences, Technologies and Engineering is an independent non-profit organisation of national academies of Engineering. Applied Sciences and Technology from 23 European countries. It was founded in 1992. The Executive Committee meets four times a year. The Board meets twice a year. Euro-CASE acts as a permanent forum for exchange and consultation between European Institutions, Industry and Research.

The global impact of engineering and technologies is growing every year. We are still trying to understand their social impact and acceptability and we cannot say with certainty which technologies will be transforming our lives even 10 or 20 years from now.

Through its Member academies, Euro-CASE has access to top expertise - around 6,000 experts. They offer valuable input by elaborating and sharing their vision on different topics strongly connected to technologies, engineering and their societal impact. The resulting reports are disseminated through the network, and communicated to relevant national government officials, and officials of the European Commission. The Euro-CASE activity programme is a unique opportunity to confront and synthesise academic visions across Europe.

As the unique European network of academies in the field of technologies and engineering, Euro-CASE has begun to

deploy a set of actions to strengthen its visibility: internal actions through the platforms and external actions directly

at the European Commission level via SAPEA (Science Advice for Policy by European Academies).

(4)

7 Energy transitions in Europe

common goals but different paths

Euro-CASE Energy Platform

1. Foreword ... 9

2. Scope and purpose of the paper ... 11

3. Energy systems in the EU ... 13

4. Vision of the EU and the European Commission ... 27

5. Energy transitions in Europe ... 29

5.1 France ... 29

5.2 Germany ... 32

5.3 Poland ... 34

5.4 Serbia ... 40

5.5 Slovenia ... 42

5.6 Spain ... 44

5.7 Sweden ... 47

6. Comparison and concluding remarks ... 51

Annex: ... 53

Glossary of terms ... 59

Energy Platform Members ans Staff ... 61

Mission Statement & Governance ... 63

Member Academies ... 65

(5)

9

1. Foreword

The Paris Agreement on bringing climate change to a halt was signed after the COP 21 in Paris in November/December 2015. There is today little controversy about the infl uence of man-made CO

2

emissions on climate change, which mainly results from burning fossil fuels for energy generation. However, presently, the efforts of EU Member States to meet the targets of the Paris agreement by reducing CO

2

emissions through a number of measures, are diverging between EU member states to a large extent. This is predominantly due to the different energy systems that have been established in these states over time, which in turn are partly a consequence of the presence or absence of energy resources. It is still far from clear how the objectives of the Paris Agreement will be met given the various uncoordinated approaches to the energy transition in the member states.

Euro-CASE, the European network of engineering academies, is aware of this diversity of approaches to CO

2

emission reduction and has therefore established an “Energy Platform” to explore the situation and create awareness among the concerned community.

It is hoped that the present report will help all those who support the efforts to make the various strategies for the energy transition a success.

Based on the underlying premise that the European Academy alliances may play a crucial role in shaping national energy policies, which remain the responsibility of Member States, the present Euro-CASE paper is intended to inform Academy members in EU countries about energy issues that all European states and peoples are confronted with and the energy-policies and efforts that have been put in place to deal with them. This role comprises fact-based consulting of society and politics and may include suggestions for common projects and European cooperation.

This report does also inform about the ambitious climate protection goals of the European Community, which, in principle, should be sealed by binding international contracts.

Furthermore, it does inform about the various efforts to replace CO

2

-generating fossil energy sources with renewable energy sources such as water and wind power, photovoltaics, geothermal energy or biomass and the diffi culty in dispatching the electricity from such sources on demand and not as available. Energy storage, in what-so-ever form, is hence a major issue for the energy transition. Other issues include, for example, more effi cient energy conversion, heat insulation of buildings, mobility, but also the inertia inherent in existing energy systems that have been built to last and that have consumed considerable investments.

Finally, the report emphasises that the effort to reduce greenhouse gas emissions must be a global effort as highlighted by the Paris agreement and that Europe should play a leading role in this effort.

The President of Euro-CASE and the Chair of the Energy Platform wish to thank all Platform members and the scientifi c offi cer for their unrelenting commitment to producing the present report.

Prof. Reinhard Hüttl, Prof. Eberhard Umbach,

President of Euro-CASE Chair of the Euro-CASE

Energy Platform

(6)

11

2. Scope and purpose of the paper

It is widely agreed that one of today’s grand global challenges is the fight against climate change and – related to it – against the increase of greenhouse gases, especially CO

2

, in the atmosphere. This increase is clearly related to our human activities in the past 150 years and has in the meantime reached levels much higher than any value that has ever been determined for the past several hundred thousand years. The main source of CO

2

emissions, the burning of fossil fuels for energy conversion into electricity, heat/cold and mobility, can only be reduced if we change our energy system nearly completely. The main goal of this transition is the replacement of fossil by non-fossil energy sources like the so-called renewable energies (water and wind power, photovoltaics, geothermal energy or biomass) flanked by a continuous increase of conversion efficiency and by energy savings for instance by better heat insulation. Such an energy transition is complex, expensive, time-consuming and requires a change of our industrial processes, transport systems and personal habits. Therefore, it has considerable inertia and hence needs a continuous stimulation by incentives and other steering actions, an effort far more arresting and challenging than, for example, sending a human to Mars, because it involves the entire society including all branches of industry and agriculture as well as all citizens.

In order to be finally successful in fighting climate change, the energy transition must be a global effort involving all countries around the globe. Although only a relatively small contributor compared to the US or China, Europe plays an important role in this challenge because it is in many respects at the forefront (or at least amongst the leading regions):

for instance, in the energy consumption and hence CO

2

emission per person, in the amount of industrialization and production, and in the awareness that the global resources are limited, our environment must be protected, and the climate change must be limited. Therefore, Europe must lead the way in climate protection and energy transition as a good example and with highest possible speed.

But Europe is very heterogeneous and in many respects complex – culturally, historically, economically, socially, and politically. This is also true for the energy systems of the various European countries and the ways and priorities with which the energy transitions are handled. Nevertheless, the European Union has agreed on common, well-defined goals and has committed itself in binding contracts to well defined achievements in climate protection (e.g. United Nations Framework Convention on Climate Change, COP 21 in Paris 2015). These goals have recently been reconfirmed, and a process to define the contributions of the various countries in detail and to monitor their progress in meeting the goals has been set up.

The purpose of the present academy-internal paper is to inform the members of European academies about this energy issue, especially about the energy diversity in Europe and the various approaches of energy transitions. It should also inform about the very ambitious common goals of the European Community in climate protection which were promised to be met by binding international contracts. Based on the knowledge of this diversity and of the complexity of Europe and its different approaches to climate protection and based on the knowledge that the final responsibility remains with the member states, it becomes clear that the academies and in particular the European academy alliances may play an important, perhaps catalyzing role. This role comprises information and communication as well as fact-based consulting of society and politics, and it may include suggestions for common projects and European cooperation.

The structure of this paper is as follows: chapter 2 presents selected data (mostly from Eurostat) with short explanations

and comments showing the versatility of the European energy landscape. Chapter 3 addresses the goals of the European

Community and the role of EU commission and parliament. In chapter 4, more detailed examples from some of

those member states which were represented by Platform members are given. And the final chapter 5 draws some

conclusions from the information given in the previous chapters.

(7)

13

3. Energy systems in the EU

With the following chapter we want to draw a picture of the status quo of the European energy system. Thus, we will discuss a few selected variables and summarise the quantities for the 28 countries of the European Union (EU-28) as well as draw attention to the diversity of the individual countries. Most of the considerations are based on energy data consolidated by Eurostat

1

and published annually

2

.

The starting point for the considerations is the greenhouse gas emissions. They are considered to be the origin for the man-made recent climate change through the greenhouse effect. In order to mitigate the impact of climate change, greenhouse gas emissions have hence to be reduced.

Emissions

Estimated worldwide carbon emissions from burning fuels in 2017 reached 32.5 Gigatons (Gt) of CO

2,

a 1.4% increase over 2016 emissions and a 220% increase over emissions in 1971 (14.8 Gt CO

2

emissions). China had the largest increase from slightly below 1Gt CO

2

emissions in 1971 to 9.84 Gt CO

2

in 2017, followed by India with slightly below 0.2Gt CO

2

emissions in 1971 to 2.47 Gt in 2017. Data for CO

2

emissions per capita for EU countries are shown in the Section 5.1 (France).

Despite all political discussions and decades of efforts to reduce greenhouse gases, global energy-related CO

2

emissions are today still rising slightly but steadily

3

. The EU contributes a share of approx. 10.6% (3542 Mt CO

2

).

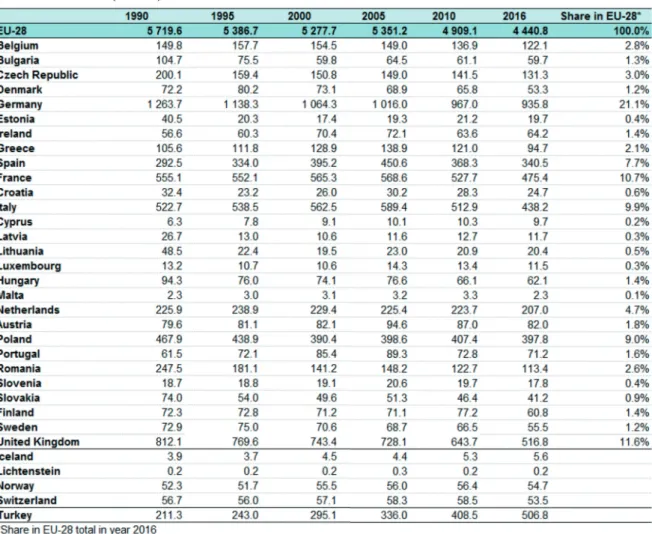
The chronological course of the total (not only energy- related) emission of greenhouse gases in the EU can be seen in Figure 1. In 2016, total GHG emissions were 4.4 billion tons of CO

2

equivalents

4

(see also table A1 in the Annex), 22% below 1990 levels. The diamond in the figure marks the EU target for 2020 (20% reduction) for GHG emissions, which in fact have fallen below this level already in 2016. However, increased efforts are needed to achieve the target value for 2030 (reduction of at least 40%).

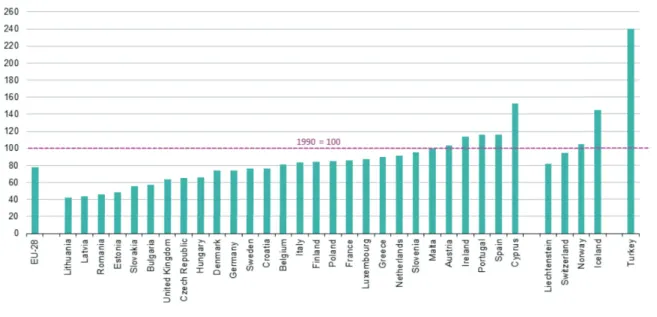
A comparison of the individual countries shows a wide dispersion of the relative changes between 1990 and 2016 (see Figure 2). This is due to different energy mixes and economic developments in these countries during that period. Lithuania, Latvia and Romania show the strongest reduction in GHG emissions. On the other hand, Portugal and Spain, for example, have experienced an increase of 16%. When looking at the absolute figures

5

, it is noticeable that greenhouse gas emissions were highest in Germany (21% of the EU-28 total or 936 million tons of CO2-equivalents), followed by the United Kingdom and France.

1. Eurostat is the statistical office of the European Union. Its mission is to provide high quality statistics for Europe. It consolidates beyond other topics statistical data on energy collected by the member states and provides analyses. A good overview can be found on https://ec.europa.eu/eurostat/web/energy/data/main-tables (download 5.1.2019).

2. So for example in the annual report “Energy, transport and environment indicators” published lately in the 2018 edition (https://

ec.europa.eu/eurostat/documents/3217494/9433240/KS-DK-18-001-EN-N.pdf/73283db2-a66b-4d34-9818-b61a08883681) (download 5.1.2019).

3. https://www.bmwi.de/Redaktion/DE/Downloads/Energiedaten/energiedaten-gesamt-pdf-grafiken.pdf?__

blob=publicationFile&v=38 (download 5.1.2019) or “BP statistical review of world energy”, June 2018 https://www.bp.com/

content/dam/bp/en/corporate/pdf/energy-economics/statistical-review/bp-stats-review-2018-full-report.pdf (download 5.1.2019).

4. “CO

2

equivalent is a metric measure used to compare the emissions from various greenhouse gases on the basis of their global- warming potential (GWP), by converting amounts of other gases to the equivalent amount of carbon dioxide with the same global warming potential.” (See annual report “Energy, transport and environment indicators”, Eurostat.)

5. The table with absolute numbers can be found in the annex A1.

(8)

14 15

The average reduction of 22% is made up of widely scattering values from the individual (IPCC) energy sectors

6

. With the exception of the transport sector (including international aviation), all other sectors show reductions in GHG emissions in absolute and relative terms.

7

This applies in particular to the energy industry and private households.

8

Figure 3 shows the GHG

emissions in 2016 by IPCC source sector. Evidently, (fossil) fuel combustion is responsible for over ¾ of the GHG emissions. The largest shares have the transport (24.3%) and the energy industry sector (26.9%). Note, that fuel combustion has mainly a fossil origin but can also have a non-fossil origin, as it is the case for waste combustion.

Figure 1: Evolution of greenhouse gas emissions in Europe from 1990 (value set at 100) to 2016. Source: EEA, republished by Eurostat (env_air_gge), https://ec.europa.eu/eurostat/statistics-explained/index.php/Climate_change_-_

driving_forces#General_overview . The fi gure shows roughly a 20% decrease of greenhouse gas emissions in the European Union.

Source: European Environmental Agency (online data: code: env_air_gge)

Figure 2: Total 2016 GHG emissions by country relative to the 1990 level represented by the 100 dotted red line (Eurostat (env_air_gge), https://ec.europa.eu/eurostat/statistics-explained/index.php/Climate_change_-_driving_

forces#General_overview) . Every green bar below the 100 level signifi es a reduction in emissions relative to the year 1990. Every green bar passing that level signifi es an increase in emissions.

Figure 3: Share of greenhouse gas emissions by IPCC source sector: Eurostat (env_air_gge), https://ec.europa.eu/

eurostat/statistics-explained/index.php/Climate_change_-_driving_forces#General_overview)

Gross inland energy consumption

The gross inland energy consumption

9

amounts to 68 EJ

10

in 2016 for EU-28. This is the quantity of energy which is necessary to satisfy the energy needs of the 28 EU states. These 68 EJ are produced by conversion of different primary energy carriers.

6. IPCC source sectors are according to the technological source of emissions: a) energy (fuel combustion and fugitive emissions from fuels) — which also includes transport; b) industrial processes and product use; c) agriculture; d) land use, land use change and forestry (LULUCF); e) waste management.

7. EEA, republished by Eurostat (env_air_gge) (download 5.1.2019)

8. See discussion in https://ec.europa.eu/eurostat/statistics-explained/index.php/Climate_change_-_driving_forces#General_

overview

9. It is the quantity of energy consumed within the borders of a country and calculated: primary production + recovered products + imports + stock exchange –exports – bunkers.

10. EJ = exajoule, TJ = terajoule, GWh = Gigawatt hours. 68 EJ=68 000 000 TJ=68*10

18

J and 1 TJ=0,2778 GWh

(9)

16 17

Figure 4: Gross inland energy consumption by resource in the EU 18 in 2016.

Data taken from https://ec.europa.eu/eurostat/web/energy/data/main-tables)

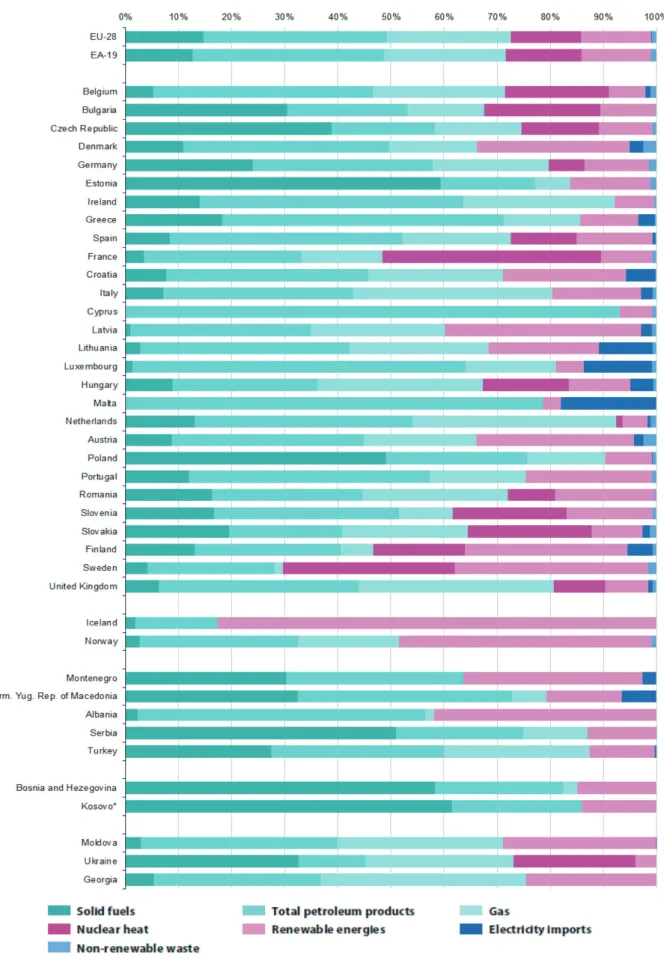
This figure emphasizes the still persisting importance of fossil resources in the energy system: Gas, total petroleum products and solid fuels make over 73%. Nuclear energy sources contribute with 13%. Renewable energies (RE) contribute to the same account (13%). However, there are big differences between the countries which can be seen in Figure 5.

In France, for example, the use of nuclear energy dominates with a contribution of over 40%, but also in Sweden it has a share of over 30%. However, Sweden has a very large share of RE. Only Latvia, Austria, Denmark and Finland have similarly high RE shares. Countries such as Belgium, Luxembourg, the Netherlands and even the UK lag behind in the use of renewable energies. In Germany RE account

for just over 10% of gross energy consumption. Coal dominates in the eastern EU countries such as Estonia, Poland and Serbia. (The temporal development of gross inland energy consumption can be found in Figure 14 and in annex A6.)

11. Definitions: Solid fuels are fossil fuels covering various types of coal and solid products derived from coal. They consist of carbonised vegetable matter and usually have the physical appearance of a black or brown rock. Total petroleum products are fossil fuels (usually in liquid state) and include crude oil and all products derived from it (e.g. when processed in oil refineries), including motor gasoline, diesel oil, fuel oil, etc. Gas includes mostly natural gas and derived gases. Renewable energie s are energy sources that replenish (or renew) themselves naturally, such as solar, wind, hydro, geothermal, biomass and renewable wastes, etc. Nuclear heat is the thermal energy produced in a nuclear power plant (nuclear energy). It is obtained from the nuclear fission of atoms, usually of uranium and plutonium.

Figure 4 shows the composition of theses primary energy carriers in 2016 for the EU-28.

11

Figure 5: National shares of fuels in gross inland energy consumption in 2016.

(10)

18 19

Figure 6: Primary energy production in 2016 by resource.

Figure 7: Primary energy production in EJ (10

18

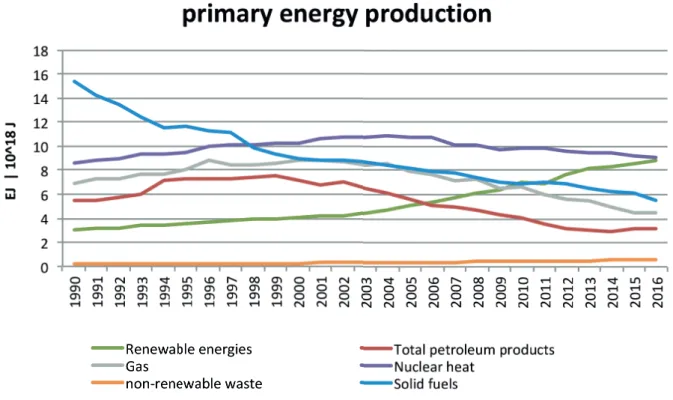
J) of the EU-28 from 1990 until 2016.

The temporal development of EU’s primary energy production from 1990 to 2016 (Figure 7) reveals that nuclear energy production remained relatively constant.

Fossil energy sources such as gas, solid fuels and total petroleum products decreased during this period, while primary energy production of RE increased signifi cantly.

However, overall primary energy production is declining.

This reduction goes hand in hand with an increase in imports of primary energy and energy products making EU-28 more dependent on politically unstable regions. (The temporal development of the fi nal energy consumption can be found in the annex A7.)

Electricity

In 2016, a total amount of 3.1 million gigawatt hours

13

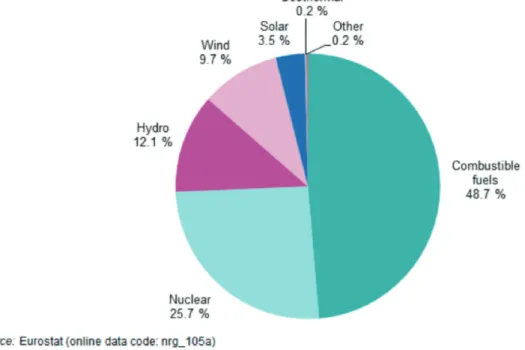
(GWh) net electricity was generated in the European Union. Within the last 10 years the net electricity generation fl uctuated slightly between 3.2 and 3.03 million GWh (2014) but has increased slightly but steadily since 2014. Figure 8 shows that almost 50% of the generated electricity comes from combustible fuels such as gas and coal. Further 25% of the electricity s generated by

nuclear power plants. A similar share is accounted for by renewable energies. Among these, hydro power is the most important renewable energy source for electricity generation, followed by wind power. Solar energy only accounts for 3.5% of electricity generation. Wind and solar power show the strongest growth rates in the last 10 years, whereas the hydroelectric power contribution remains approximately constant.

12. The equivalent of 31626642 terajoule (TJ) or 31.6 Million TJ is 31 exajoule (EJ) (Eurostat nrg_109a) 13. 1GWh=3.6TJ and 1 EJ=1*10

18

J=1*10

6

TJ Primary energy production

Only 31 EJ

12

of the 68 EJ of energy consumption are produced in the 28 countries of the EU. 62 EJ are imported, 24 EJ are exported. This results in a net import of about 38 EJ, i.e. more than half our primary energy must presently be imported. The imported energy consists

almost exclusively of fossil fuels such as mineral oil, gas and coal. The composition of those primary energy sources that are produced within EU-28 is shown in Figure 6.

Fossil energy sources account for more than 40% of EU’s

primary energy production. After all, nuclear energy is still

about 30% of the energy mix and is therefore of a similar

order of magnitude to RE.

(11)

20 21

Figure 8: Share of net electricity generation by source in the EU-28 in 2016.

Figure 9: Production of electricity by source and country in 2016.

The picture for the individual EU countries is again very diverse. Figure 9 shows the sources of electricity generation in the different countries, sorted by the proportion of fossil fuels. These shares range from over 80% e.g. in Estonia, Poland or the Netherlands to under 10% in France and Sweden. In these two countries, the low share of fossil fuels for electricity production is clearly attributable to

electricity generation from nuclear power. This look at the composition of the sources for electricity generation clearly shows the differences between the energy systems in the European countries and thus the large but very different challenges that have to be overcome in order to turn energy production towards climate-neutral energy systems.

Renewable energies

The share of renewable energies in the energy system has increased signifi cantly since 1990. Whereas in 1990 about 3 EJ of primary energy were generated from RE, this share has tripled by 2016 (Figure 10). In contrast to hydro power, whose share remained almost constant over the entire period, all other RE contributions increased.

Although biomass is a limited resource in Europe, its contribution has increased signifi cantly. In 2016, biomass (e.g. wood, biogas or liquid biofuels) accounted for the largest share of around 60%. Wind and especially PV still contribute only little to the primary production despite their public attention.

Figure 10: Shares of Renewable Energies in primary energy production with time.

(12)

22 23

Figure 11: Share of Renewable Energies in gross fi nal energy consumption in the 28 countries of the EU in 2017.

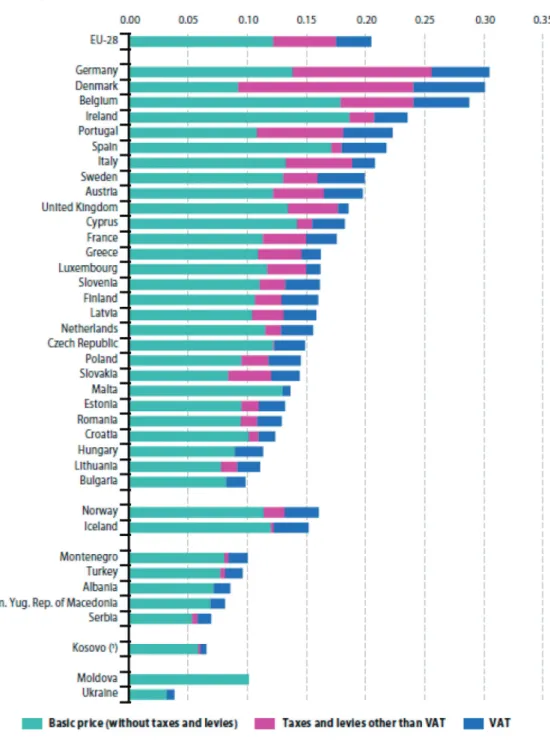
Figure 12: Electricity prices for medium size households

14

in €ct per kWh 2017. (source Eurostat: ten00117) To rapidly increase the share of REs in the energy systems

is in the focus of the EU energy transition policy as well as of that of many individual states. Figure 11 shows the comparison between the actual shares of RE and the target values for 2020 in all EU countries. On average, EU-28 is on the right track and, with a little luck, will reach its 2020 target. The individual countries are very different.

Some countries such as Sweden, Romania or Italy have already reached the target they set themselves, while other countries such as France, but also Germany or Slovenia will only perhaps reach the target. The share itself shows a wide range from over 50% in Sweden to around 10%

in the United Kingdom, or even less in Belgium and the Netherlands. This graph illustrates not only the range of policy objectives, but also the diversity of energy systems in the member countries.

Prices

The differences in the price structure of energy prices in the different countries make it diffi cult to draw a comparison.

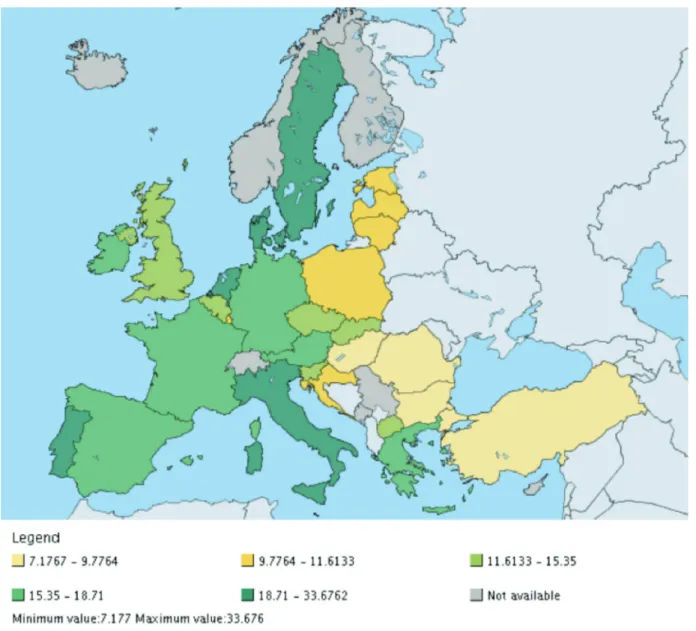
In addition to the different supply and demand conditions of the domestic energy markets, the world market prices, weather conditions, the national energy mix, network costs, but also factors such as environmental protection regulations and not least taxes and levies infl uence the national energy prices. The great variety of prices is illustrated in Figure 12 for electricity prices and Figure 13 for gas prices. Since prices depend on the consumer, this

overview is given for medium size households in the fi rst semester of 2017, as an example. It is noted, that prices are not only of economic origin but are also based on political objectives because they include various taxes and fees and because the structures and goals of subsidies may considerably vary in the different countries.

Electricity is usually cheaper in Eastern Europe than in Western countries. For instance, the prices for the kilowatt hour are 7 €ct in Serbia or 11 to 14 €ct in Poland, Czech Republic and Hungary. But also in the Netherlands, where a large part of the electricity is produced by fossil fuels, the price is only 15 €ct per kWh. On the other hand, high electricity prices can be found in Spain, Denmark or Ireland. Germany occupies the top position with 30 €ct.

Annex A3 shows clearly the different share of taxes and levies that burden the electricity price which – amongst other things – refl ects the different energy systems.

The detailed data also show that overall the prices for electricity were hardly infl uenced by the certifi cate prices for CO

2

emissions via the EU ETS, for example because these certifi cate prices increased signifi cantly in 2018 and 2019 while the electricity prices remained essentially constant.

Gas prices show a similar picture, again referring to households of medium size, price per GJ (Figure 13). Here, Sweden has the highest gas price over 33 € per GJ, and the prices are particularly low in Eastern Europe.

14. Electricity prices for household consumers are defi ned as follows: Average national price in Euro per kWh including taxes and

levies applicable for the fi rst semester of each year for medium size household consumers (Consumption Band Dc with annual

consumption between 2500 and5000 kWh).

(13)

24 25

Figure 13: Gas prices for medium size households

15

in €ct per gigajoule (GJ) in 2017 (source Eurostat: ten00118)

Figure 14: Temporal development of GDP, energy productivity (GDP per gross inland energy consumption), population, primary energy production, gross inland consumption and greenhouse gas emission. (Year 2000=100%). Data taken from https://ec.europa.eu/eurostat/web/energy/data/main-tables)

16

15. Natural gas prices for household consumers are defi ned as follows: Average national price in Euro per GJ including taxes and levies applicable for the fi rst semester of each year for medium size household consumers (Consumption Band D2 with annual consumption between 20 and 200 GJ).

16. 1Mtoe = 1000 000 tonnes of oil equivalent = 4.1868*10

16

J = 11630GWh Energy effi ciency

The development of energy effi ciency and energy savings is considered as one of the important prerequisites for a successful energy transition in the energy policy discourse.

Both measures are regarded as key elements in keeping the necessary conversion of energy production, transmission and supply as low as possible. With the reformulation of the climate and energy policy targets at European level

in 2018 (see chapter 3), a new target has also been formulated for energy effi ciency: It is to be increased by at least 32.5% by 2030. In addition, the formulation of measures from 2014 is still valid: For example, the EU has committed itself to subjecting its own building stock to energy-effi cient refurbishment in the coming years at a rate of 3%. Further effi ciency measures are formulated in areas such as the development of towns and municipalities and in the transport sector.

The gross domestic product (GDP) of the EU-28 has been rising since 2000 with a small reversal of this trend in 2009 (blue curve). In 2016, it amounts to approx. 160% of the value of 2000. For the evaluation of energy intensity and energy productivity, this fi gure is related to primary energy production or gross inland energy consumption. Both primary energy production (black curve) and gross inland energy consumption (red curve) are lower in 2016 than in 2000. However, for gross energy consumption this trend has only been observed since 2010. Energy productivity as a ratio of GDP and gross inland energy consumption is an indicator of how much economic output (gross domestic product) is generated per unit of energy used. It is thus a measure of energy effi ciency. Figure 14 shows an increase in energy productivity from 2005 onwards (orange curve).

The political demand of decoupling economic growth from energy consumption has thus been met.

Various reasons can be suggested for the observed increase in effi ciency. The increased use of more effi cient energy conversion paths in energy generation, for example through an increased effi ciency in fuel use or an increased use of cogeneration of heat and power, certainly have contributed. But also the general change from an industrial to a service-oriented economy, the change from energy- intensive industry to production methods with lower energy input or the use of applications with higher energy effi ciency may have contributed to this increase in energy productivity.

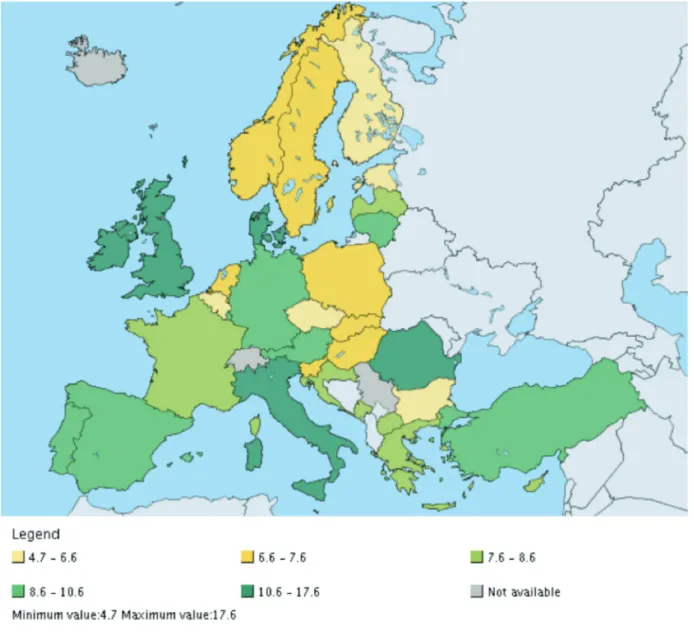
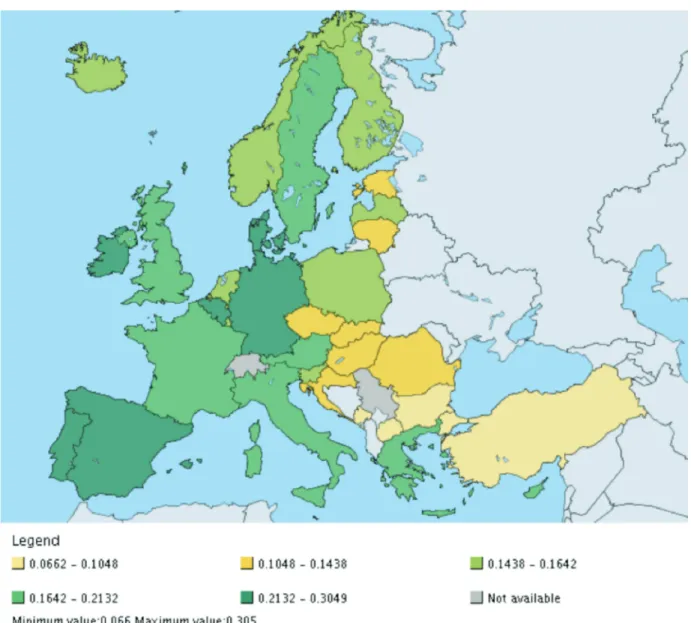
The increase in energy productivity and the changed energy mix (see discussion of primary energy production) are important drivers for reducing greenhouse gas emissions in the EU (green curve in Figure 14). Figure 15 shows the wide dispersion of energy productivity values for 2017 in EU-28, ranging from 17.6 PPS/kgOE in Ireland The energy effi ciency situation is characterised by a number

of indicators such as primary energy consumption, energy productivity or energy intensity. The diffi culty in describing the effi ciency situation is not only the generation of proper indicators that reveal important developments when looking at a long time series. Often also the interpretation

of interdependencies remains insuffi cient. Statistical effects

and, for example, changing compositions such as the

electricity mix over time or economics make it diffi cult

to derive statements. Figure 14 nevertheless shows the

temporal development of important indicators.

(14)

26 27

17. This indicator, which is slightly differently defi ned as that of Figure 14, measures the amount of economic output that is produced per unit of gross inland energy consumption. The economic output is either given in the unit of Euros in chain-linked volumes to the reference year 2010 at 2010 exchange rates or in the unit PPS (Purchasing Power Standard). The former is used to observe the evolution over time for a specifi c region while the latter allows comparing Member States in a given year.

on the one hand to just over 5 PPS/kgOE in Estonia or Serbia on the other. In addition to factors such as the country-specifi c weather in winter, the indicator shows

most of all the different compositions of industry between the various countries.

Figure 15: Energy productivity

17

(in PPS/kgOE) in the EU-28 in 2017. Source: https://ec.europa.eu/eurostat/tgm/

mapToolClosed.do?tab=map&init=1&plugin=1&language=en&pcode=sdg_07_30&toolbox=legend

4. Vision of the EU

and the European Commission

In November 2010 the European Commission announced the fi rst major EU energy strategy, the so- called “2020 Energy Strategy”. Its 20-20-20 targets (reduction of greenhouse gas emissions by at least 20%, increase of share of renewable energies by at least 20%, and energy savings of more than 20% until 2020) will essentially be achieved. Since then the warning messages from climate researchers concerning global temperature rise and steeply increasing greenhouse gas emissions were strongly intensifi ed.

In October 2014 the European Council has reacted on this development by agreeing on a new 2030 Framework for Climate and Energy with new, more ambitious targets:

• 40% cut of greenhouse gas emissions compared to 1990 levels

• at least 27% share of renewable energy consumption

• an indicative target for the improvement in energy effi ciency at EU level of at least 27% (compared to projections), to be reviewed by 2020

• support of the completion of the internal energy market by achieving the existing electricity interconnection target of 10% by 2020, with a view to reaching 15%

by 2030.

In parallel the United Nations Framework Convention on Climate Change (COP 21 in Paris 2015) and its subsequent conferences have postulated to take measures to limit the temperature rise to at most 2°, better 1.5°, compared to pre-industrial values. Supported by an ad-hoc IPCC report (June 2018), the very recent COP 24 conference in Katowice (December 2018) has strongly confi rmed this 1.5° goal and has agreed on a concrete list of measures.

As consequence the European Commission has intensifi ed its efforts: a vision for 2050 has been announced (Nov 2018), new transition targets have been set (June 2018), and new governance regulations for the Energy Union and new (recast) Directives of the Clean Energy Package (Dec 2018, January 2019) have been communicated.

The presented vision is to “achieve climate neutrality by 2050, through a fair transition encompassing all sectors of the economy”. This major goal of the climate policy shall be reached by the EU 2050 long term strategy [https://ec.europa.eu/clima/policies/strategies/2050].

Some of the new energy transition targets for 2030

on which the EU agreed in June 2018 and which are presently valid for the EU overall are slightly more ambitious than the above sketched 2030 goals of 2014, for example:

• share of renewable energies in the total fi nal energy consumption of at least 32%,

• increase of energy effi ciency of at least 32.5%,

• reduction of greenhouse gases by 45% as compared to 1990.

The present EU goals are consistent with the ambitious climate goals of the Paris agreement (COP 21) and the most recent commitments resulting from the COP 24 conference in Katowice. The major question, however, remained unanswered in Paris, Katowice, and by the EU:

how can these goals be reached and how will countries step up and reach their individual targets on cutting emissions, because the present targets and measures would lead to a global warming of unacceptable 3°. This question is also of utmost importance for the EU since the member states had earlier agreed that no binding targets for individual member states have or will be established by EU Commission or Parliament. Thus the EU has no tool for direct impact by laws, decrees, and/

or sanctions.

The solution of this “toothless tiger” problem is tackled by the so-called Winter Energy Package launched in November 2016, the most important part of which is the Governance Regulation of the Energy Union. The last version of this Governance Regulation was debated and voted by the European Parliament in November 2018 and entered into force as from 24 December 2018; it is now central part of the “Clean energy for all Europeans”

package (“Winter Package”). This legislative act establishes the framework for cooperation and coordination on energy and climate matters and represents the umbrella piece of legislation that is intended to ensure the achievement of the 2030 energy and climate targets.

Amongst the most important parts of the Governance Regulation are:

• Streamlining the plethora of current planning,

reporting and monitoring obligations which severely

lack coherence and consistency and can lead to

duplication and confl ict. The regulation integrates 31

existing obligations and deletes another 23. A Climate

Monitoring Mechanism that has been integrated in this

framework is a very important obligation.

(15)

28 29

• Updating the current energy and climate goals from the 2020 to the 2030 targets, while also incorporating the EU commitments under the UNFCCC 2015 Paris Climate Change Agreement (see above).

• The requirement for governments to produce Integrated National Energy and Climate Plans (NECPs). These plans must elaborate on the main priorities, strategies and actions to be taken within a 10-year period, covering the fi ve main areas of the Energy Union (security of supply, internal energy market, energy effi ciency, decarbonisation, and research and innovation). The plans have to also include a 50-year perspective and must be aligned with the international climate goals. Although the governance regulation also provides binding templates for these national plans, it simultaneously allows the member states a great deal of fl exibility in deciding what measures and policies they want to adopt.

In practice, each EU Member State was obliged to draft an integrated National Energy and Climate Plan (NECP) by 1 January 2019 covering the period 2021 – 2030. These drafts have been submitted and can be read and downloaded (https://ec.europa.eu/energy/en/topics/energy-strategy- and-energy-union/governance-energy-union/national- energy-climate-plans). The Commission presently checks that all member states are contributing to a shared effort, that there are no instances of free-riding, and that the collective EU objectives are met. If a NECP is insuffi cient in this sense the Commission will communicate the defi ciency and will give recommendations for improvement which should be incorporated in the fi nalized NECP which is due by January 2020.

From 2021, each country has to produce a progress report every two years (fi rst due by end of 2022), which will complement the Commission’s evaluation of the implementation of the national plans. Member states are obliged to take into account the recommendations of the Commission and must provide explanations in their subsequent progress reports on how these have been incorporated. This double monitoring process is designed to overcome the diffi culties created by the absence of binding national targets.

The future development will show whether these new governance regulations including NECPs and public monitoring are suffi cient to reach the above-mentioned ambitious goals because direct sanctions are excluded due to the dominance of national sovereignty in energy matters. Of course, there are several indirect measures to stimulate the national willingness for meeting the targets, for instance additional fi nancial support for those states that reached the targets and followed the recommendations, or indirect sanctions (reduction of support from, e.g., the structural fund or other subsidies) in the opposite case.

The main problem, however, remains: European diversity.

The initial situation of the energy systems and the present

energy mix in the member states are extremely different, as described in chapter 3. And even more important, the objectives and instruments of the energy transitions in the member states are also very different as sketched in chapter 5. One crucial example may elucidate this statement: the so-called CO

2

price.

Europe has in principle an effective common instrument to reduce CO

2

emissions, the EU Emissions Trading System (EU ETS), established in 2005. The EU ETS works on the ‘cap and trade’ principle. A cap is set on the total amount of certain greenhouse gases that can be emitted by installations covered by the system. The cap is reduced over time so that total emissions fall. Within the cap, companies receive or buy emission allowances which they can trade with one another as needed. They can also buy limited amounts of international credits from emission- saving projects around the world. The limit on the total number of allowances (certifi cates) available ensures that they have a value. After each year a company must surrender enough allowances to cover all its emissions, otherwise heavy fi nes are imposed. If a company reduces its emissions, it can keep the spare allowances to cover its future needs or else sell them to another company that is short of allowances. Trading brings fl exibility that ensures emissions are cut where it costs least to do so. A robust CO

2

price also promotes investment in clean, low-carbon technologies.

The problem of the present EU ETS is at least two- fold. First, EU ETS covers only 45% of all emitters of greenhouse gases which is insuffi cient for the necessary sector-overarching optimization of the entire energy system. And second, the initial number of certifi cates was much too high such that the CO

2

price was way too low. After a settling time, it remained at about 5 Euro per ton CO

2

for several years while experts agreed that only a price beyond 30 – 40 Euro would be successful in signifi cantly reducing greenhouse gases. A recent reform effort has led to a signifi cant price increase in 2018 (from 8 to 25 Euro/t in Dec 2018) but the price is still too low and especially too volatile, and hence does not stimulate major investments.

Several member states thus have established a national CO

2

price as additional CO

2

tax or as lower limit for a national ETS that includes but extends the EU ETS.

Member states like Sweden, Great Britain, or France have launched their national CO

2

prices several years ago and claim signifi cant successes, but prices, detailed rules, and exemptions are very different. However, most other states abstained from such tax-like instruments and appear to object against major changes to the EU ETS.

5. Energy transitions in Europe

28 different historical developments under different conditions created 28 different energy systems, which satisfy the different energy needs of the various countries, their inhabitants and economic systems. Thus, also 28 different energy transitions have been started which proceed with different speed and success. In order to give some impression about the diversity of the various national approaches, six examples of energy systems and energy transitions (France, Germany, Serbia, Slovenia, Spain and Sweden) are presented in the following. These short essays show that even if the objectives of the European energy system transformation are formulated jointly by the EU, the way to achieve them will and must be very different.

In the following the energy systems and transition approaches of these six countries (in alphabetical order) are briefl y sketched focused on two objectives:

A: Purposes, objectives and instruments of the energy transitions and B: Successes and obstacles for the success of the individual energy transitions.

5.1 France

A: Purposes, objectives and instruments of the energy transitions

The French energy transition is generally called

“Transition énergétique” (“energy transition”) and aims at a transformation of the French energy system. The French energy policy principles are defi ned by a law voted by parliament in August 2015, called LTECV (Loi de Transition énergétique pour une croissance verte - Transition Law for Green Growth). The law provides for the development of a National Low Carbon Strategy (SNBC Stratégie nationale bas-carbone), France’s roadmap for reducing greenhouse gas emissions. It also sets the parameters for the Multiannual Energy Programming (PPE = “Programmation Pluriannuelle de l’Energie”), reviewed every 5 years for setting policies for the next 5 years (2019-2023) and for looking at the 5-year horizon thereafter (2024-2028). The fi rst PPE period was 2016-2018.

PPE is a tool for steering France’s energy policy. All the pillars of energy and energy policy are covered. The PPE thus includes several components:

• security of supply;

• the reduction in energy consumption, particularly of fossil origin (oil, gas, coal);

• diversifying the energy mix by mobilising renewable energies and reducing the share of nuclear energy;

• the balanced development of networks;

• preserving the purchasing power of consumers and the competitiveness of businesses;

• assessment of needs of professional skills in the fi eld of energy and appropriate training.

For defi ning the 2019-2023 PPE, the French population was called to participate in a public debate organised by the statutory independent national commission (CNDP), the result of which have been published in September 2018. The French government has issued the orientations, which, after a further step of consultation of the French people, should be transformed into an offi cial decree. A major announcement by the French President and Government was issued in November 2018. Twenty objectives have been set, organized around 7 major themes: energy production, buildings, transport, agriculture, industry, waste, and forestry and carbon sinks.

Buildings

2.5 million renovated homes; 10,000 coal heaters and 1 million fuel oil-based boilers replaced by renewable energy-based heating or high-performance gas; 9.5 million wood-heated homes with a labelled device; 3.4 million homes connected to a heat network.

Transport

1.2 million electric passenger cars; 20,000 gas trucks in circulation; Launch of an industrial strategy for electric vehicles (batteries).

Energy Overall targets

The need to reduce energy consumption in all sectors

is reaffi rmed (an overall target to reduce fi nal energy

demand by 7% in 2023 and 14% in 2028 compared to

the 2012 reference year). Primary energy consumption

of fossil fuels in France should be reduced by 20% in

2023 and 35% in 2028 compared to the 2012 reference

year. Carbon taxation is expected to be introduced while

(16)

30 31

the modalities and objectives for the next periods of the EU scheme (Energy Saving Certifi cates) will have to be defi ned by the beginning of 2020.

Renewable energy

• The LTECV provides for an increase in the share of renewable energies in fi nal energy consumption to 32%

by 2030. The new PPE confi rms those vector-based targets for this horizon (40% renewables in electricity production, 38% in fi nal heat consumption, 15% in fi nal fuel consumption and 10% in gas consumption).

• Among its main objectives, the PPE stipulates to at least double renewable electricity capacity in metropolitan France by the end of 2028, to a level between 102 and 113 GW (compared to 48.6 GW at the end of 2017).

- By 2030, the production of onshore wind farms will thus triple.

- By 2030 the amount of energy produced from photovoltaics will be multiplied by 5.

- Off shore wind farms: During the PPE’ fi ve-year period, the fi rst park off Saint-Nazaire will be commissioned and 4 new calls for tenders will be launched.

- This would lead to the following status in 2023-2028

GW 2023 2028

on shore wind 24,6 31,4 - 35,6

off shore wind 2,4 4,7 - 5,2

Solar PV 20,6 35,6 - 44,5

Methanisation 0,27 0,34 - 0,41

Hydro 25,7 26,4 - 26,7

Total 74 102 - 113

In terms of heat production, the government plans to reinforce the Heat Fund (substitution of coal by biomass), with a budget increase from €245 million in 2018 to

€315 million in 2019 and to €350 million in 2020. By 2028, the annual production of “renewable” gas, mainly via methanisation, is to be increased by a factor of 5 compared to the 2017 level.

Fossil energy

Closure of all coal-fi red plants by 2022

Nuclear energy

• Maintain the 50% target of electricity supplied by nuclear, but by extending the maturity date to 2035 (instead of 2025 as provided for in LTECV).

• As part of the Multiannual Energy Programming, the government should decide in 2021/22 whether to replace aging reactors with a new nuclear power

programme. In the meantime, EDF is developing the design of an improved – essentially more competitive – EPR design.

So far, the targeted electrical mix includes 50% of nuclear generation in 2035; no decision has been taken beyond this date. It is generally considered that the goal of achieving carbon neutrality in 2050, which will be part of the French energy law, requires keeping a share of nuclear electricity in the mix.

B: Successes and obstacles for the success of the individual energy transitions

Thanks to the reduction of coal, oil and gas for electricity production and the large increase of nuclear power since the early 1980s, see left-hand fi gure below from https://

jancovici.com/transition-energetique/series-longues/

france/, calculation by Jean-Paul Janivici from BP Statistical Review data, French emissions of CO2 have been drastically reduced.

A major diffi culty of the French energy transition is the perspective of simultaneously reducing CO

2

emissions and the share of nuclear electricity. Although French emissions of CO

2

per capita are low compared to other large EU countries (only about 50% of Germany’s per capita emissions in 2014, see right-hand fi gure above from http://www.tsp-data-portal.org/about), the French target ratio for reduction agreed for 2020 compared to 2005 is identical to that of Germany (-10% for Europe and -14%

for France and Germany for instance). CO

2

emission of power generation in France is only 10% of German emission per KWH supplied. As a consequence, the impact of developing intermittent renewable electricity on the global CO

2

emission from power generation is very low.

A second one is in the social acceptance of the transition, notably as people’s life-styles and resources are becoming increasingly different between larger cities and the rest of the country. There are in France a lot of controversies on the best way to achieve the aimed-for CO

2

reduction. In order to have better advice, the French President established the High Council for Climate, composed of experts (13 scientists, economists and other experts, chaired by the French-Canadian climate scientist Corinne Le Quéré) that will produce each year an «independent perspective»

on France’s policy in the fi ght against climate change. The High Council’s annual report will assess, «compliance with the greenhouse gas emissions reduction trajectory»

and the implementation of measures to reduce these emissions. However, despite numerous announcements of ambitious long-term objectives and in contradiction with its international commitments, European regulations and French law, France does not respect its short-term objectives, whether in terms of reduction of greenhouse gases, development of renewable energies or improving energy effi ciency, even when measures have been implemented that were identifi ed as essential for the ecological and solidarity transition.

Greenhouse gases

• The revised SNBC draft published in December 2018 states that «France will not be able to meet the fi rst 2015-2018 carbon budget» and provisionally estimates this overrun to 72 Mt CO

2

eq over the period 2015- 2018. The SNBC project takes accounts of this overrun by in-creasing the carbon budgets until 2023, postponing a large part of the effort to coming years even though France has the long-term objective of achieving GHG neutrality by 2050.

• It is worth noting the objectives for greenhouse gas reductions are mainly exceeded in the transport sectors, in the buildings sector, and in the agricultural sector.

Development of renewable energies

• The target for 2017 of the renewable energy plan was for gross fi nal RE of 30.7 Mtoe. With 25.5 Mtoe

18

achieved, it is 17% below target. This falling behind in France’s response to renewable energy is almost unique within the European Union. Eurostat notes the fact that only 4 EU countries, including France, were below “the 2015-16 average of the indicative trajectory established in the Renewable Energy Directive”.

Energy effi ciency

• France is not meeting the 2017 objectives of the EPP118 or its trajectory for the 2020 objectives under the European Directive. Eurostat noted that French fi nal energy consump-tion amounted to 147.1 Mtoe in 2017, about 5% higher than the 139.9 Mtoe trajectory provided for under the Directive and will not achieve the 2020 target of 131.4 Mtoe

18. 1 Mtoe = 4.1868*10

16

J = 11630GWh

(17)

32 33

The reasons for this underachievement are certainly manifold but they have not been analysed in a single document. Among other elements, the Académie des sciences and NATF have recommended:

• Financing of RE for electricity production (mainly PV and wind), in spite of French electricity being already decarbonized at 95%, should be curtailed and the available financing be used for more efficient decarbonisation of the construction and transport sectors.

• REN should be developed for heat applications, transport and construction sectors.

• In order to identify priorities, it should be mandatory to assess the cost and effect on public finances, the trade balance, CO

2

emissions and employment (both in terms of jobs and qualifications created), and this should be done in comparison with other alternatives.

In the near and medium term, there is a real contradiction in wanting to reduce greenhouse gas emissions while at the same time reducing the share of nuclear power.

5.2 Germany

A: Purposes, objectives and instruments of the energy transitions

The German energy transition is generally called

“Energiewende” (“energy turn-around”) and aims at a complete change of the German energy system. Most of its present targets were set by the Government in September 2010. They are essentially still valid today apart from the accelerated phase-out of nuclear power which was decided in autumn 2011 after the nuclear disaster following the earthquake and tsunami consequences in Fukushima. More recently the German targets were essentially confirmed following the Paris agreement in 2015 – though using different target times and hence different (quantitative) numbers.

The main goals are the following:

1) Reduction of the greenhouse gases referred to the emissions of 1990 while keeping the security of supply on the present high level: 2020: - 40%, 2030: -55%, 2040: -70%, 2050: -80 to 95%.

2) Reduction of the primary energy consumption by -50%

in 2050 with respect to 2010.

3) Reduction of the energy consumption in the transport sector by 40% in 2050 (referred to 2010).

4) Reduction of the electricity consumption by 25% in 2050 (referred to 2010).

5) Share of renewable energies in total electricity consumption: 2020: 35%, 2030: 50%, 2040: 65%, 2050:

80%.

6) Share of renewable energies in total final energy consumption: 2020: 18%, 2030: 30%, 2040: 45%, 2050:

60%.

7) T he initial number of nuclear power stations (19) must be reduced stepwise to 9 (2011), 8 (2016), 7 (2018), 6 (2020), 3 (2022), and finally to zero in 2023.

The energy transition is managed by several federal ministries with the Federal Ministry of Economic Affairs and Energy as leading house. This ministry also publishes a monitoring report on an annual basis presenting the development of relevant indicators of the energy transition in relation to the targets. In addition, every three years a progress report is published by this ministry which gives a deeper analysis and allows the observation of trends.

This “self-monitoring” process is critically accompanied by an independent commission of four renowned energy experts from the scientific community who publish their critical assessment alongside with the governmental reports. The monitoring report must be approved by the Federal Cabinet by the end of every year and submitted to the Parliament.

The “Energiewende” is governed and influenced by hundreds of acts, decrees, and other frame conditions including taxes, subsidies, prescriptive limits, etc. Most of these regulations are sector-specific or concern details;

some are effectively counteracting each other. The most prominent act is the Renewable Energy Law (EEG), the first version of which was enacted in 2000 replacing the Act on Sale of Electricity to the Grid (from 1991).

Since then the EEG was corrected, complemented and improved by several amendments, the last (called

“Energiesammelgesetz”) is presently on the way (Nov 2018). As consequence of the Paris Climate Agreement Germany has decided and published in November 2016 the Climate Action Plan 2050. It confirms the above cited targets and moreover sets detailed targets for the energy consumption in the energy sectors electricity, heat consumption, and transport concerning the share of renewables, the reduction in consumption, and the increase in efficiency. All targets and measures are compiled and reconfirmed in the German draft of the integrated national plan for energy and climate (NECP) which was requested by the EU parliament within the framework of the new Governance Regulations in 2018 (see chapter 3) and which was submitted by the end of 2018.

B: Successes and obstacles for the success of the individual energy transitions

The very ambitious German “Energiewende” is successful in only two fields: the phase-out of nuclear power and the share of renewable sources in electricity production are on track. In contrast, all other indicators are behind schedule and will miss the 2020 targets, some by far. For instance, the reduction of greenhouse gas emissions stagnates since 2009 such that the 2020 target will most likely be missed by more than 100 million tons of CO

2

equivalents; thus only 30% instead of 40% reduction from 1990 levels will be reached. Or: the share of renewable energies in the sectors heat and transport remains at much too low levels; for example, in the transport sector it stagnates at 5.3% since 2008. Or: The energy consumption in the electricity and transport sector increased within the last 10 years while it should rather have decreased by 10%

and 20%, respectively.

The reasons for these failures are manifold. They have been analysed by a joint project of the German national academies called Energy Systems of the Future (ESYS) [Ausfelder et al. 2017

1

9; acatech/Leopoldina/

Akademienunion 2017

20

] and can be described as follows:

• The system of laws and regulations is too complex; there are too many counteracting formalities; many regulations had unforeseen consequences.

• The EEG laws and their amendments are presently setting the wrong, insufficient, and incomplete incentives;

they should rapidly be replaced or drastically improved.

• The different energy carriers are treated differently concerning taxes and dues; for example, electricity is much too expensive for consumers (see chapter 2) and industry, thus obstructing, e.g., the required switch to heat pumps for low-temperature heating and the exploration of Power-to-X techniques.

• The present, completely separate treatment of the energy sectors electricity, heat consumption and transport impede the necessary holistic approach and optimization of an integrated energy system. It also impedes the required electrification of the sectors heat consumption and transport.

• A common price for all CO

2

emissions and hence an over-arching instrument with comprehensive steering action is lacking. The existing instrument, the European Emissions Trading System (EU ETS), is ineffective since a lower bound for the CO

2

price is missing and sources

emitting more than half of the European CO

2

emissions are not included. Moreover, the present CO

2

price of EU ETS is still too low (about 25 € per ton) and it is highly volatile since it is based on speculations (see also chapter 3).

• Present costs (additional 25 billion € per year) and missing achievements of the energy transition do not fit together; moreover, communication and participation are insufficient. Thus, citizens and industry are increasingly disappointed, the acceptance of the energy transition suffers, and new projects (e.g. wind power stations, overhead transmission lines) experience increasing resistance.

• Government and the majority of the society have no vision for the necessary changes and feel not sufficiently responsible to meet the grand challenges. The missing political will and the hence missing long-term legal perspective lead to insufficient planning reliability and prohibit the necessary investments.

• Thus, many decisions are either delayed or go in the wrong direction because the proper legal frame is not yet existing.

• There is insufficient cooperation and consultation on energy issues with the European partners; more efficient solutions are hence prohibited and frustration amongst the European countries is enhanced.

• A continuation of the present development may lead to a significant failure of the “Energiewende”. Recent developments (“Coal Commission”) and the additional commitments enforced by the new Governance Regulations (see chapter 3) as well as public criticism on the missing progress of the energy transition (“Friday demonstrations”) may lead to enforced, more target- oriented actions of the federal government.

The most recent conclusion is that the German

“Energiewende” can still be successful and the ambitious targets until 2040 and 2050 can still be met if suitable measures are quickly and efficiently introduced. This has been analyzed in detail by a project of the German national academies (https://energiesysteme-zukunft.de/

en/publications/position-paper/coupling-the-different- energy-sectors/).

19. Ausfelder et al. 2017: Ausfelder, F./Drake, F.-D./Erlach, B./Fischedick, M./Henning, H.-M./Kost, C./Münch, W./Pittel, K./Rehtanz, C./

Sauer, J./Schätzler, K./Stephanos, C./Themann, M./Umbach, E./Wagemann, K./Wagner, H.-J./Wagner, U.: »Sektorkopplung« – Untersuchungen und Überlegungen zur Entwicklung eines integrierten Energiesystems (Schriftenreihe Energiesysteme der Zukunft), München 2017.

20. acatech/Leopoldina/Akademienunion 2017: acatech – Deutsche Akademie der Technikwissenschaften, Nationale Akademie der

Wissenschaften Leopoldina, Union der deutschen Akademien der Wissenschaften (Hrsg.): »Sektorkopplung« – Optionen für die

nächste Phase der Energiewende (Schriftenreihe zur wissenschaftsbasierten Politikberatung), 2017.

Abbildung

Figure 3:  Share of greenhouse gas emissions by IPCC source sector: Eurostat (env_air_gge), https://ec.europa.eu/
Figure 4:  Gross inland energy consumption by resource in the EU 18 in 2016.
Figure 6:  Primary energy production in 2016 by resource.
Figure 8: Share of net electricity generation by source in the EU-28 in 2016.
+7

Referenzen

ÄHNLICHE DOKUMENTE

The optimization of transport infrastructure as such is not a clearly defined process. Besides the optimization criteria - this report demonstrates both economic and energy-

Based on an analysis of a nationally representative cross-sectional rural household survey and historical aggregate statistics, we show that residential energy consumption in

4A, B Concentrations of ATP, ADP, AMP and & Ade, the ratio of the levels of phospho- L -arginine over the sum of the concentra- tions of PLA and L -arginine (A) and the levels

Before issuing a decision concerning the approval or refusal of a tariff the URE President is obliged to exhaustively collect and examine all material evidence (compare Article 77 §

MATERIALS DEMAND ENERGY RESOURCES PRODUCTION LARGE SCALE MINING WATER RESOURCES \I ENERGY CONTENTI FIGURE 5... ENERGY RESERVES PER CAPITA (in tce,or toe, or kwh ,etc; or in

Evidence of links between trust levels & level of engagement with energy It also seems that at least some groups of consumers who are more likely to trust their energy
And what stance should the European Union take towards Putin in a context where Mos- cow is a strategic partner for resolving international crises in other arenas, energy

• The German term Energiewende (energy transition) refers to a fundamental transition to a decarbonized energy system mainly based on variable renewable energy