NBER WORKING PAPER SERIES
INTERGENERATIONAL MOBILITY IN AFRICA Alberto Alesina
Sebastian Hohmann Stelios Michalopoulos
Elias Papaioannou Working Paper 25534
http://www.nber.org/papers/w25534
NATIONAL BUREAU OF ECONOMIC RESEARCH 1050 Massachusetts Avenue
Cambridge, MA 02138
February 2019, Revised August 2020
We are grateful to three anonymous referees, and the editor Fabrizio Zilibotti, for extremely useful comments. Also, we thank our discussants in various conferences Oriana Bandiera, Sara Lowes, and Nathaniel Hendren as well as to Francesco Caselli, Raj Chetty, and Antonio Ciccone for detailed comments. We are thankful for useful discussions and feedback to James Fenske, Larry Katz, Nathan Nunn, David Weil, Elisa Cavatorta, Shaun Hargreaves, Jim Robinson, Sam Asher, Paul Novosad, Charlie Rafkin, and Yining Geng. We also got useful feedback from conference and seminar participants at the University of Zurich, UPF, Monash University, Warwick, Brown, Harvard, King's College, Tufts, Copenhagen, Sheffield, Williams, the NBER Summer Institute, and the PSE Conference on Culture, Institutions, and Economic Prosperity. We also thank Remi Jedwab, Adam Storeygard, Julia Cagé, Valeria Rueda and Nathan Nunn for sharing their data. Papaioannou gratefully acknowledges financial support from the European Research Council (Consolidator Grant ORDINARY), LBS Wheeler Institute for Business and Development, and RAMD. All errors and omissions are our responsibility. The views expressed herein are those of the authors and do not necessarily reflect the views of the National Bureau of Economic Research.
NBER working papers are circulated for discussion and comment purposes. They have not been peer-reviewed or been subject to the review by the NBER Board of Directors that accompanies official NBER publications.
© 2019 by Alberto Alesina, Sebastian Hohmann, Stelios Michalopoulos, and Elias Papaioannou.
All rights reserved. Short sections of text, not to exceed two paragraphs, may be quoted without
explicit permission provided that full credit, including © notice, is given to the source.
Intergenerational Mobility in Africa
Alberto Alesina, Sebastian Hohmann, Stelios Michalopoulos, and Elias Papaioannou NBER Working Paper No. 25534
February 2019, Revised August 2020
JEL No. I24,J62,P16
ABSTRACT
We examine intergenerational mobility (IM) in educational attainment in Africa since independence using census data. First, we map IM across 27 countries and more than 2,800 regions, documenting wide cross-country and especially within-country heterogeneity. Inertia looms large as differences in the literacy of the old generation explain about half of the observed spatial disparities in IM. The rural-urban divide is substantial. Though conspicuous in some countries, there is no evidence of systematic gender gaps in IM. Second, we characterize the geography of IM, finding that colonial investments in railroads and Christian missions, as well as proximity to capitals and the coastline are the strongest correlates. Third, we ask whether the regional differences in mobility reflect spatial sorting or their independent role. To isolate the two, we focus on children whose families moved when they were young. Comparing siblings, looking at moves triggered by displacement shocks, and using historical migrations to predict moving-families' destinations, we establish that, while selection is considerable, regional exposure effects are at play. An extra year spent in a high-mobility region before the age of 12 (and after 5) significantly raises the likelihood for children of uneducated parents to complete primary school. Overall, the evidence suggests that geographic and historical factors laid the seeds for spatial disparities in IM that are cemented by sorting and the independent impact of regions.
Alberto Alesina
Department of Economics Harvard University Littauer Center 210 Cambridge, MA 02138 and IGIER
N/A user is deceased Sebastian Hohmann
Stockholm School of Economics SITE Sveavagen 65
Box 6501 SE 113 83 Stockholm Sweden
sebas.hohmann@gmail.com
Stelios Michalopoulos Brown University
Department of Economics 64 Waterman Street Providence, RI 02912 and CEPR
and also NBER smichalo@brown.edu Elias Papaioannou
London Business School Regent's Park
Sussex Place London NW1 4SA United Kingdom and CEPR
papaioannou.elias@gmail.com
A
nonline appendix is available at http://www.nber.org/data-appendix/w25534
1 Introduction
There is rising optimism about Africa, a continent with 1.2 billion opportunities, as the Economist (2016) touted not long ago. The formerly “hopeless continent” is gradually becoming the “hopeful” one (Economist (2000, 2011)). Educational attainment is rising, health is improving, and the income of many Africans is growing. Some even speak of an African “growth miracle” (Young (2012)). However, anecdotal evidence indicates widespread inequalities, uneven progress, and poverty traps, suggesting that the “miracle”
may not be for all. A comprehensive assessment is lacking.
We take the first step toward mapping, exploring, and explaining intergenerational mobility across the continent. We look at educational attainment using census data cov- ering more than 16 million individuals across 27 African countries and 2,846 regions.
Reconstructing the joint distribution of parental and offspring education since the 1960s, when most of Africa becomes independent, allows us to shed light on a variety of ques- tions. Where is the land of educational opportunity? Are differences in intergenerational mobility across countries and regions small, moderate, or wide? How large are gender disparities? How big is the rural-urban gap? Which elements of a region’s history and ge- ography correlate with educational mobility? Do regions matter for mobility or do districts with higher mobility attract families more eager to climb the social ladder?
1.1 Results Preview
In the first part of the paper, we compile new country and regional-level measures of educational opportunity. As recent works on intergenerational mobility in income (e.g., Chetty et al. (2017)) and education (Card, Domnisoru, and Taylor (2018)), we construct measures of absolute upward intergenerational mobility (IM) defined as the likelihood that children born to parents that have not completed primary schooling manage to do so.
Similarly, we map absolute downward mobility, defined as the likelihood that the offspring of parents with completed primary education fail to do so. To account for “selection on cohabitation”, we focus on ages between 14 and 18, as in this age range children have largely finished primary school and still reside with parents or older relatives.
We document large cross-country differences in upward and downward mobility. The likelihood that children born to parents with no education complete primary schooling exceeds 70% in South Africa and Botswana; the corresponding statistic in Sudan, Ethiopia, Mozambique, Burkina Faso, Guinea, and Malawi hovers below 20%. Most importantly, there is substantial within-country variation. In Kenya, a country with a close-to-average upward IM of 50%, the likelihood that children of illiterate parents will complete primary education ranges from 5% (in the Turkana region in the Northwest) to 85% (in Westlands in Nairobi). Upward IM is higher in urban as compared to rural areas. While there is a gender gap in educational levels, intergenerational mobility is, on average, similar for boys and girls, though there is a non-negligible gender gap in the Sahel and North Africa.
Spatial disparities in mobility exhibit inertia: Upward IM is higher in countries and regions with higher literacy among the old. Variation in the latter accounts for roughly half of the observed IM variability. Downward mobility is also linked to the literacy of the old generation, but the association is weaker.
In the second part of the paper, we characterize the geography of IM in Africa by looking at geographical and historical variables that have been linked to regional develop- ment. Upward IM is higher and downward IM is lower in regions close to the coast and the capital, with rugged terrains and low malaria. Among the historical legacies, colonial transportation investments and missionary activity are the strongest correlates of mobil- ity. These correlations are present when we exploit within-province variation and when we estimate LASSO to account for multicollinearity and measurement error. While these as- sociations do not identify causal effects, they suggest how historical contingencies, related to colonization and geography, have influenced not only initial conditions (the literacy of the old generation) but also the trajectories of regional economies.
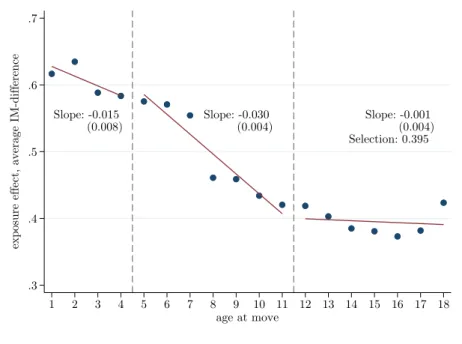
The observed differences in regional IM may be the result of two forces. On the one hand, regions may exert a causal impact on mobility, for example, providing higher- quality infrastructure, more and better schools. On the other hand, there may be sorting, as families with higher ability and/or valuation of education move to areas with better opportunities. In the third part, we assess the relative magnitudes of these two factors employing the approach of Chetty and Hendren (2018a). The methodology exploits differ- ences in the age at which children of migrant households move to distinguish “selection”
from “regional childhood exposure effects.” Both forces are at play. Selection is present;
families’ sorting into better (worse) locations correlates strongly with child attainment.
The analysis also uncovers sizable “regional exposure effects” both for boys and girls. An additional year in the higher mobility region before the age of 12, and especially between 5−11, increases the likelihood that children of households without any education manage to complete primary schooling.
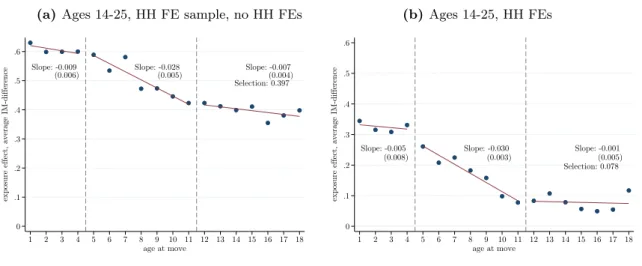
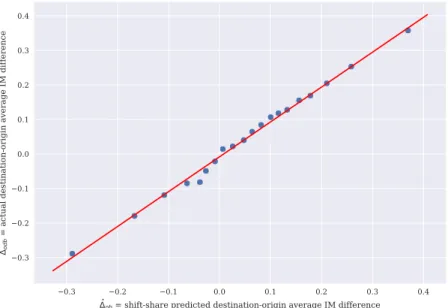
To advance on the identification of regional exposure effects, we conduct three exercises, separately and jointly. First, we explore whether the educational attainment of siblings whose family moved is proportional to their age difference interacted with differences in mobility between the permanent residents in origin and destination districts. The regional childhood exposure estimates from the household-fixed-effects specifications are similar to the baseline ones. Second, we look at moves taking place in periods of abnormal outflows, as these likely reflect displacement shocks exogenous to households. We continue finding considerable regional exposure effects for moving children in the critical-for-primary schooling age (5−11) and somewhat smaller before 5. Third, we use historical migration to project -and account for- households’ endogenous destination choice. The regional childhood exposure estimates remain significant.
Overall, the analysis suggests that the vast spatial differences in mobility reflect both sorting and regional exposure effects. The uncovered inertia, coupled with the strong association between mobility (and old’s literacy) with historical and geographic traits, suggests that these features have shaped regional dynamics post-independence.
1.2 Related Literature
Our work blends two strands of literature that have, thus far, moved in parallel. The first is the growing research studying intergenerational mobility (see Solon (1999) and
Black and Devereux (2011) for reviews).1 Card, Domnisoru, and Taylor (2018) use the US population census of 1940 to map absolute educational mobility looking at children residing with at least one parent. They document rising mobility during the first half of the 20th century, which differs across race and states.2 Chetty et al. (2014) provide a mapping of IM in income across US counties and explore its correlates. Chetty and Hen- dren (2018a,b) use matched parents-children administrative tax records of moving families to isolate the effect of neighborhood exposure on income IM from sorting. Our work re- lates to Asher, Novosad, and Rafkin (2020) and Geng (2018), who also map and study educational mobility across Indian and Chinese regions, respectively. In parallel work, the World Bank compiles measures in intergenerational mobility in education and income for many countries using survey data (Narayan et al. (2018)). Our main contribution to this research is to compile new statistics and characterize the educational mobility for many African countries and regions, distinguishing also between gender and rural-urban residence. Moreover, we estimate regions’ independent influence on mobility, showing at the same time that bidirectional sorting (from higher to lower opportunity regions and vice versa) is considerable.
The second strand is the research on the origins of African development that provides compelling evidence of historical continuity as well as instances of rupture in the evolution of the economy and polity (see Michalopoulos and Papaioannou (2020) for a review). An open question is whether the correlation between deeply rooted factors and current out- comes reflects the one-time effect of the former on initial conditions or if historical shocks have altered the transmission of opportunity across generations. By building data on IM across African regions and exploring its correlates, we begin answering such questions.
Moreover, by isolating the role of regions on mobility from sorting, we start unbundling the mechanisms linking geography-history to contemporary development.
Structure In Section 2, we present the census data on educational attainment and detail the construction of the intergenerational mobility measures. Section 3 describes IM across African countries and regions. Section 4 explores the geographic, historical, and at-independence correlates of educational mobility. In Section 5, we exploit differences in ages-at-move among migrant children to isolate regional childhood exposure effects from sorting. In Section 6, we summarize and discuss avenues for future research.
2 Data and Methods
2.1 Why Education?
We focus on education for several reasons. First, income data are available for a tiny share of the African population and a handful of countries. For instance, Alvaredo et al. (2017) report that for Ghana, Kenya, Tanzania, Nigeria, and Uganda, income data encompass
1Early studies on intergenerational mobility in education include Bowles (1972), Blake (1985), and Spady (1967). Hertz et al. (2008) estimate country-level IM coefficients across 42 countries. Hilger (2017) studies trends in educational IM in the United States over the 20th century, while Chetty et al. (2017) and Davis and Mazumder (2020) study the dynamics of absolute IM in income in the US.
2A strand of the US-focused literature looks at racial differences in mobility (e.g., Chetty et al. (2020b), Davis and Mazumder (2018), Derenoncourt (2018)). These studies relate to our companion work Alesina et al. (2020b,a), where we explore ethnic and religious differences in educational mobility across Africa.
less than 1% of the adult population, while for most African countries tax records do not exist. Moreover, consumption data are noisy and cover small samples. In contrast, education is available at a fine geographic resolution. Second, measurement error in ed- ucational attainment is a lesser concern compared to that of reported income, wealth, or consumption. Third, education is useful in mapping intergenerational mobility, as people tend to complete primary schooling, which is the key educational achievement across most of Africa, by the age of 12−14. Hence, unlike lifetime earnings, the analysis can start when individuals are early in the life cycle. Fourth, parental investment in children’s education is at the heart of theoretical work in intergenerational linkages (e.g., Becker and Tomes (1979), Loury (1981)). Fifth, a voluminous research in labor economics shows that edu- cation causally affects lifetime income (e.g., Card (1999)). Individual returns to schooling are sizable in low-income (African) countries.3 Sixth, in the Appendix (section C.2), using geo-referenced Demographic and Health Surveys (DHS) and Afrobarometer Surveys, we present evidence of a strong correlation between educational attainment and various prox- ies of well-being in Africa, including living conditions, child mortality, attitudes toward domestic violence, political and civic engagement.
2.2 Sample
2.2.1 Countries & Regions
We use individual records, retrieved from 694 national censuses from 27 countries: Benin, Botswana, Burkina Faso, Cameroon, Egypt, Ethiopia, Ghana, Guinea, Kenya, Lesotho, Liberia, Malawi, Mali, Morocco, Mozambique, Nigeria, Rwanda, Senegal, Sierra Leone, South Africa, Sudan, South Sudan, Tanzania, Togo, Uganda, Zambia, and Zimbabwe.
We obtain the data from IPUMS (Integrated Public Use Microdata Series) International, hosted at the University of Minnesota Population Centre, that reports harmonized repre- sentative samples, typically 10%.5 As of 2015, the sample countries were home to about 850 million people, representing around 75 percent of Africa’s population and GDP. IPUMS also reports residence, allowing us to assign individuals to “coarse” and “fine” adminis- trative units. Our sample spans 367 provinces (admin-1) and 2,846 districts (admin-2 or 3 units) of a mean (median) size of 5206 (1578) sqm.6
3Most studies suggest higher returns to education in low income countries, as compared to the “con- sensus” estimate of 6.5%−8.5% in high income countries (e.g., Psacharopoulos (1994), Caselli, Ponticelli, and Rossi (2014)). Young (2012) estimates Mincerian returns of about 11.3% (OLS) to 13.9% (2SLS) across 14 Sub-Saharan African countries using DHS data, higher than in 11 non-SSA low income countries [range of 8.7% (OLS) - 10.4% (2SLS)]. Montenegro and Patrinos (2014) estimate Mincerian returns of about 12.4% in Africa, compared to 9.7% for the rest of the world. Four of the top-5 countries are in Africa. Psacharopoulos and Patrinos (2004) document a mean increase in wages for those with completed primary of 37.6% across 15 Sub-Saharan African countries in the 1980s and 1990s, as compared to 26.5%
for secondary and 27.8% for tertiary.
4We start from 74 censuses. We discard Burkina Faso (1985), Kenya (1979), and Liberia (1974), as they lack identifiers to match children to older relatives. We also remove Togo (1960 and 1970), as they do not cover all regions.
5In Nigeria data come from household surveys conducted in consecutive years between 2006 and 2010.
As the number of observations is small, we aggregate the survey waves and count them as one census-year.
6For Botswana, Lesotho, and Nigeria, IPUMS reports one level of administrative units. In Ghana after 1984, Burkina Faso in 1985, Ethiopia in 1984, Malawi in 1987, and South Africa after 1996, districts change, as administrative boundaries are redrawn. We have harmonized these countries’ boundaries.
2.2.2 Education
IPUMS records education for around 93 million individuals. Dropping those younger than 14 to allow for primary school completion leaves about 66.8 million observations.7 Appendix Figure A.1 portrays the evolution of the pan-African distribution of educational attainment across cohorts. Education rises, mostly reflecting increasing completion of primary schooling. The share of Africans with tertiary education is minuscule even for the 1980s-born, while secondary education has increased modestly.8 We need to observe education for children and at least one individual of the immediately older generation.
This requirement brings the sample to 25.8 million. Appendix table B.1 gives details on sample construction.
For a first look at the data, we construct 4×4 attainment transition matrices for individuals older than 25 years. Figure 1 (a) shows the Africa-wide transition matrix using all censuses, while figures 1 (b) and (c) zoom in Mozambique and Tanzania, respectively.
The vertical axis indicates the likelihood that the child has the respective education, conditional on the older generation attainment, depicted on the horizontal axis. 81.5%
of the “old” generation across the continent has not completed primary schooling. 19%
of African children, whose parents have not completed primary schooling, manage to do;
9.5% finish high-school, and 2.5% get a college degree. The figure also illustrates the sharp differences between the two Eastern African countries. In Tanzania, 47% of children whose parents have not finished primary school manages to do so; in Mozambique, the corresponding share is 12%.
2.3 Methodology
We construct measures of absolute IM that reflect the likelihood that children complete a strictly higher or lower education level than members of the immediately previous gen- eration in the household (parents and/or extended family members, such as aunts and uncles). For the education of the “old”, we take the average attainment of individuals one generation older in the household, rounded to the nearest integer (results are similar if we take the minimum or maximum).9 As the relevant dimension for Africa during this period regards the completion of primary schooling, we focus on this aspect.10
7We validated the IPUMS data across country-cohorts with the Barro and Lee (2013) statistics and at the regional level using DHS; correlations exceed 0.9 (Appendix Section C)
8There are four attainment categories: (i) no schooling and less than completed primary; (ii) completed primary (and some secondary); (iii) completed secondary (and some tertiary); and (iv) completed tertiary (and higher). We use attainment, rather than years of schooling, for many reasons. First, the attainment data have wider coverage than years of schooling. In the raw IPUMS data, there are about 25.5 million records with attainment, but without years of schooling. The latter is missing altogether for four countries and several censuses. Second, there is likely less noise on completion data as compared to schooling years, which are often inferred from the former. Third, looking at children, whose parents have not completed primary schooling, allows for a common across countries, simple to grasp baseline.
9Some studies use data that match children to either mothers or fathers (e.g., Asher, Novosad, and Rafkin (2020). Others, like we do, take the average (e.g., Hilger (2017)), while some take the highest value (e.g., Geng (2018)). Taking the mean, maximizes coverage (see also Davis and Mazumder (2020)).
10The intergenerational mobility literature has employed various measures (see Black and Devereux (2011). Many studies focus on (one minus) the intergenerational coefficient obtained from a regression of children on parental schooling (e.g., Hertz et al. (2008)); others work with rank-rank correlation coefficients and intergenerational rank movements (e.g., Asher, Novosad, and Rafkin (2020), Geng (2018), Chetty et al.
(2014)). While rank-based measures isolate the relative movement of children in the distribution compared to the older generation from the overall increase, they may be sensitive to measurement error (see
Figure 1: Educational Attainment Transition Matrices
(a) Africa, 27 countries, 69 censuses
0 .25 .5 .75 1
likelihood of child attainment
0 .2 fraction by parental attainment.4 .6 .8 1
less than primary primary completedsecondary completedtertiary completed
less than primary primary completed
secondary completed tertiary completed
(b) Mozambique, 1997, 2007 census
0 .25 .5 .75 1
likelihood of child attainment
0 .2 fraction by parental attainment.4 .6 .8 1
less than primary primary completedsecondary completedtertiary completed
less than primary primary completed
secondary completed tertiary completed
(c) Tanzania, 1988, 2002, 2012 census
0 .25 .5 .75 1
likelihood of child attainment
0 .2 fraction by parental attainment.4 .6 .8 1
less than primary primary completedsecondary completedtertiary completed
less than primary primary completed
secondary completed tertiary completed
The figure shows the transition matrices for four educational attainment categories for Africa, Mozambique and Tanzania. The sample consists of individuals aged 25 and older, co-residing with at least one individual of an older generation.
To construct absolute IM measures, we first define the following indicator variables:
• lit paribct equals 1 if the parent of individual i born in birth-decade b in country c and observed in census-year t is literate and zero otherwise. We label “illiterate”
those who have not completed primary education and “literate” those who have.
• IM upibct equals 1 if a child iborn to illiterate parents in birth-decadeb in country c and observed in census-year tis literate and zero otherwise.
• IM downibctequals 1 if a childiborn to literate parents in birth-decadebin country c and observed in census-year tis illiterate and zero otherwise.
Mogstad et al. (2020)). Other studies (e.g., Card, Domnisoru, and Taylor (2018), Davis and Mazumder (2020) and Chetty et al. (2017)) focus, as we do, on absolute transition likelihoods. Gottschalk and Spolaore (2002) provide a theoretical exploration of different mobility measures. The absolute IM measures correlate strongly with the IM coefficient across both countries and regions. The correlation of the absolute IM statistics with the intergenerational correlation is though small.
Then, we estimate the following specifications, pooling observations across all censuses and countries:
lit paribct=αoc+ [γob +δyb +θt] +ict (1) IM up/downibct=αyc+ [γbo+δby+θt] +ict, (2) For parental literacy (equation (1)), we compute means among all individuals for whom we observe their parents’ (older generation relatives) attainment, netting birth-decade fixed effects for the “young”(δby) and the “old”(γbo) and census-year fixed effects (θt).
For upward IM, we estimate equation (2) for children whose parents have not completed primary education; thus the country fixed effects ( ˆαyc) reflect the conditional likelihood that children of illiterate parents become literate, netting cohort and census effects. For downward IM, we estimate (2) for children whose parents have completed at least primary;
so ˆαyc measure the conditional likelihood that children of literate parents do not complete primary schooling netting census-year and cohort effects.
For the regional analysis, we run similar specifications at the district level, country- by-country, and extract the demeaned literacy of the old generation, upward IM, and downward IM (conditioning on cohort and census fixed-effects).
lit paribcrt=αor+ [γbo+δbo+θt] +ibcrt (3) IM up/downibcrt=αyr+ [γbo+δob +θt] +ibcrt. (4) 2.4 Cohabitation Selection
Estimating the IM of individuals who reside with at least one older family member (usually a biological parent) raises cohabitation-selection concerns, as the transmission of education may differ between children living with older family member(s) and those that do not. This issue is less pressing for young children, as almost all of them cohabitate with their parents.
The younger the child, however, the higher the risk of misclassifying her attainment as
“less-than-primary” when in fact she would complete primary education a few years after we oberve her in the census. Hence, following Card, Domnisoru, and Taylor (2018), we focus on “children” aged 14−18 years, as by then primary education is mostly completed and cohabitation rates are still high (see also Hilger (2017)).
We use census information on the “relationship to household head” to recover the
“old” generation and take the average of their educational attainment. Appendix Section D provides details, discussing also how we deal with heterogeneity in family structure (e.g., nuclear families, presence of young wives). The Appendix reports statistics for each census, as their detail differ. On average, cohabitation with any relatives for children aged 14−18 is around 94.5%. However, the “relationship to household head” variable is coarsely documented in some censuses.11 To maximize coverage and avoid misclassifying
11An extreme example is the Togo 2010 census, which classified 92.9% of individuals 14−18 years as cohabitating with some relative. Due to the census’ sparse categorization of the relationship to family head, about half of the children are classified as residing with “other relatives.” Some censuses distinguish between biological, adopted, and step-children (e.g., Nigeria, South Africa, Zambia), but most do not.
coresidence with older family member(s) due to census coarseness, we assign “other rel- atives (not elsewhere classified)” to the “ old” generation if they are at least 15 and less than 40 years older than the child. [This imputation affects about 10% of the sample and does not affect the results.]
For individuals aged between 14 and 18 years, the coresidence rate across all censuses with an older generation relative is 84% (see appendix table D.2). Cohabitation rates with an older family member exceed 90% in 11 censuses; it is between 85%−90% for 15 and between 80%−85% for 17. The lowest coresidence rate is recorded in Kenya in 1969 (63.3%), in Malawi in 1987 (68.9%), and in Botswana in 1991 and 2011 (around 70%). As a reference point, Card, Domnisoru, and Taylor (2018) report coresidence rates for African Americans and whites in the US 1940 census of about 78% and 89%, respectively.
We also work with individuals aged 14-25, as this increases the sample considerably, including also high-school and college graduates, while cohabitation is still reasonably high (around 70%). The Appendix (Section D) gives details and also reports the distribution of district-level cohabitation rates; the mean (median) is 82% (82.5%). Cohabitation rates have slightly risen, though this most likely reflects improvements in census details.
3 Intergenerational Mobility across Countries and Regions
3.1 IM across African Countries 3.1.1 Baseline Measures
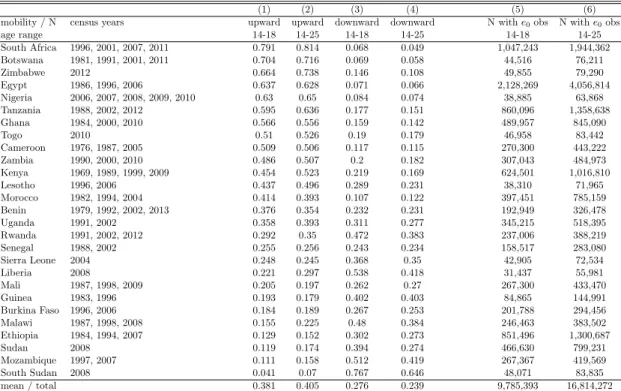
Table 1 shows simple (unconditional) country-level estimates of intergenerational mobility (columns (1)-(4)) alongside the number of children (young) for the 14−18 and the 14−25 sample. (The series are strongly correlated,ρ > .97). On average, less than forty percent of children of illiterate parents have managed to complete primary education. Downward IM is considerable, as approximately one out of four children born to literate parents does not complete primary education.
The pan-African mean masks sizable variation. The likelihood that children of illiterate parents will complete at least primary education ranges from an abysmal 4% in South Sudan and 11% in Mozambique to 80% in South Africa and 70% in Botswana. The lowest upward IM is in the Sahel (Sudan, Burkina Faso and to a lesser extent Mali and Senegal) and the highest in Southern Africa (Botswana, Zambia, Zimbabwe, and South Africa) with Western and Eastern African countries in the middle. Downward mobility is negatively correlated with upward mobility. Downward IM is the highest in countries plagued by long- lasting conflicts, such as Rwanda (0.47), Liberia (0.54), Mozambique (0.51), and South Sudan (0.77). Downward IM is below 10 percent in more stable ones like Botswana, South Africa, Egypt, and Nigeria. The uncovered cross-country heterogeneity in absolute IM across Africa is considerably larger than the cross-Indian state and cross-Chinese province variability in relative IM documented by Asher, Novosad, and Rafkin (2020) and Geng (2018), respectively.12
12Geng (2018) documents a province range in IM rank-rank coefficients of 0.25 to 0.5 in the 2000 Chinese Census. The range across (340) prefactures is between−0.033 to 0.661. Asher, Novosad, and Rafkin (2020) estimate a range of relative educational mobility of 0.17 to 0.72 across 124 Indian districts and 0.26 to 0.60 across 25 states. Yet, as our statistics reflect absolute rather than relative changes of children’s
Table 1: Country-Level Estimates of Intergenerational Mobility (IM)
(1) (2) (3) (4) (5) (6)
mobility / N census years upward upward downward downward N withe0obs N withe0obs
age range 14-18 14-25 14-18 14-25 14-18 14-25
South Africa 1996, 2001, 2007, 2011 0.791 0.814 0.068 0.049 1,047,243 1,944,362
Botswana 1981, 1991, 2001, 2011 0.704 0.716 0.069 0.058 44,516 76,211
Zimbabwe 2012 0.664 0.738 0.146 0.108 49,855 79,290
Egypt 1986, 1996, 2006 0.637 0.628 0.071 0.066 2,128,269 4,056,814
Nigeria 2006, 2007, 2008, 2009, 2010 0.63 0.65 0.084 0.074 38,885 63,868
Tanzania 1988, 2002, 2012 0.595 0.636 0.177 0.151 860,096 1,358,638
Ghana 1984, 2000, 2010 0.566 0.556 0.159 0.142 489,957 845,090
Togo 2010 0.51 0.526 0.19 0.179 46,958 83,442
Cameroon 1976, 1987, 2005 0.509 0.506 0.117 0.115 270,300 443,222
Zambia 1990, 2000, 2010 0.486 0.507 0.2 0.182 307,043 484,973
Kenya 1969, 1989, 1999, 2009 0.454 0.523 0.219 0.169 624,501 1,016,810
Lesotho 1996, 2006 0.437 0.496 0.289 0.231 38,310 71,965
Morocco 1982, 1994, 2004 0.414 0.393 0.107 0.122 397,451 785,159
Benin 1979, 1992, 2002, 2013 0.376 0.354 0.232 0.231 192,949 326,478
Uganda 1991, 2002 0.358 0.393 0.311 0.277 345,215 518,395
Rwanda 1991, 2002, 2012 0.292 0.35 0.472 0.383 237,006 388,219
Senegal 1988, 2002 0.255 0.256 0.243 0.234 158,517 283,080
Sierra Leone 2004 0.248 0.245 0.368 0.35 42,905 72,534
Liberia 2008 0.221 0.297 0.538 0.418 31,437 55,981
Mali 1987, 1998, 2009 0.205 0.197 0.262 0.27 267,300 433,470
Guinea 1983, 1996 0.193 0.179 0.402 0.403 84,865 144,991
Burkina Faso 1996, 2006 0.184 0.189 0.267 0.253 201,788 294,456
Malawi 1987, 1998, 2008 0.155 0.225 0.48 0.384 246,463 383,502
Ethiopia 1984, 1994, 2007 0.129 0.152 0.302 0.273 851,496 1,300,687
Sudan 2008 0.119 0.174 0.394 0.274 466,630 799,231
Mozambique 1997, 2007 0.111 0.158 0.512 0.419 267,367 419,569
South Sudan 2008 0.041 0.07 0.767 0.646 48,071 83,835
mean / total 0.381 0.405 0.276 0.239 9,785,393 16,814,272
Columns (1) and (2) give upward-IM estimates. They reflect the likelihood that children, aged 14-18 and 14-25, whose parents have not completed primary schooling to complete at least primary education. Columns (3) and (4) give downward-IM estimates. They reflect the likelihood that children, aged 14-18 and 14-25, whose parents have completed primary schooling or higher fail to complete primary education. Columns (5) and (6) give the number of observations (children whose parental education is reported in the censuses). Countries are sorted from the highest to the lowest level of upward IM in the 14-18 sample (column (1)). “Mean” gives the unweighted average of the 27 country-estimates.
Given heterogeneity in family structures across the continent, we estimated different IM statistics for children co-residing with biological parents, other older generation relatives, and both. Appendix E.1 reports the cross-country measures. Upward IM is somehwat higher and downward IM lower for children co-residing with biological parents. However, the various measures are strongly correlated (0.95) and the country rankings not much affected by family structure.
3.1.2 Rural-Urban Residence
We compiled IM separately for rural and urban households. Appendix Table E.2 reports the statistics across countries. The correlation between rural and urban IM is 0.85 for both the upward and downward measures. Setting aside South Sudan, an outlier, upward IM in urban places ranges from 0.21 in Mozambique to around 0.85 in Zimbabwe and South Africa (mean 0.53 and st. dev. 0.2). The variability in rural upward IM relative to the mean is wider (mean 0.33 and st. dev. 0.22), hovering around 0.06 in Mozam- bique, Ethiopia, South and North Sudan but exceeding 0.6 in Nigeria, Egypt, Zimbabwe, Botswana, and South Africa. Overall, the rural-urban gap in mobility is the highest in poor
position in the educational distribution, the estimates’ ranges are not directly comparable. The variability of educational mobility across the US is lower than the pan-African one illustarted here. Fletcher and Han (2018) report IM schooling coefficients ranging from 0.3 till 0.6 across US states (median 0.45) using survey data in 1982, 1992, and 2004. Hilger (2017) reports a coefficient of variation of around 0.3 for educational mobility across US states.
countries (Appendix Figure E.2 (b)). In Figure 2 we explore the evolution of rural-urban gaps. Upward IM is on average 18% higher for urban, as compared to rural households, for all cohorts and countries, but Egypt in the 1960s and 1970s. The rural-urban gap is the highest in countries with low levels of mobility and literacy. For example, there is a gap of about 40 percentage points between rural and urban places in Ethiopia and Burkina Faso; the rural-urban gap is below 10 percentage points in South Africa and Botswana.
Figure 2: Upward IM Urban-Rural Gap
1960 1970 1980 1990
Birth decade 0.2
0.1 0.0 0.1 0.2 0.3 0.4 0.5
urban upward IM - rural upward IM
EGY KEN LSOBEN ETH
EGY MOZ LSOCMR
ZAF LSOBEN MOZ ETH
ZAF MWI MOZ CMR
ZAFKEN MWIBEN ETH
EGY KEN MWICMR
EGY GIN ETH
UGA GIN
NGA GHA SENGIN
SLE
SSD NGARWA ZWE SDN MLI MWI
CMR
BWA ZMB
RWA TZAUGA MLIZMB BFA
LBRTZA GHA SLETGO BFA
countries with data for 1970s, 1980s, 1990s other countries
mean among countries with data 1970s-1990s
The figure plots the difference in upward IM between individuals aged 14-18 residing in urban and rural locations by country and birth decade. The criteria for the rural-urban classification vary. In some countries, statistical agencies rely solely on population cutoffs, while others use localities’ economic activity. In a few instances, the statistical codebook does not provide precise information. Rural-urban status is not reported for Morocco.
3.1.3 Gender
We also estimate IM separately for boys and girls. Appendix Table E.2 gives the country means. The correlation of the IM measures for boys and girls exceed.90 and, as such, the cross-country ranking is similar. Figure 3 shows the evolution of male-female differences in upward-IM. There is a gender gap for the 1960s cohorts (especially when we exclude Botswana) that disappears for the 1980s and the 1990s cohorts. To be sure, there are countries where boys fare much better than girls: the gender gap is salient in North Africa (Morocco and Egypt) and the Sahel (Senegal, Togo, Mali, and Ethiopia). However, girls born to illiterate parents in many Southern and Eastern African countries, like Lesotho, Botswana, Tanzania, and South Africa, enjoy a small edge in completing primary schooling over boys. Gender differences in mobility are not related to GDP per capita (Appendix Figure E.2 (a)).
Figure 3: Upward IM Male-Female Gap
1960 1970 1980 1990
Birth decade 0.2
0.1 0.0 0.1 0.2
male upward IM - female upward IM
LSO ZAF KEN RWAMOZ CMR EGYMLI MAR
BWA KEN MWIETHMOZ GHAEGY MAR
LSO RWAKEN MWIZMB ETH EGY MAR BEN
BWA TZA ETHMWI ZMBBFA GHA BEN
LSO ZAF TZA RWAZMB BFAMLI CMR BEN
TZAZAF BWA GHAMOZ BFA CMRMLI
BWA MWICMR GIN GHA
UGA GIN
UGA SLE
ZWE NGA LBR TGO
ETH EGY MLI MAR
BEN SEN
NGA SEN GIN
SDN SSDSLE
countries with data for 1970s, 1980s, 1990s other countries
mean among countries with data 1970s-1990s
The figure plots the difference (gap) in upward IM between male and female young individuals aged 14-18 by country and birth decade.
3.2 Mapping the African Land of Opportunity 3.2.1 Cross-Sectional Patterns
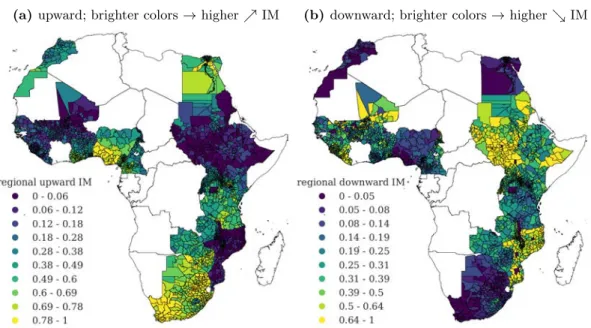
Figure 4 illustrates social mobility across the continent, mapping Africa’s land of oppor- tunity. Panel (a) shows the distribution of absolute upward IM across (mostly admin-2) districts and Panel (b) plots absolute downward IM.
Figure 4: District-level Upward and Downward IM
(a)upward; brighter colors→higher%IM (b)downward; brighter colors→higher&IM
Table 2: Summary Statistics: District-Level Estimates of IM
upward downward
country districts mean median stdev min max mean median stdev min max
South Africa 216 0.788 0.802 0.07 0.565 0.897 0.081 0.073 0.038 0.018 0.217
Zimbabwe 88 0.734 0.746 0.136 0.428 1.0 0.161 0.161 0.086 0.02 0.462
Botswana 23 0.71 0.717 0.083 0.5 0.826 0.076 0.077 0.027 0.0 0.133
Nigeria 37 0.7 0.772 0.21 0.301 0.957 0.094 0.083 0.051 0.02 0.189
Egypt 236 0.673 0.683 0.108 0.392 0.914 0.076 0.068 0.039 0.013 0.242
Tanzania 113 0.615 0.619 0.096 0.391 0.836 0.182 0.181 0.068 0.056 0.369
Ghana 110 0.577 0.637 0.157 0.176 0.803 0.214 0.198 0.077 0.101 0.557
Cameroon 230 0.539 0.58 0.208 0.083 0.895 0.228 0.182 0.144 0.035 0.812
Kenya 173 0.504 0.523 0.189 0.054 0.872 0.261 0.269 0.108 0.041 0.586
Togo 37 0.493 0.506 0.13 0.235 0.687 0.252 0.242 0.093 0.092 0.543
Zambia 72 0.48 0.472 0.123 0.282 0.771 0.275 0.28 0.096 0.084 0.483
Morocco 59 0.429 0.422 0.14 0.158 0.702 0.144 0.13 0.066 0.062 0.375
Lesotho 10 0.421 0.423 0.057 0.318 0.497 0.328 0.337 0.06 0.235 0.419
Uganda 161 0.373 0.374 0.124 0.019 0.659 0.382 0.38 0.118 0.152 0.933
Benin 77 0.36 0.369 0.126 0.105 0.597 0.274 0.264 0.079 0.123 0.594
Rwanda 30 0.302 0.283 0.061 0.228 0.468 0.501 0.53 0.095 0.255 0.623
Senegal 34 0.253 0.183 0.151 0.078 0.592 0.316 0.282 0.132 0.149 0.793
Sierra Leone 107 0.219 0.17 0.143 0.032 0.667 0.563 0.581 0.189 0.142 1.0
Ethiopia 94 0.207 0.123 0.223 0.008 0.81 0.427 0.412 0.195 0.0 1.0
Malawi 227 0.195 0.16 0.111 0.049 0.562 0.533 0.551 0.122 0.179 0.8
Liberia 47 0.187 0.194 0.079 0.032 0.348 0.613 0.594 0.115 0.397 1.0
Guinea 34 0.156 0.151 0.072 0.06 0.432 0.441 0.44 0.098 0.25 0.68
Sudan 129 0.155 0.104 0.142 0.001 0.556 0.549 0.545 0.177 0.27 1.0
Burkina Faso 45 0.144 0.138 0.077 0.03 0.501 0.328 0.328 0.1 0.0 0.609
Mali 241 0.142 0.126 0.093 0.014 0.538 0.455 0.406 0.223 0.0 1.0
Mozambique 144 0.094 0.066 0.084 0.017 0.67 0.641 0.625 0.158 0.141 1.0
South Sudan 72 0.043 0.021 0.055 0.0 0.31 0.849 0.864 0.138 0.5 1.0
total 2,846 0.403 0.375 0.267 0.0 1.0 0.337 0.294 0.235 0.0 1.0
This table shows summary statistics for district level esimates of IM. “Total” shows the unweighted summary statistics across all districts.
Table 2 reports summary statistics by country. The district-level (unweighted) average and median for upward (downward) IM across the 2,846 regions are 0.40 (0.34) and 0.375 (0.294), respectively, close to the cross-country values.13 As an example of the large within country variation, Figures 5 (a) and (b) portray upward and downward IM across 110 regions in Ghana. While average upward IM is 0.58, regional IM ranges from 0.18 to 0.82 with rates below 0.4 in the Northern regions and above 0.7 in the South. The mean downward mobility is 0.20, but it varies from 0.08 to 0.50. This north-south gradient mirrors both the country’s religious geography as well as colonial-era missionary activity and transportation investments, topics we return to below.
IM varies greatly across regions in many countries.14 In Burkina Faso, for example, the average upward-IM of 0.132 masks a regional range from 0.03 to 0.50. In Uganda, the upward-IM range is wider [0.015−0.69]. Spatial differences in IM are wider in countries with lower levels of mobility, a pattern that adds to the literature showing that underde- velopment moves in tandem with regional inequalities (see Kanbur and Venables (2005) for review).
13As in some countries, like Nigeria, districts are large, the map misses within-region spatial variation in IM that is likely non-negligible.
14For some districts mobility is either zero or one. These extremes reflect the small number of obser- vations. The mean (median) district estimate is based on 1,936 (891) children (st.dev = 3,287). The patterns are similar if we restrict to regions with many observations.
Figure 5: Ghana: District-level Upward and Downward IM
(a) upward; brighter colors→higher%IM (b) downward; brighter colors→higher&IM
3.3 Trends
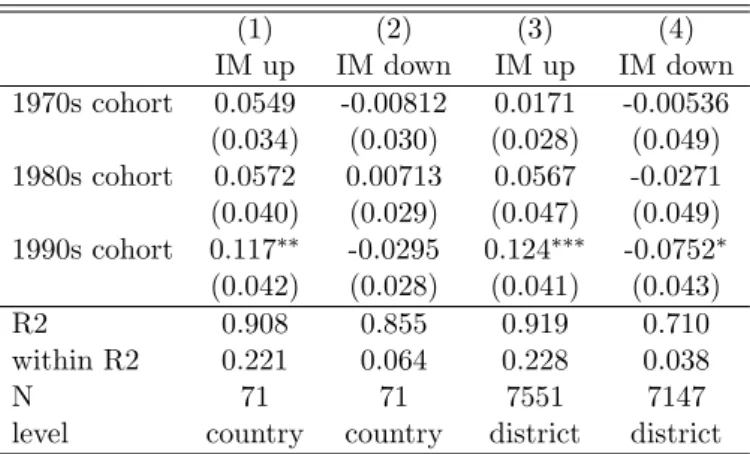
In Table 3 we examine how average IM evolves for Africans born in the 1960’s, 1970’s, 1980’s and 1990’s.15 The within-country and within-district estimates show a mild increase in upward IM in the 1970s and 1980s. Upward IM is about 12 percentage points higher for the 1990s-born as compared to those born in the 1960s. Downward IM is falling over time, though at a weaker and more heterogeneous pace.16
Table 3: Evolution of IM across cohorts
(1) (2) (3) (4)
IM up IM down IM up IM down 1970s cohort 0.0549 -0.00812 0.0171 -0.00536
(0.034) (0.030) (0.028) (0.049) 1980s cohort 0.0572 0.00713 0.0567 -0.0271 (0.040) (0.029) (0.047) (0.049) 1990s cohort 0.117∗∗ -0.0295 0.124∗∗∗ -0.0752∗
(0.042) (0.028) (0.041) (0.043)
R2 0.908 0.855 0.919 0.710
within R2 0.221 0.064 0.228 0.038
N 71 71 7551 7147
level country country district district
The table reports OLS estimates associating cohort-level upward IM (in columns (1) and (3)) and down- ward IM (in (2) and (4)) across countries (in (1)-(2)) and across regions (in (3)-(4)) with cohort indicators; the 1960s cohort serves as the omitted category. Specification (2) includes country constants (not reported) and specification (4) includes region constants (not reported). Standard errors clustered at the country- level are reported in parentheses.
∗p <0.1,∗ ∗p <0.5,∗ ∗ ∗p <0.01.
15Appendix E.3 portrays the distribution of regional IM across cohorts. The standard deviation of upward IM is roughly constant though the distribution becomes less skewed over time. The standard deviation of downward IM falls slightly.
16There is some relation of these patterns with the ones that Hilger (2017) presents for the US. He finds that the share of children with strictly higher educational attainment than their parents increased for the 1930s, 1940s, and 1950s born cohorts, but started falling after. The increase was acute for African Americans, though the decline applied to both whites and blacks.
Figure 6 illustrates the correlation of regional upward-IM for the 1990s and the 1970s cohorts. There is an almost one to one link with a strong fit. The slope decreases to.67 in the country fixed-effects specification.
Figure 6: District-level Upward IM over Time
(a)OLS
0.0 0.2 0.4 0.6 0.8 1.0
Upward IM, 1970 0.0
0.2 0.4 0.6 0.8 1.0
Upward IM, 1990
IMd, 1990up = 0.12 + 0.98 * IMupd, 1970
R-squared = 0.82
North South West East Central
(b)country fixed effects
0.0 0.2 0.4 0.6 0.8 1.0
Upward IM, 1970 0.0
0.2 0.4 0.6 0.8 1.0
Upward IM, 1990
IMd, 1990up = c+ 0.67 * IMd, 1970up
R-squared = 0.94 within R-squared = 0.6
North South West East Central
The figures visualize the link between district-level upward IM for the 1990s to the 1970s cohorts. Panel (a) shows the simple linear regression fit; panel (b) shows the regression with country fixed effects fit. Dots are color-coded by African region following the classification of Nunn and Puga (2012).
3.4 Literacy of the Old and IM
Motivated by evidence from the recent research agenda on intergenerational mobility (e.g., Chetty et al. (2020a)) showing that upward mobility is higher in regions with better outcomes (wealth, education, income) and research on African growth stressing poverty traps and slow convergence (e.g., Gunning and Collier (1999)), we examine the association between IM and literacy rates of the “old generation”. While these correlations do not have a causal interpretation, they allow us to explore inertia.
3.4.1 Cross-Country Patterns
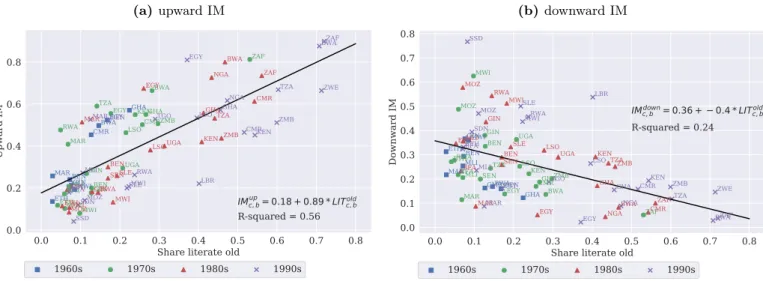
Figure 7, panel (a), plots the relationship between country-level IM across cohorts and the literacy rate of the old generation of the respective cohort. A strong positive association emerges. In Ethiopia, Burkina Faso, Mozambique, North, and South Sudan, where for all cohorts the share of literate “old” is less than 20%, the likelihood that children from illiterate parents will complete primary school is below or close to 20%. The analogous statistic for Botswana and South Africa, where the old-cohorts’ literacy rate exceeds 50%, hovers around 70%. A one-percentage-point increase in the literacy of the old is associated with a.89 percentage points increase in upward IM; and variation in the former explains 56% of the cross-country-cohort variation in upward IM. Figure 7 Panel (b) uncovers a similar though attenuated relationship between the literacy of the “old” generation and downward IM. A one percentage point increase in the “old” generation’s literacy maps into a 0.4 decline in downward IM; the old generation’s literacy explains about a fourth of the variation in downward IM. Compared to upward IM, downward IM appears more sensitive to cohort-specific civil conflict (e.g., Sudan, Liberia, Sierra Leone).
Figure 7: Literacy of the Old Generation and Intergenerational Mobility across Countries
(a) upward IM
0.0 0.1 0.2 0.3 0.4 0.5 0.6 0.7 0.8
Share literate old 0.0
0.2 0.4 0.6 0.8
Upward IM
BEN CMRBWA
EGY
ETH
GHA
MARGIN MLIMWIBEN BFA
BWA
CMR EGY
ETH
GHA
GIN KEN LSO MAR
MLI MOZMWI RWA
SEN TZA
UGA
ZAF
ZMB
BEN BFA
BWA
CMR EGY
ETH
GHA
GIN
LSO KEN MAR
MOZMLI MWI
NGA
RWA SENSLE
TZA
UGA
ZAF
ZMB BEN
BFA
BWA
CMR EGY
ETH
GHA KEN
LBR MAR LSO
MLI MOZ
MWI
NGA
RWA SDN
SSD
SLE
TZA ZAF
ZMB ZWE TGO
IMc, bup= 0.18 + 0.89 * LITc, bold
R-squared = 0.56
1960s 1970s 1980s 1990s
(b)downward IM
0.0 0.1 0.2 0.3 0.4 0.5 0.6 0.7 0.8
Share literate old 0.0
0.1 0.2 0.3 0.4 0.5 0.6 0.7 0.8
Downward IM BEN
CMREGYBWA ETH
GHA GIN
MARMLI MWIBEN
BFA
CMRBWA EGY ETH
GHA GIN
LSOKEN MAR
MLI MOZ MWI
RWA SENTZA
UGA
ZAF ZMB
BEN BFA
BWA CMR EGY
ETH
GHA GIN
LSO KEN
MAR MLI MOZ
MWI
NGA RWA
SEN SLE
UGA TZA
ZAF ZMB BEN
BFA
BWA CMR
EGY ETH
GHA KEN LBR
LSO
MAR MLI
MOZ MWI
NGA RWA
SDN SSD
SLE
TZA ZAF
ZMB ZWE
TGO
IMc, bdown= 0.36 + 0.4 * LITc, bold
R-squared = 0.24
1960s 1970s 1980s 1990s
The figures plot upward-IM and downward-IM across country-birth-cohorts against the share of the “old” generation that has completed primary education. The figures also report the unweighted OLS regression fit.
3.4.2 Regional Patterns
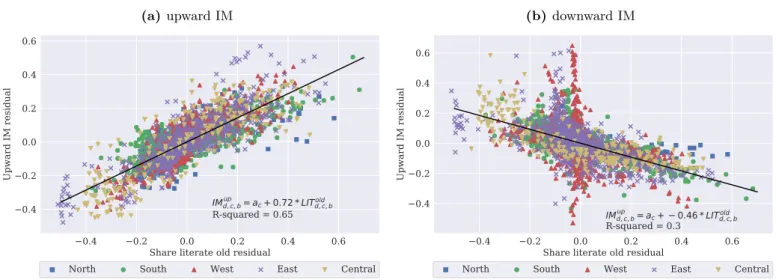
Figures 8 (a) and (b) plot the district-level association between upward and downward IM and mean literacy of the “old” generation, netting country-cohort and census effects.
We observe a strong association between the literacy of the “old” and upward IM across African regions. Likewise, there is a negative -but less steep- correlation between downward IM and the literacy of the old. A 10 percentage points increase in the literacy of the
“old” is associated with a roughly 7 percentage points increase in the likelihood that children of illiterate parents will complete primary and a 4.5 percentage points lower chance that kids of literate parents will fall below parental literacy. The estimates retain statistical significance and decline modestly when we replace the country constants with admin-1 fixed effects to account for relatively local features. This pattern is similar to Asher, Novosad, and Rafkin (2020) that a state’s/region’s mean education is the strongest correlate of upward educational mobility in India. Similarly, G¨uell et al. (2018) document a significantly positive correlation between IM in well-being and education across Italian regions.
Hence, disadvantaged (from non-educated) families children are more likely to complete primary school in regions with relatively higher literacy. Path dependence can reflect various mechanisms. First, poverty trap dynamics that are especially salient in subsistence agriculture rural Africa. Second, sunk costs in large-scale investments and infrastructure.
Third, persistent spatial disparities in schools may be a contributing factor. Fourth, inertia may result from internal migration and spatial sorting. Fifth, the estimates may partly reflect human capital externalities (as Wantchekon (2019) shows in Benin).
3.4.3 Heterogeneity
We explored heterogeneity in the old’s literacy-IM association in terms of the child’s gender and the rural-urban household residence. The analysis, reported for brevity in Appendix E.4, reveals two noteworthy patterns. First, the association between IM and the share of