plant species and habitats - seed longevity, seed viability
and phylogeography
Dissertation zur Erlangung des Doktorgrades der Naturwissenschaften (Dr. rer. nat.) der Fakultät für Biologie und Vorklinische Medizin
der Universität Regensburg
vorgelegt von
SIMONE B. TAUSCH
aus Burghausen im Jahr 2017
Regensburg, den 14.12.2017
Simone B. Tausch
Chapter 1 Chapter 2
Chapter 3
Chapter 4
Chapter 5 Chapter 6
Summary
Zusammenfassung References
Danksagung
6 12
28
42
56 66
70 72 74 89 General introduction
Towards the origin of Central European grasslands: glacial and postgla- cial history of the Salad Burnet (Sanguisorba minor Scop.)
A habitat-scale study of seed lifespan in artificial conditions examining seed traits
Seed survival in the soil and at artificial storage: Implications for the conservation of calcareous grassland species
How precise can X-ray predict the viability of wild flowering plant seeds?
Seed dispersal in space and time - origin and conservation of calcareous grasslands
DECLARATION OF MANUSCRIPTS
Chapter 2 was published with the thesis’ author as main author:
Tausch, S., Leipold, M., Poschlod, P. and Reisch, C. (2017). Molecular markers provide evidence for a broad-fronted recolonisation of the widespread calcareous grassland species Sanguisorba minor from southern and cryptic northern refugia. Plant Biology, 19: 562–570. doi:10.1111/plb.12570.
THREATENED AND ENDANGERED HABITATS
Regarding the situation of Europe’s plant species in- ventory, Central Europe represents the centre of en- dangered plant species. Germany is ranking on the upper limit: The out-dated German Red Data Book on endangered plant species lists about 40 % of its native flora as endangered, very rare or potentially endangered (Ludwig & Schnittler, 1996). The current FFH-report “Lage der Natur” shows that habitats with poor conservation status increased from 61 to 70 % from 2007 to 2014 (BfN, 2014).
The prognosis for endangerment strongly depends on the regenerative capacity of a habitat which is not only determined by the development of suitable en- vironment conditions (nitrogen content or humidity) but also on enabling, establishing and maintaining circumstances that have led to the development of a habitat type, e.g. in Central Europe mainly agricultur- al habitats in an anthropogenous landscape. Corre- spondingly, the status of thirteen habitats in Germa- ny has worsened within the last seven years, of which six depend on sustainable land use and maintenance (BfN, 2014).
CALCAREOUS GRASSLANDS: THREATENED CULTURAL LANDSCAPE
Calcareous grasslands are among the most spe- cies-rich ecosystems in Central Europe (WallisDeVries et al., 2002; Sádlo, 2007). Their extent and quality is declining since the end of the 19th century (Quinger et al., 1994) due to intensification or abandonment of anthropo-zoogenic usage (Poschlod & WallisDeVries, 2002). The habitat is listed in the Annex I of the Natura 2000 Habitats Directive (92/43/EEC), ranking among critically endangered (xeric grasslands) and endan- gered (semi dry calcareous grasslands) (Riecken et al., 2006). The current German FFH-report (2014) demonstrates an insufficient conservation status (BfN, 2014).
Correspondingly, the recoverability/substitutabili- ty of dry grasslands is of great interest (Piqueray et al., 2011). It was shown that short-term re-establishment of calcareous grasslands was successful for species with persistent soil seed banks or long distance dis-
persal ability (von Blanckenhagen & Poschlod, 2005).
But in general, soils of calcareous grasslands exhibit low ability to buffer species extinctions by serving as donor (Thompson et al., 1997; Bekker et al., 1998a;
Kalamees & Zobel, 1998; Poschlod et al., 1998; Stöck- lin & Fischer, 1999; Karlik & Poschlod, 2014). In present anthropogenous landscapes calcareous grasslands are strongly fragmented and long-distance dispersal vectors such as sheep are largely missing. When using seeds for restoration, the success strongly depends on the quality of the used seed material and its au- tochthony (Walker et al., 2015).
A number of studies has dealt with the question about the “nearly unknown origin and history of Eu- ropean grasslands” (Poschlod & Baumann, 2010). Cre- ated, expanded and maintained by human activities (Poschlod & WallisDeVries, 2002; Schmidt et al., 2007) since the Neolithic periods (e.g. Bush, 1993; Tomescu, 2000; Dutoit et al., 2009), calcareous grasslands pos- sessed expansion maxima at the Roman Period and Middle Ages (Pott, 1996; Poschlod & WallisDeVries, 2002; Poschlod & Baumann, 2010; Hájková et al., 2011). Long before human interference, their species have probably occurred naturally on rocky outcrops or steep sunny slopes with shallow dry soils that would impede tree growth (Ellenberg, 1996; Poschlod et al., 2008) but may have even survived in the non- closed forests until the beginning of human settle- ment (Pokorný et al., 2015). Even during (Bush, 1988) or before the early post-glacial, they may have grown at climatically favoured sites among the steppe tun- dra vegetation (Gradmann, 1933; Kuneš et al., 2008;
Pokorný et al., 2015).
Equally as important as the knowledge about the temporal origin is the spatial origin of its species in- ventory, especially when facing its steady decline and attempts for restoration or ex situ conservation.
In the traditional view, during the glacials, temperate species have retracted to the Iberian, Italian, Balkan peninsulas in southern Europe where the species could escape from cold dry climates and persist until they could repopulate Europe (Taberlet et al., 1998;
Hewitt, 2000; Hewitt, 2004). To date only a small num- ber of studies has considered the question of genetic lineages of dry grassland species (Bylebyl et al., 2008;
Sutkowska et al., 2013; Harter et al., 2015). Due to lim- ited budgets in nature conservation, the knowledge
General introduction
mination by signalling or by being a barrier for the growing radicle (Finch-Savage & Leubner-Metzger, 2006). It is either fully consumed before seed matura- tion and its nutrients are incorporated into the stor- age cotyledons or it is still present in the mature seed.
The ratio of embryo to seed size (E:S ratio) in ma- ture seeds is largely associated with dormancy types and the relation has been analysed in several phyloge- netic reconstructions (Martin, 1946; Nikolaeva, 1967;
Baskin & Baskin, 1998; Forbis et al., 2002; Finch-Sav- age & Leubner-Metzger, 2006). Finch-Savage and Leu- bner-Metzger (2006) have stated that seeds of basal angiosperm species possess small E:S ratios and that in the course of evolution the E:S ratios have increased in advanced angiosperms. The evolutionary E:S ratio increase was accompanied with the evolution of dor- mancy (Finch-Savage & Leubner-Metzger, 2006) as morphological and physiological adaptations in re- sponse to different environmental conditions (Baskin
& Baskin, 2004). The water impermeability of the coat of physically dormant seed, for instance, is assumed to be an adaptation of plants to specialized habitats (Baskin & Baskin, 2004).
The ability of seeds to tolerate desiccation is a trait of major adaptive importance to their survival and dispersal role (Dickie & Pritchard, 2002). For des- iccation tolerant (orthodox) seeds, maturation drying is the terminal step in development after which they can remain viable up to several years (Bewley et al., 2013). Following drying, a number of cellular adap- tations enable the preservation of cellular compart- ments required for continued metabolism, which control the repair of damages that occur during the dry state and germination or dormancy upon rehy- dration. Approximately 92 % of the spermatophyte species produce desiccation tolerant seeds (Tweddle et al., 2003). In contrast to orthodox seeds desiccation sensitive (recalcitrant) seeds are shed in a hydrated and metabolically active state and usually germinate soon after (Long et al., 2015).
Germination and dormancy
Dormancy and germination mechanisms are impor- tant to ensure that seeds will germinate when envi- ronmental conditions are suitable indicating tempo- ral (e.g. seasons) or spatial windows (e.g. vegetation gaps) for establishment and survival (Bewley et al., 2013). In seed banks, the examination of (suitable) germination conditions not only serves as a method to detect seed viability, but it also provides knowl- edge for their future use in any restoration activities.
In germination testing, several environmental condi- tions are imitated like different moisture availability, (alternating or constant) temperature, light (quantity, about the (genetic) origin might become relevant
when selecting valuable populations for conserva- tion or the most suitable populations for restoration and ex situ conservation.
EX SITU CONSERVATION WITH SEED BANKS
Calcareous grassland habitats are only one exam- ple which clearly illustrates that direct degradation (Merritt & Dixon, 2011) and change of land use (Po- schlod et al., 2005a; Maurer et al., 2006; Poschlod, 2015) strongly force the need to determine methods to preserve these valuable habitats and its species in- ventory. The UICN (CBD, 2010, 2015) emphasizes that ex situ conservation provides a “safety back-up” and an insurance policy against extinction in the wild, es- pecially in the light of climate change. Therefore, the awareness of the importance of seed banks as a tool for ex situ conservation of rare and endangered plant species is increasing (Hay & Probert, 2013). In order to successfully store seeds over long periods and ap- ply them for restoration it is crucial to understand the mechanisms and characteristics that enable seed survival, influence seed quality, dormancy and germination. Therefore, seed banking facilities with conservation background take advantage of modern tools available from agricultural science, combine it with knowledge of seed ecology and investigations of functional and evolutionary aspects to guarantee efficient seed conservation.
Endosperm, dormancy and desiccation tolerance
Seeds are the most significant innovation of vascu- lar plants that arose in the course of plant evolution and the colonization of land approximately 350 mya (Clarke et al., 2011; Coiffard et al., 2012). This adap- tation of sexual reproduction has strongly enhanced survival and dispersal, providing a selection advan- tage. Seeds equip the embryo with protection by a closed structure and nutrition for successful germi- nation and establishment. These very adaptations now enable the survival of rare and threatened plant species in changing landscapes and can be success- fully used for ex situ conservation.
Considering internal seed morphology, a seed contains the embryo, nutritive tissue (endosperm, perisperm or the haploid megagametophyte in gym- nosperms) and is surrounded by the seed coat (tes- ta) that originates from the integuments. Most seeds contain large nutritive reserves in the cotyledons or alternative storage tissue, which are composed of carbohydrates like starch, oils and storage proteins (Bewley et al., 2013). The endosperm not only serves as nutritive tissue during seed development but is also involved in seed growth, development and ger-
seed viability, supposing the best germination condi- tion of the species or accession is known, it is still very time-consuming (usually several weeks up to months for seeds requiring pre-treatments). The quicker test methods like cutting test or Tetrazolium testing are destructive and either imprecise or difficult to inter- pret. Because of that, mainly small seed banks fore- go these examinations and store seeds uncontrolled.
ISTA (1999) accepts the X-ray method to distinguish full, empty, insect infested and physically damaged seeds. Despite being a promising and fast-forward method for viability detection, X-ray analysis is not yet recognized for testing viability (Elias et al., 2012).
Longevity and ageing ability
The inherent longevity of a seed can be described as
“the lifespan of a seed after maturity, determined by a complex expression of physiological traits includ- ing cellular mobility, internal protective compounds and the ability of cells to resist and repair damage“
(Long et al., 2015) and is strongly related to desicca- tion ability. It is the basis for seed persistence which itself may be influenced by abiotic and biotic factors (Kochanek et al., 2011; Abedi et al., 2014; Long et al., 2015). Aquired insights into longevity and seed age- ing enables storage facilities to produce conditions that extend the viability of seeds up to hundreds of years (Walters et al., 2005a; Van Treuren et al., 2012):
a dry and cold environment considerably slows down seed ageing (Walters, 1998; Smith et al., 2003; Kran- ner et al., 2011). Accelerated ageing methods (Smith et al., 2003; Probert et al., 2009) contribute significant knowledge to seed ageing.
Seed longevity is a quantitative plant trait that can vary between different populations within the same species based on genetic and environmental factors (Hay et al., 1997; Schoeman et al., 2010; Kochanek et al., 2011), whereas wild plant species are considered to have greater variation in longevity between dif- ferent seed collections than crop species (Ellis et al., 1989; Hay et al., 1997; Kochanek et al., 2011)
Geographically large-scale examinations on seed longevity have been performed using artificial age- ing to answer the question about prediction of seed longevity by phylogeny, seed traits and climate (Long et al., 2008; Probert et al., 2009; Mondoni et al., 2011;
Merritt et al., 2014). The results show that seeds origi- nating from warmer and dryer environments possess a greater longevity than those from cool, wet climates (Walters et al., 2005b; Long et al., 2008; Probert et al., 2009; Mondoni et al., 2011). While seed longevity de- pended at most slightly on seed size (Probert et al., 2009; Merritt et al., 2014), phylogeny (Walters et al., 2005b; Probert et al., 2009; Merritt et al., 2014), en- daily distribution and spectral quality), availability
of oxygen and chemicals (e.g. ethylene, karrikins, ni- trates) that affect dormancy alleviation and germina- tion (Finch-Savage & Leubner-Metzger, 2006; Bewley et al., 2013).
The process of germination begins with water up- take by the seed (imbibition) and is terminated with the emergence of the embryonic axis (mainly the radicle) (Bewley et al., 2013). A mature dry seed is qui- escent, in a metabolical rest, until imbibition and me- tabolism activating conditions initiate germination (Baskin & Baskin, 2004; Bewley et al., 2013). Dormant seeds however do not germinate although imbibed and metabolically active. In other words, seed dor- mancy is defined as an intrinsic block to the comple- tion of germination of a viable seed under favourable conditions for germination of the corresponding non- dormant seed (Baskin & Baskin, 2004; Finch-Savage
& Leubner-Metzger, 2006; Linkies et al., 2010). Based on Nikolaeva (1967, 1977) and Baskin & Baskin (1998, 2004) the most applied classification of seed dor- mancy differentiates physiological (PD), morpholog- ical (MD), morphophysiological (MPD), physical (PHY) and combinational (PY + PD) dormancy from non-dor- mancy (ND). Physical dormancy (PHY) is broken when a seed coat disruption (e.g. scarification) allows imbi- bition (Baskin et al., 2000; Baskin, 2003). Seeds with MD need no special dormancy breaking treatment but time for embryo growth and germination. De- pending on the level of MPD, seeds require more or less complicated (temperature sequence) pretreat- ments to break physiological dormancy (Baskin &
Baskin, 2004). PD can be divided into three different types which are broken by after-ripening, scarifica- tion, cold or warm stratification (Baskin & Baskin, 2004). Furtheremore, seeds with PD are able to adapt their depth of dormancy on seasonal changes by dor- mancy cycling (Baskin & Baskin, 1998; Finch-Savage &
Leubner-Metzger, 2006; Finch-Savage & Footitt, 2012, 2017; Long et al., 2015).
Seed viability
Besides seed collection and supply, a major task of seed storage facilities is to store seeds with high in- itial quality and viability and to maximize their lon- gevity. In order to avoid storage of seeds with un- known viability, an assessment of viability should be performed. Several methods for viability testing are described by international rules and handbooks (ISTA, 1999, 2003; AOSA, 2010a): Preliminary viability assessments via cutting test, excised embryo test, Topographical Tetrazolium test and germination test provide useful evaluation before storage. Although a germination test is the most reliable test to determine
survey genetic structures within all collected popu- lations of S. minor, we performed a Bayesian cluster analysis (Pritchard et al., 2000; Pritchard et al., 2009) and a cluster analysis using Cavalli-Sforza & Edwards chord distances and Neighbour Joining (Schlueter
& Harris, 2006). Geographic patterns in the data set were examined and displayed with a spatial Principal Component Analysis (sPCA) (Jombart et al., 2008).
SOIL SEED BANK ANALYSIS
From an ecological perspective, persistence allows seeds to disperse through time (Poschlod et al., 2005b; Poschlod et al., 2013). Soil seed persistence is important for community ecology as well as for conservation practices and management (Fischer et al., 1996; Maurer et al., 2003; Long et al., 2015). The survival of seeds in the soil is either determined by taking soil samples and examination of seed content (Thompson & Grime, 1979; Poschlod, 1993; Poschlod
& Jackel, 1993; Bekker et al., 1998a; Poschlod et al., 1998; Wäldchen et al., 2005) or by seed burial trials under natural conditions (Telewski & Zeevaart, 2002;
Long et al., 2008; Saatkamp et al., 2009; Abedi et al., 2014).
Soil seed bank persistence data were extracted from a compilation of Poschlod et al. (1998) that includes study results of calcareous grasslands studies (Kiefer, 1997), burial experiments (Poschlod, 1993) and the seasonal dynamics of diaspore bank and diaspore rain (Poschlod & Jackel, 1993). All these studies al- lowed a differentiated assignment into different cat- egories from transient to persistent (Thompson et al., 1997; Poschlod et al., 1998). Additional persistence data was provided by the longevity index (LI) values (Thompson et al., 1997), which integrate a series of soil seed bank observations which, however, has to be carefully interpreted (Saatkamp et al., 2009).
ARTIFICIAL AGEING
To investigate seed survival under storage conditions we applied an artificial ageing test using hermetical- ly sealed boxes with high humidity (40 %) at elevated temperature, according to the standardized protocol of Newton et al. (2009). Probert’s (2009) screening of 195 species indicated a correlation between survival under rapid ageing and under gene bank conditions.
Seed viability equations of rapid artificial ageing (Ellis
& Roberts, 1980; Liu et al., 2008; Probert et al., 2009) are good approaches to predict the decline of seed viability.
dosperm proportion (Walters et al., 2005b; Probert et al., 2009; Mondoni et al., 2011; Merritt et al., 2014) and physical dormancy (Merritt et al., 2014) emerged as indicators for seed longevity. Gained knowledge has great implications for re-collection and re-testing strategies in ex situ conservation.
AIM OF THE THESIS AND EXPERI- MENTAL APPROACH
The key elements that are addressed in this thesis are:
(A) Phylogeography of calcareous grassland species on the example of Sanguisorba minor Scop. (B) Im- portance of seed traits on viability detection as well as ex situ and in situ seed survival and (C) prospects of seeds for conservation of calcareous grasslands.
(D) Significance of X-ray analysis as a tool for reliable non-destructive viability detection. (E) Combining these topics, the aim of this thesis is to elucidate the origin of species of rare and threatened calcareous grasslands and to provide tools for a successful pres- ervation of diversity via seeds.
To answer the issues of this thesis following scien- tific approaches were made: Phylogeographic study using AFLP (Chapter 2), X-ray analysis and tetrazolium test (Chapter 3 and 5), artificial ageing (Chapter 3), seed germination (Chapter 3 and 5), seed trait anal- ysis (Chapter 2, 3, 4 and 5), phylogenetic constraints (Chapter 3) and soil seed bank persistence analysis (Chapter 4).
PHYLOGEOGRAPHIC STUDY
Phylogeographic studies can survey assumptions of genetic differentiation below as well as above species level without being restricted to taxonomic precon- ceptions based on morphological divergence (Schaal et al., 1998; Hewitt, 2001). The dominant marker AFLP (Vos et al., 1995) method was selected to study Sanguisorba minor as it produces many loci over the whole genome and it is a highly preferable meth- od for the assignment of individuals to populations (Gaudeul et al., 2004). Furthermore, it has been suc- cessfully used to determine the postglacial history of plants (Schönswetter et al., 2005; Bylebyl et al., 2008;
Reisch, 2008).
To identify potential glacial refugia, besides ge- netic variation (Comes & Kadereit, 1998; Taberlet et al., 1998; Tzedakis et al., 2013), we calculated the ge- netic divergence (frequency-down-weighted marker values, DW) (Schönswetter & Tribsch, 2005) as the rarity of markers has become an important criteri- on (Schönswetter et al., 2005; Paun et al., 2008). To
SEED TRAITS
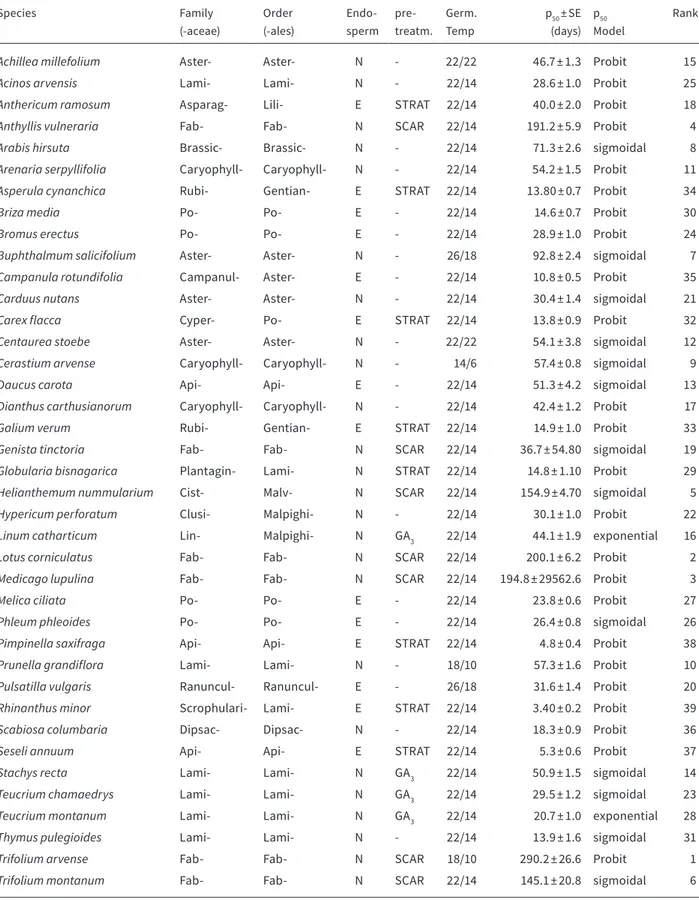
All chapters are connected to each other via seed traits: seed shape, seed mass, internal morphology (anatomy), seed dormancy, seed coat thickness and longevity index (LI). Seed shape and seed mass were measured and calculated (Bekker et al., 1998a) by hand, seed dormancy was determined via germina- tion tests, anatomy and seed coat thickness were as- sessed by X-ray examination. As the embryo (shape, development and size) and the storage tissues (pres- ence, absence and size of endosperm and/or perisp- erm) influenced the applicability of viability detection in both, X-ray and Tetrazolium testing, two seed clas- sifications were used to group the species, based on Martin (1946), revised and extended by Finch-Savage
& Leubner-Metzger (2006) and Meyer (2005). Longev- ity index data (Thompson et al., 1997) were sourced from the LEDA trait data base (Kleyer et al., 2008).
Moreover, external seed morphology played a cru- cial role for subspecies identification in Sanguisorba minor, which was investigated and compared with results from an excessive treatise of Nordborg (1967).
PHYLOGENETIC CONSTRAINTS
To correctly assess the influence of seed traits on the longevity of calcareous grassland species (Chapter 3), we used three phylogenetic comparative methods, to avoid misinterpretation of the results due to relat- edness of species (Chapter 3). Pagel’s λ (Pagel, 1999), Blomberg’s K (Blomberg et al., 2003) and Fritz & Pur- vis’ D (Fritz & Purvis, 2010) were calculated to reveal and account for phylogenetic signals.
VIABILITY DETECTION
To evaluate seed viability detection via X-ray, we compared the results with two accepted methods for viability detection, germination test and Topographi- cal Tetrazolium test (ISTA, 2003; AOSA, 2010a).
Seeds were germinated in climate chambers on moist filter paper, at different germination conditions (constant or alternating temperatures, with or with- out pre-treatments like stratification or scarification).
The Tetrazolium test is based on a chemical stain- ing reaction of seeds (Moore, 1973; Elias et al., 2012).
Due to the activity of dehydrogenase enzymes during respiration, in viable seed tissues, colourless tetra- zolium changes into a red dye known as formazan. To make viability determinations, the intensity and pat- tern of the staining as well as the physical condition of associated seed structures are evaluated. For this evaluation a certain knowledge of seed and seedling
structures (e.g. shape and location of the embryo, type of storage tissues, nature of seed coats) and experience in differentiating normal and abnormal seeds is required.
The principle of X-ray testing is that X-rays are ab- sorbed differently depending on the thickness and/
or density of the seed tissue. The internal structures were subsequently digitally visualized as mono- chrome images and interpreted. Like the Tetrazolium test the X-ray test demands a certain expertise to in- terpret the results accurately. We differentiated the surveyed seeds as viable and non-viable, adopting ISTA rules on Tetrazolium testing (ISTA, 1999).
THESIS OUTLINE
Central Europe has to counter rapid habitat and spe- cies decline and still the spatial origin of many spe- cies is unexplored. The importance of seeds and their storage in ex situ facilities has become an object for threatened and endangered plant species. This thesis was compiled simultaneously to the establishment of the Genbank Bayern Arche (Tausch et al., 2015), a federal state ex situ seed bank project for threatened and endangered plant species. It comprises various aspects that are related to basic phylogeographic research and the preservation of endangered plant species and habitats on the example of species from calcareous grasslands.
Chapter 2 deals with the postglacial spread of a common calcareous grassland species, Sanguisor- ba minor. By means of molecular analysis (AFLP) a survey across the whole species range provides the opportunity to reveal migration routes after the last glaciation. Seed morphology, the main determinant of subspecies of the morphologically extremely varia- ble species was combined with the genetic structure.
Compared to seeds of domestic plants, seeds of wild plant species are poorly explored. In particular, they possess more complicated germination charac- teristics than breeds of cultivated species. We were interested in the practical use of seeds for conserva- tion purposes of calcareous grasslands. Using an arti- ficial ageing approach, in Chapter 3 we attempted to identify seed traits that can be associated with seed ageing and ex situ storage. By investigating in a single habitat, influences like climate differences that may occur and mask the significant traits, were eliminat- ed. Chapter 4 addresses the question whether ageing in soil and in ex situ storage of calcareous grassland species are correlated. We used longevity measures,
the soil seed bank persistence categories of Poschlod et al. (1998) and LI to elucidate the relationships. In addition, we attempted to illuminate the prospect of in situ and ex situ conservation under consideration of seed traits.
Due to uncontrolled environmental conditions, wild plant species produce seeds with strongly differ- ing seed qualities and widely unknown storage ability (Gardarin et al., 2010). Therefore, besides the investi- gation of suitable germination conditions, a reliable and preferably non-destructive detection of initial seed viability is necessary for successful storage. In Chapter 5 we investigated the performance of X-ray analysis to provide a tool for viability detection with- out destroying seeds. Comparative combined germi- nation-Tetrazolium tests were conducted for approv- al and seed traits were used to examine the efficiency of X-ray analysis to detect viability and germinability of fresh seeds.
Finally, Chapter 6 summarizes the importance of seeds considering plant origin and conservation of calcareous grasslands.
Towards the origin of Central European grasslands:
glacial and postglacial history of the Salad Burnet ( Sanguisorba minor Scop.)
ABSTRACT
Calcareous grasslands belong to the most species rich and endangered habitats in Europe. However, little is known about the origin of the species typically occurring in these grasslands. To identify the postglacial recolonization of the widespread calcar- eous grassland species Sanguisorba minor (Scop.) in Central Europe, we investigated the spatial genetic structure of 38 populations via AFLP. Moreover, we considered the correlation of subspecies distribution (seed morphology) and spatial genetic pat- terns with regard to the two subspecies minor and balearica.
Our study revealed significant differences in the level of genetic variation and the occurrence of rare fragments within populations of S. minor from different regions of the distribution range and a distinct separation of eastern and western lineages.
The analyses uncovered traditional southern but also cryptic northern refugia and point towards a broad fronted postglacial recolonization. The geographic distribu- tion of the investigated subspecies corresponded to known references of Nordborg (1967), but not entirely reflected the genetic patterns. Genetic similarity between south-eastern and south-western subsp. balearica populations was lower than be- tween northern subsp. minor and south-western subsp. balearica populations.
Based on the spatial genetic pattern we conclude that after the last glacial maxi- mum (LGM) S. minor recolonized Central Europe either from Iberia or northern glacial refugia in France, Belgium or Germany. The current situation of S. minor subspecies depicts either incomplete lineage sorting or the existence of secondary hybrid zones, which is differently expressed in neutral marker and morphological differentiation.
Our results highlight the importance of refugial areas for conservation of intraspecif- ic variation in calcareous grassland species.
K E Y W O R D S
AFLP, LGM, phylogeography, plant, rare markers, recolonization, refugia, seed mor- phology
2.1 INTRODUCTION
Apart from contemporary genetic exchange, histori- cal processes have strongly affected species’ current ranges as well as the genetic variation and structure of their populations (Comes & Kadereit, 1998; Schaal et al., 1998; Hewitt, 2000; Soubani et al., 2014).
Regarding the landscape history of Europe, paly- nological and pedoanthracological studies have con- tributed great knowledge about the history of grass- lands, but mostly by focusing on reforestation (e.g.
Ložek & Cílek, 1995; Poschlod et al., 2008; Dutoit et al., 2009; Hájková et al., 2011). Due to low availabili- ty of pollen records for herbaceous plants (Poschlod
& Baumann, 2010), the limited taxonomic power of pollen and the non-uniform processes of pollen dep- osition, such studies are only of indirect value for the reconstruction of the post-glacial distribution, abun- dance and history for many grassland species. It is known from several studies that small-scale natural grasslands have existed at preferable sites in the for- est-dominated landscape of the post-glacial period (Ellenberg, 1996; Svenning, 2002; Karlik & Poschlod, 2009; Hájková et al., 2011; Janišová et al., 2011; Poko- rný et al., 2015; Poschlod, 2015) and semi-natural grasslands have expanded at least since the Mesolith- ic–Neolithic transition, associated with (agricultural) activity of man (Hejcman et al., 2013; Poschlod, 2015).
Whereas most agricultural species are expected to have originated and spread by man from the Fertile Crescent and the Mediterranean region (Poschlod, 2015), the origin of temperate grassland species, whether dependent or independent of man, has been analysed in fewer studies, mainly focusing on steppe species (Hensen et al., 2010; Harter et al., 2015; Ka- jtoch et al., 2016; Meindl et al., 2016). By the use of molecular markers, comprehensive phylogeographic studies (Avise et al., 1987; Avise et al., 1998) have pro- vided knowledge about glacial refugia, long distance colonisations, fragmentations and isolations (Taber- let et al., 1998; Hewitt, 2001; Kadereit et al., 2004).
The Pleistocene was probably the most influential era for the composition of the present floras of the northern hemisphere. Advancing and receding ice sheets, changing temperatures and water availabili- ty caused retractions (during glacials) or expansions (during interglacials) of temperate plants and animals to areas with climatically favourable conditions. Es- pecially during the last glacial maximum (LGM), when Northern and Central Europe were covered either by a large ice shield or permafrost soil (Lang, 1994;
Ruddiman & Thomson, 2001). The vegetation of the interglacials may have resembled today’s flora com- position as at least the climate during interglacial
periods was similar to the present Holocene (Frogley
& Tzedakis, 1999). Temperate species in the western Palearctic are commonly regarded to have survived the glacials in refugia on southern Peninsulas, where the alleviated influence of the glacial cycles allowed long-term survival (Taberlet et al., 1998; Hewitt, 2000; Tzedakis et al., 2002; Hewitt, 2004). But recent phylogeographic studies have suggested additional northerly located microrefugia for temperate species within the steppe-tundra vegetation (Stewart & Lis- ter, 2001; Magri et al., 2006; Bhagwat & Willis, 2008;
Bylebyl et al., 2008; Tzedakis et al., 2013; Daneck et al., 2015). Climate modelling has supported these results (Ohlemüller et al., 2012; Boston et al., 2015).
Altogether, species have shown individual responses to climate change, depending on different dispersal abilities, refugia locations and post-glacial migra- tion trajectories (Stewart et al., 2010; Normand et al., 2011; Triponez et al., 2015).
It has been subject of debate, whether the time frames of the Quaternary climate oscillations were long enough to cause (allopatric) speciation or if they merely caused repeated range shifts and at most differentiation of isolated populations (Comes
& Kadereit, 1998; Kadereit et al., 2004). Potentially, a secondary contact of divergent populations might have caused a loss of beginning differentiation or speciation, resulting in stasis (Kadereit et al., 2004), or sympatric speciation due to hybridisation as out- come of secondary contact (Stebbins, 1984; Comes &
Kadereit, 1998). Moreover, it is often difficult to distin- guish between hybridization and incomplete lineage sorting in sympatrically distributed lineages (Sang
& Zhong, 2000), as these processes show very simi- lar phylogenetic signatures (Wendel & Doyle, 1998).
Incomplete lineage sorting is mainly observed in re- cently diverged populations that have retained and stochastically sorted ancestral polymorphisms (Mad- dison & Knowles, 2006). Especially due to a shorter life cycles of herbaceous plant species, more gener- ations have passed since recolonization started, they are expected to have responded more quickly to cli- mate changes than long-lived tree species (Comes &
Kadereit, 1998).
To date, phylogeographic studies on plants mainly focused on trees (e.g. Petit et al., 2003; Tzedakis et al., 2013; Havrdová et al., 2015), the majority of available studies on herbaceous plants were conducted either on forest or on (arctic-) alpine plant species. Only a limited set of recent studies have demonstrated the colonisation history and the origin of Central Europe- an calcareous grassland species after the LGM (Fjell- heim et al., 2006; Bylebyl et al., 2008; Meindl, 2012;
Sutkowska et al., 2013; Harter et al., 2015). This is sur-
prising, since the Central European calcareous grass- lands are among the most species-rich and highly endangered ecosystems (Poschlod & WallisDeVries, 2002; WallisDeVries et al., 2002). One reason for the high biodiversity lies in the fact that these grasslands are characterized by a transitional climate containing phytogeographic elements of continental, Mediterra- nean, Atlantic and Pannonian regions (Hejcman et al., 2013). While for sub-oceanic Festuca pratensis (Fjell- heim et al., 2006) and (sub-) Mediterranean Eryngi- um campestre (Bylebyl et al., 2008) a re-colonisation of Central Europe originating from south-western and (south-) eastern glacial refugia was proposed, continental steppe plants in Central Europe like Scorzonera purpurea (Meindl, 2012) are supposed to have originated only from south-eastern European regions. However, for sub-oceanic-subcontinental Corynephorus canescens (Harter et al., 2015) and oce- anic Hippocrepis comosa (Leipold et al., 2017) a mi- gration route from Western Europe to Central Europe was presumed. Some of these studies also supported the possibility of “cryptic” northern refugia (Stewart
& Lister, 2001) contributing to the explanation of con- temporary genetic structures and variations of these grassland species.
To detect the glacial and post-glacial history of the widespread Central European grassland species San- guisorba minor Scop. (Salad Burnet, Rosaceae), the present study investigates the genetic composition and structure of populations across Europe via AFLP (amplified fragment length polymorphism), which have been successfully used before to identify taxo- nomic relationships on different taxonomic levels (El Rabey et al., 2014; Wietsma et al., 2014; Reisch et al., 2015) and (post-)glacial history (Schönswetter et al., 2005; Bylebyl et al., 2008; Reisch, 2008; Daneck et al., 2015).
Phylogeographic studies analyse genetic differen- tiation both below and above species level without being restricted to taxonomic preconceptions based on morphological divergence (Schaal et al., 1998; He- witt, 2001). Yet genetic variation and differentiation can be reflected in morphological characters and molecular markers (Bateman et al., 2006; Kadereit
& Yaprak, 2008; Kropf, 2008; Scheepens et al., 2013).
Thus we additionally investigated the connection of phylogeographic pattern of neutral marker and mor- phological differentiation of the challenging morpho- logically variable plant species (Nordborg, 1967; Tutin et al., 1968; Dahlgren, 1995). Our study considers the two of three subspecies with distribution in Central and Southern Europe, subsp. minor (Scop.) and sub- sp. balearica (Bourg. ex Nyman) Muñoz Garm. & C.
Navarro, that can in fact be differentiated via seed
(hypanthia) morphology, but of which inhomoge- neous hybrid swarms and intermediate individuals due to hybridization have frequently been described (Nordborg, 1967; Tutin et al., 1968; Muñoz Garmendia
& Navarro, 1999).
We aimed to answer the following questions: (1) Where were putative glacial refugia of S. minor lo- cated and what were the post-glacial recolonization routes? (2) Does the genetic structure of S. minor re- flect its intraspecific morphological descriptions and the geographical distribution of the subspecies?
2.2 MATERIALS AND METHODS
SPECIES DESCRIPTION AND FIELD SAMPLING
The Salad Burnet, Sanguisorba minor (Rosaceae), is a regular element in dry, semi-dry grasslands or low- land hay meadows. It grows on waysides, railroad embankments, gravel, steep slopes and rocks up to 2200 m. The species is described as a suboceanic-sub- continental floristic element, which is widely distrib- uted in the Western, Central and Southern European, the Western Asian and the Northern African flora and has been introduced to large parts of Northern Amer- ica (Dahlgren, 1995).
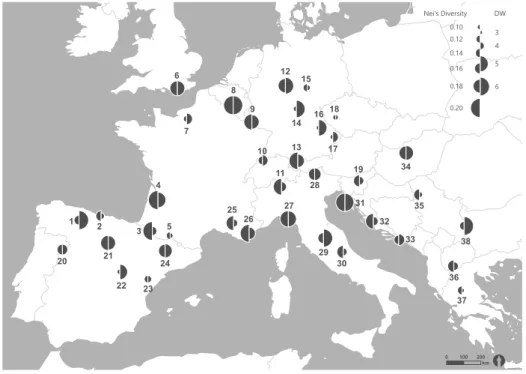
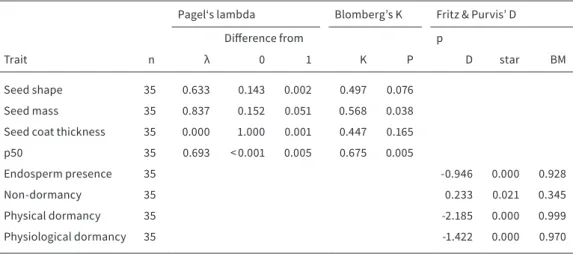
For the genetic analysis of S. minor, due to finan- cial limitations, we decided in favour of collecting a high number of populations in place of high sam- ple size within population. Fresh leaf material from 5 plant individuals of 38 populations in 14 countries (see Figure 2.1) was collected and immediately dried with silica gel. Where available, seeds (nutlets) were collected for a proper delimitation of subspecies.
S. minor subspecies are morphologically extreme- ly variable considering vegetative and generative traits (Tutin et al., 1968; Dahlgren, 1995; Muñoz Gar- mendia & Navarro, 1999). Along with the absence of reproductive barriers, taxon delimitation is difficult (Dahlgren, 1995) and the low correspondence of traits within a single plant or population has led to incon- sistent taxonomic designations. For instance, accord- ing to the online data base of Flora Iberica (2015), 36 heterotypic synonyms had been assigned alone to the subspecies S. minor subsp. minor.
In her extensive treatise, Nordborg (1967) differ- entiated five subspecies of S. minor: subsp. minor (Scop.), subsp. lasiocarpa (Boiss. & Hausskn.) Nord- borg, subsp. magnolii (Spach) Nordborg, subsp. mu- ricata (Spach) Nordborg and subsp. rupicola (Boiss.
&Reut.) Nordborg. The more recent classification in the Flora Iberica (Muñoz Garmendia & Navarro, 1999)
considers subsp. magnolii and subsp. rupicola as dis- tinct species S. verrucosa (Link ex G. Don) Ces. and S.
rupicola (Boiss. & Reut.) A. Braun & C.D. Bouché. and subsp. muricata as subsp. balearica (Bourg. ex Nyman) Muñoz Garm. & C. Navarro. In the investigated area of this study, covering the latitude from 8 °W to 22 °E and the longitude from 38 to 55 °N (see Table 2.1), two sub- species have been described (Nordborg, 1967; Tutin et al., 1968): subsp. minor and subsp. balearica. The remaining subsp. lasiocarpa occurs in temperate Asia was not investigated in this study. Moreover, as the subspecies possess no sterility barriers, intermediate forms that may be attributed to hybridization, can be observed between subsp. balearica and subsp. minor or subsp. balearica and S. verrucosa, which makes de- limitation partially difficult (Nordborg, 1967; Tutin et al., 1968; Dahlgren, 1995).
The investigated subspecies were differentiat- ed based on hypanthium morphology according to Nordborg (1967) and (Muñoz Garmendia & Navar- ro, 1999):1. S. minor subsp. minor: hypanthium with ridges, faces reticulate. 2. S. minor subsp. balearica:
hypanthium winged, faces with irregular sculptures.
We moreover differentiated two form series of subsp.
balearica according to the form series of subsp. mu- ricata of Nordborg (1967): A. platylopha-series: dis- tinctly winged hypanthia with irregularly structured faces, referred to as subsp. balearica (platylopha). B.
stenolopha-series: wings ridge-like and faces with reticulate sculptures, referred to as subsp. balearica (stenolopha). Co-occurring S. verrucosa can mainly be differentiated by its strongly verrucose or brain like hypanthium without ridges or wings. S. rupicola occurs beyond our study area in south-eastern Iberia and northern Morocco and is distinguished by habi- tus and ellipsoid hypanthium.
Based on this identification key, six populations (1, 2, 3, 5, 15 and 17) with available seeds were identified as subsp. minor (Table 2.1). Seven populations (25, 27, 29, 31, 35, 38) were assigned to as subsp. balearica (platylopha) and two populations (24 and 33) to sub- sp. balearica (stenolopha). Populations 21, 22 and 23 were composed of seeds assigned to subsp. baleari- ca (stenolopha) and to subsp. balearica (platylopha).
Population 26 contained subsp. balearica (stenolo- pha) and subsp. balearica (platylopha) individuals as well as individuals with wingless verrucose seeds assigned to S. verrucosa. Population 20 contained strongly intermediate verrucose winged seeds, which were referred to as balearica x verrucosa and S. verru- cosa-individuals.
S. minor subsp. minor occurs throughout most of the species’ range, mainly present in Central and Northern Europe. Subsp. balearica is native to South-
ern Europe and according to Tutin et al. (1968) nat- uralised in Central Europe. According to Nordborg (1967), in overlapping regions these subspecies are isolated either by altitude or ecological niche. In Southern Europe, subsp. minor is confined to alti- tudes above 1,000 m and replaced by subsp. balearica in altitudes below 1,000 m. Growing within one habi- tat, subsp. minor and subsp. balearica occupy differ- ent ecological niches but they occasionally occur to- gether (Nordborg, 1967). While subsp. minor grows on stony slopes with relatively few other species, subsp.
balearica grows in dense meadow vegetation. S. ver- rucosa can be found in the Mediterranean region and commonly occurs in macchia, garigue and phrygana (Nordborg, 1967).
DNA ISOLATION AND AFLP FINGERPRINTING
Genomic DNA was extracted from 15-20 mg dry leaf samples using the CTAB-method (Rogers & Bendich, 1994) following an adapted protocol outlined in Re- isch & Kellermeier (2007). The DNA contents of each sample were measured photometrically and adjusted at 7.8 ng/µl.
The dominant marker AFLP (Vos et al., 1995) method was selected as it produces many loci over the whole genome and it is a highly preferable meth- od for the assignment of individuals to populations (Gaudeul et al., 2004). The AFLPs were conducted adopting the protocol from Beckmann Coulter as de- scribed previously (Bylebyl et al., 2008; Reisch, 2008).
Following a wider pre-screening, for the subsequent selective DNA amplification two primer pairs pro- duced clear band patterns (M-CAC/D2-E-ACC, M-CAA/
D3-E-AGG, Beckman Coulter, Krefeld).The selective PCR products were appropriately diluted with 1x TE0.1 buffer for AFLP to receive optimal results with fluorescent dyes of the selective primers. Pelleted DNA was re-dissolved in a mixture of 24.8 μl sample loading solution and 0.2 μl CEQ Size Standard 400 (both Beckman Coulter). The fluorescence-labelled selective amplification products were separated by capillary gel electrophoresis on an automated se- quencer (CEQ 8000, Beckman Coulter). Raw data were collected and analysed with the CEQ Size Stand- ard 400 using the CEQ 8000 software (Beckman Coul- ter). Results were analysed in Bionumerics 6.6 (Ap- plied Maths). After manually scoring AFLP profiles, the presence or absence of bands for every particular fragment size and individual was transformed into a binary (1-0) matrix, serving as basis for all further analysis. For individuals with no clear banding signals AFLPs were repeated.
DATA ANALYSIS
Refugia are expected to possess higher genetic var- iation and can therefore be distinguished from sur- rounding recolonized regions, where recent disper- sal might have led to genetic depauperation due to founder effects (Hewitt, 1996; Comes & Kadereit, 1998; Taberlet et al., 1998; Tzedakis et al., 2013).
Therefore, within-population genetic variation as Nei´s Gene Diversity He (Nei, 1972), Shannon´s Infor- mation Index (SI) and the number and percentage of polymorphic loci (PL and PPL) were calculated using POPGENE v. 1.31 (Yeh et al., 1999).
Besides higher genetic variation, rare fragments have become an important criterion for identifying refugia (Schönswetter et al., 2005; Paun et al., 2008).
As measure of divergence, the rarity of markers by frequency-down-weighted marker values (DW) was calculated (Schönswetter & Tribsch, 2005) with the r-script AFLPdat (Ehrich, 2006) in R v.3.1.1 (Develop- ment Core Team, 2014). The value of DW is expected to be high in long-term isolated populations (Paun et al., 2008) where rare markers should accumulate due to mutations whereas newly established populations are expected to exhibit low values, thus DW values as- sist in distinction between old vicariance from recent dispersal (Schönswetter & Tribsch, 2005). According to Paun et al. (2008) rare fragments (DW values) are better indicators for locating glacial refugia than pat- terns of genetic diversity, which rather mirror con- temporary processes like connectivity of populations and population sizes. He and DW values were plotted onto the geographic coordinates of the sample loca- tions.
Single He, SI, PPL and DW values of each popula- tion were opposed to the average of all populations using alternative one sample t-tests in order to cate- gorize them as below (↓) or above average (↑) in R (R Core Team, 2013).
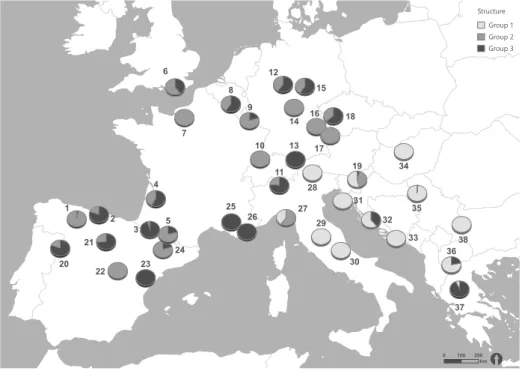
To survey the existence of a genetic structure within all collected populations of Sanguisorba mi- nor, a Bayesian cluster analysis in STRUCTURE v 2.3 was performed (Pritchard et al., 2000, 2009). Assum- ing that all individuals originate from one population and based on the band frequencies in multiple loci, the program calculates a k value by multiple Markov chain Monte Carlo (MCMC) algorithm, an estimate of the number of genetically related groups in the data set. Individuals are assigned to one or several groups, unbiased by their original population. The no admix- ture ancestry and correlated allele frequency model was used to investigate k from 2 to 40, performing a burn-in period of 10,000 followed by 10,000 iterations with 10 replicate runs. Δk was calculated to assess the most likely number of groups following the method
of Evanno et al. (2005). The results were plotted onto the geographic coordinates of the sample locations.
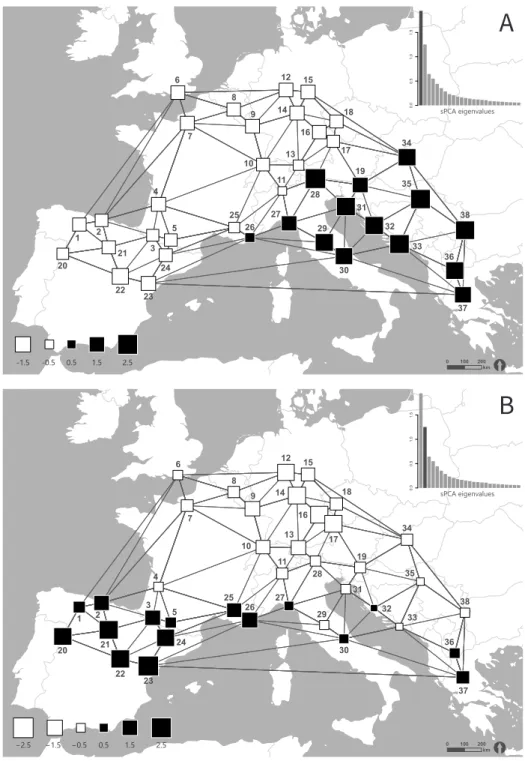
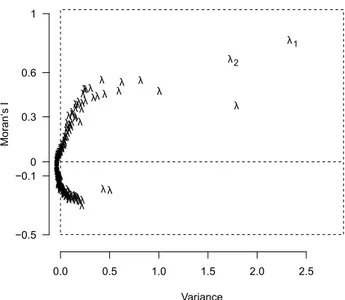
To identify geographic patterns in our data set we performed a spatial Principal Component Analysis (sPCA) using the package adegenet (Jombart et al., 2008) in R v.3.1.1 (Development Core Team, 2014). Ge- ographical coordinates of each population originally recorded in the reference system WGS 1984 were pro- jected to ETRS 1989 LCC. In order to avoid identical coordinates of individuals belonging to one popula- tion, the coordinates were modified by random shifts by the smallest possible factor of 0.5. Geographical data were used to generate a spatial weighting ma- trix that contains all spatial proximity information, derived from Delaunay triangulation as connection network. Moran’s I (Moran, 1948) was then calculat- ed to measure the spatial structure in the band fre- quencies of AFLP data. Moran’s I ranges from + 1 to -1, indicating a strong positive or negative spatial auto- correlation, respectively. In case of a positive spatial autocorrelation, a global structure in the data can be assumed, whereas negative values indicate a lo- cal structure and zero a totally random pattern. For the assessment and interpretation of local and glob- al structures, a screeplot was drawn by plotting the variance of the sPCA against Moran’s I. To statistically test for presence of spatial structures, Monte Carlo tests were performed using 9999 permutations. The sPCA-screeplot revealed an apparent differentiation of the eigenvalues of the first and the second global scores λ1 and λ2 in terms of geographical and genet- ic variance and a significant global (p < 0.001) but no local (p = 1) spatial structure (Monte-Carlo test struc- ture).The genetic differentiation of the principal com- ponents was therefore plotted for the first two global scores λ1 and λ2 against geographical coordinates.
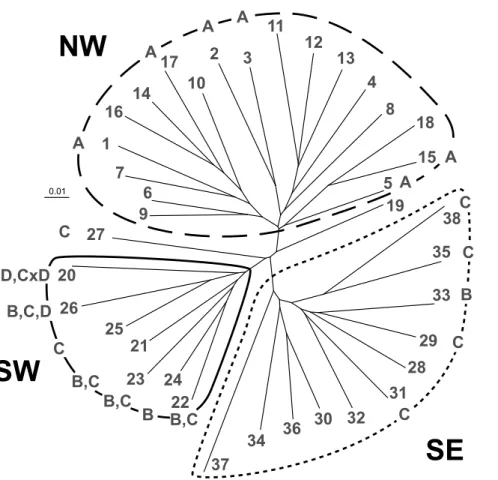
Moreover, we performed a cluster analysis based on the 38 studied populations of S. minor in FAMD v.1.30 (Schlueter & Harris, 2006) using Cavalli-Sforza
& Edwards chord distances and Neighbour Joining (NJ). The unrooted tree was displayed with Tree View (Page, 1996).
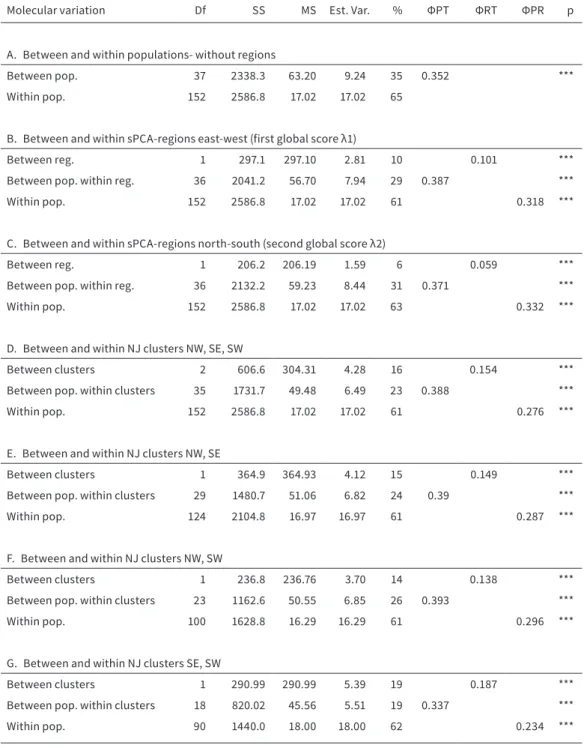
To investigate the variation within and between the surveyed populations and to quantify the differ- entiation between regions, we performed analyses of molecular variance (AMOVA, Excoffier et al., 1992), using GENALEX v6.5 (Peakall & Smouse, 2012), using resultant sPCA-groups and NJ-clusters as regions.
Based on Euclidean pairwise genetic distances be- tween the individuals (ΦPR), populations (ΦPT) and regions (ΦRT), the sums of squares were calculated (SSWP) and divided by the degrees of freedom (SS- WP/n-1).He and DW values within detected regions
were additionally compared using ANOVAs and sub- sequent Tukey-HSD-tests in R (R Core Team, 2013).
CORRELATION BETWEEN GENETIC PAT- TERNS AND HYPANTHIUM MORPHOLOGY
To combine the genetic patterns with the morphol- ogy of hypanthia (subspecies delimitation), the sub- species (subsp. minor, subsp. balearica and balearica x verrucosa) were presented graphically on the un- rooted NJ tree.
2.3 RESULTS
The AFLP analysis of 190 individuals with two prim- er combinations resulted in 166 fragments (D2: 97, D3: 69 fragments), ranging between 60 and 420bp, of which 94.58 % were polymorphic. Nei’s Gene Di- versity (He) ranged between 0.06 and 0.22 (mean 0.16 ± 0.01), Shannon Index (SI) between 0.09 and 0.33 (mean 0.23 ± 0.01) and the percentage of polymor- phic loci (PPL) between 16.87 % and 57.83 % (mean 41.47 ± 1.56, Table 2.1, Figure 2.1). Firstly, some of the most diverse populations were located north of the southern peninsulas in Belgium (population 08:
PPL = 57.8 %, He = 0.22 ± 0.21, SI = 0.33 ± 0.30), the Pyr- enees (population 03: PPL = 51.8 %, He = 0.19 ± 0.21, SI = 0.29 ± 0.30), western France (population 04:
PPL = 51.2 %, He = 0.22 ± 0.22, SI = 0.31 ± 0.31), Southern Germany (population 13: PPL = 48.2 %, He = 0.19 ± 0.21, SI = 0.28 ± 0.31) and Switzerland (population 11: PPL = 48.8 %, He = 0.19 ± 0.21, SI = 0.28 ± 0.30). Similar high levels of genetic diversity were also found in Southern France (population 26:
PPL = 53.0 %, He = 0.19 ± 0.20, SI = 0.29 ± 0.29) and on the southern peninsulas in Croatia (population 31:
PPL = 48.2 %, He = 0.19 ± 0.22, SI = 0.28 ± 0.31), Gulf of La Spezia (population 27: PPL = 46.4 %, He = 0.19 ± 0.22, SI = 0.27 ± 0.31) and northern Spain (population 21:
PPL = 50.0 %, He = 0.18 ± 0.21, SI = 0.27 ± 0.29). Accord- ingly, populations with the lowest diversity were located as well north of as on the southern penin- sulas, e.g. in Germany (population 16: PPL = 17.5 %, He = 0.06 ± 0.14, SI = 0.09 ± 0.21 and population 17:
PPL = 16.9 %, He = 0.06 ± 0.15, SI = 0.09 ± 0.21), the Czech Republic (population 18: PPL = 28.9 %, He = 0.10 ± 0.17, SI = 0.15 ± 0.25) or in central Spain (population 22:
PPL = 25.9 %, He = 0.10 ± 0.18, SI = 0.15 ± 0.26).
DW values ranged between 3.07 and 7.15 (mean 4.66 ± 0.14). The lowest DW values were located in Greece (population 37: DW = 3.07) and in the Czech Republic (population 18: DW = 3.32), the highest in Belgium (population 08: DW = 7.15) and in northern
Spain (population 01: DW = 7.12). Significantly high- er DW values than on average were found in Atlantic regions of northern Spain and western France (popu- lation 01: DW = 7.12 and population 04: DW = 4.97), in Mediterranean regions at the Gulf of La Spezia (popu- lation 27: DW = 5.10, Italy), Central Italy (population 29:
DW = 5.85) and north-western Croatia (population31:
DW = 5.71), in the Continental region of south-eastern Serbia (population 38: DW = 6.13) and in Sub-ocean- ic-subcontinental regions of Wallonia (population 08:
DW = 7.15, Belgium), North Rhine-Westphalia (popula- tion 12: DW = 5.14, Germany), Lower Franconia (popu- lation 14: DW = 5.31, Germany) and Upper Palatinate (population 16: DW = 5.13, Germany).
The results with spatial reference indicated a strong separation of the investigated area in an east- ern and western lineage or a north-western (NW), south-western (SW) and south-eastern (SE) lineage (see Figure 2.2, Figure 2.3). Bayesian cluster analysis conducted with STRUCTURE assigned the investigat- ed individuals to three distinct genetic groups (k = 3, appendix Figure 2.5). Figure 2.2 shows an unambig- uous placement of group 1 individuals into popu- lations of the south-eastern study area and a com- bination of group 2 and 3 genotypes in the centre, northwest and southwest of the study area. Popula- tions involving only group 1 genotypes were located in Southeast Europe (Greece, Republic of Macedonia, Serbia), southeast Central Europe (Croatia, Hunga- ry, Slovenia), the Apennines and southern Alps in It- aly. Exceptions from the almost genetically uniform south-eastern study area were population 27 (Italy), containing additional genotypes assorted to group 2, populations 32 (Croatia), 36 (Republic of Macedonia), 37 (Greece), containing also genotypes assorted to group 3 and population 19 (Slovenia) with genotypes assorted to all three groups. Group 2 and 3 individu- als occurred in varying proportions in populations of the Iberian Peninsula (Spain), north-western Europe (South England, France, Belgium) and Central Europe (Germany, Switzerland, Czech Republic).
An even clearer east-west division appeared in the sPCA analysis (first global score λ1, Figure 2.3A, ap- pendix Figure 2.6). Populations in the south-western (Iberian Peninsula) and the central study area (France, Great Britain, Belgium, Germany, Switzerland and Czech Republic) were separated from populations located south-east of the Alps in the eastern study area (Italy, Balkan Peninsula, Greece, Hungary). The weaker second global score λ2 presented a distinc- tion between most Mediterranean populations (all populations on the Iberian Peninsula and in Southern France, population 27 and 30 in Italy, population 37 in Greece and population 36 in the Republic of Mac-
edonia and population 32 in Croatia) and all popula- tions north and east of the Mediterranean region plus populations 29 (Italy), 31 and 33 (both Croatia; Figure 2.3B).
The neighbour joining tree generated by FAMD revealed three distinct clusters, corresponding their spatial distribution, embracing populations in the north-western (NW), south-western (SW) or south-eastern (SE) study area (Figure 2.4). Popula- tions mainly originating from north-western and Cen- tral Europe (England, France excluding Mediterranean but including Pyrenees, Belgium, Germany, Switzer- land, Czech Republic and Slovenia) were assigned to cluster NW. Cluster SW represents populations from the western Mediterranean region (Southern France, North-western Italy and Iberia excluding the north- ernmost populations) and cluster SE eastern Mediter- ranean and eastern European populations. It was dif- ficult to assign population 27 (Italy) and 19 (Slovenia) to either cluster.
The distinct south-eastern populations of the sPCA (first global score λ1) were entirely congruent with the cluster SE of the NJ tree, except from pop- ulation 26 (Italy). Regarding the second global score λ2 of the sPCA, the NJ tree and sPCA produced slight- ly different results concerning the affiliation of the Iberian Peninsula. While in the NJ tree, the northern Spanish and Pyrenean populations were assigned to the northern cluster (NW), the sPCA separated all populations located on the Iberian Peninsula and the Pyrenees from all northern populations.
The analysis of molecular variance (AMOVA) en- compassing all populations without further classi- fication revealed a total molecular variance of 65 % within and 35 % among populations (Table 2.2). Con- sidering the sPCA-groups, the molecular variation be- tween northern and southern populations was 6 %, whereas the variation between eastern and western populations was 10 %. The highest genetic variation of 16 % was detected between the three NJ clusters, NW, SW and SE, with a differentiation between the clusters SE and SW of 19 % and a lower differentiation between NW and SE as well as between NW and SW of 15 and 14 %, respectively. The mean genetic varia- tion (He) was not significantly different between the NJ clusters (NW, SW and SE; F = 0.499, N = 38, p = 0.611) and the sPCA-regions north-south (F = 0.377, N = 38, p = 0.543) or east-west (F = 1.532, N = 38, p = 0.224).
Equally, the mean DW values did not differ significant- ly between the NJ clusters (F = 0.089, n = 38, p = 0.915) and the sPCA-regions north-south (F = 2.249, n = 38, p = 0.142) or east-west (F = 0.028, n = 38, p = 0.867).
Comparing phylogeographic patterns with sub- species assignment of S. minor, Figure 2.4 shows that all six populations of subsp. minor (populations 1, 2, 3, 5, 15 and 17) were placed within the NJ cluster NW.
Homogenous subsp. balearica (platylopha) popula- tions were found in cluster SW (populations 25) and in cluster SE (populations 27, 29 ,31 ,35 ,38). The two subsp. balearica (stenolopha) populations (popula- tion 24 and 33) occurred in the two southern clusters SE and SW. Inhomogeneous populations composed of the subspecies subsp. balearica (stenolopha) and
[
0 100 200 km
3 4 5
6 DW Nei‘s Diversity
0.10 0.12 0.14 0.16 0.18
0.20
7 8
9
10 11
3 5 4
1 2
6
38 14
13
36 25
20
19 18
24
15
16
21
22 23
17
37 33
31 32 27
29 30 28
26
34
35 12
FIGURE 2.1 Nei’s gene diversity (He) and frequency-down-weight- ed marker values (DW) of San- guisorba minor populations in Eu- rope surveyed via AFLP. Different circle sizes indicate different abso- lute values.
subsp. balearica (platylopha; populations 21, 22 and 23) were only found in cluster SW and were placed on the same branch together with the subsp. balearica
(stenolopha) population 24. At the same time, the only subsp. balearica (stenolopha) population 33 within the cluster SE was placed on the same branch
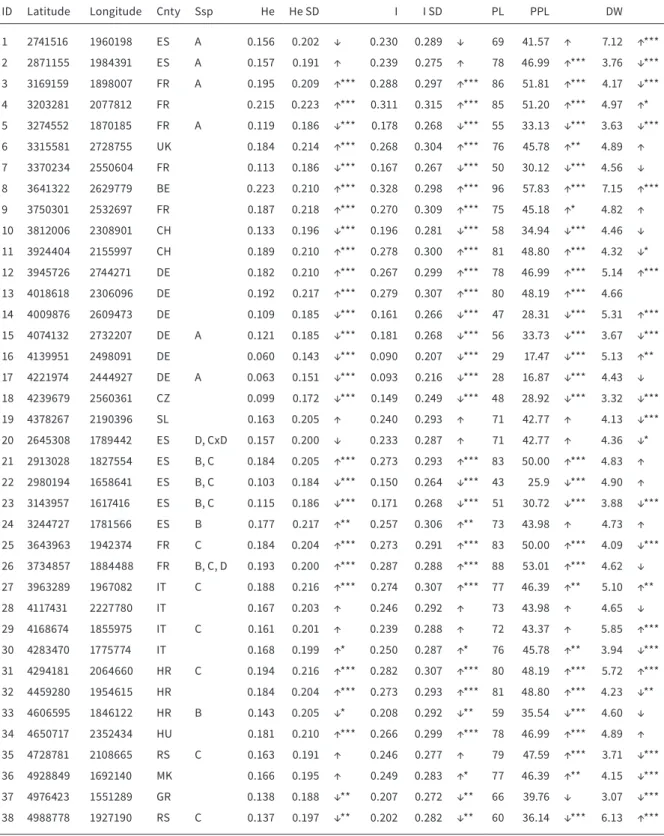
ID Latitude Longitude Cnty Ssp He He SD I I SD PL PPL DW
1 2741516 1960198 ES A 0.156 0.202 ↓ 0.230 0.289 ↓ 69 41.57 ↑ 7.12 ↑***
2 2871155 1984391 ES A 0.157 0.191 ↑ 0.239 0.275 ↑ 78 46.99 ↑*** 3.76 ↓***
3 3169159 1898007 FR A 0.195 0.209 ↑*** 0.288 0.297 ↑*** 86 51.81 ↑*** 4.17 ↓***
4 3203281 2077812 FR 0.215 0.223 ↑*** 0.311 0.315 ↑*** 85 51.20 ↑*** 4.97 ↑*
5 3274552 1870185 FR A 0.119 0.186 ↓*** 0.178 0.268 ↓*** 55 33.13 ↓*** 3.63 ↓***
6 3315581 2728755 UK 0.184 0.214 ↑*** 0.268 0.304 ↑*** 76 45.78 ↑** 4.89 ↑
7 3370234 2550604 FR 0.113 0.186 ↓*** 0.167 0.267 ↓*** 50 30.12 ↓*** 4.56 ↓
8 3641322 2629779 BE 0.223 0.210 ↑*** 0.328 0.298 ↑*** 96 57.83 ↑*** 7.15 ↑***
9 3750301 2532697 FR 0.187 0.218 ↑*** 0.270 0.309 ↑*** 75 45.18 ↑* 4.82 ↑
10 3812006 2308901 CH 0.133 0.196 ↓*** 0.196 0.281 ↓*** 58 34.94 ↓*** 4.46 ↓
11 3924404 2155997 CH 0.189 0.210 ↑*** 0.278 0.300 ↑*** 81 48.80 ↑*** 4.32 ↓*
12 3945726 2744271 DE 0.182 0.210 ↑*** 0.267 0.299 ↑*** 78 46.99 ↑*** 5.14 ↑***
13 4018618 2306096 DE 0.192 0.217 ↑*** 0.279 0.307 ↑*** 80 48.19 ↑*** 4.66
14 4009876 2609473 DE 0.109 0.185 ↓*** 0.161 0.266 ↓*** 47 28.31 ↓*** 5.31 ↑***
15 4074132 2732207 DE A 0.121 0.185 ↓*** 0.181 0.268 ↓*** 56 33.73 ↓*** 3.67 ↓***
16 4139951 2498091 DE 0.060 0.143 ↓*** 0.090 0.207 ↓*** 29 17.47 ↓*** 5.13 ↑**
17 4221974 2444927 DE A 0.063 0.151 ↓*** 0.093 0.216 ↓*** 28 16.87 ↓*** 4.43 ↓
18 4239679 2560361 CZ 0.099 0.172 ↓*** 0.149 0.249 ↓*** 48 28.92 ↓*** 3.32 ↓***
19 4378267 2190396 SL 0.163 0.205 ↑ 0.240 0.293 ↑ 71 42.77 ↑ 4.13 ↓***
20 2645308 1789442 ES D, CxD 0.157 0.200 ↓ 0.233 0.287 ↑ 71 42.77 ↑ 4.36 ↓*
21 2913028 1827554 ES B, C 0.184 0.205 ↑*** 0.273 0.293 ↑*** 83 50.00 ↑*** 4.83 ↑ 22 2980194 1658641 ES B, C 0.103 0.184 ↓*** 0.150 0.264 ↓*** 43 25.9 ↓*** 4.90 ↑ 23 3143957 1617416 ES B, C 0.115 0.186 ↓*** 0.171 0.268 ↓*** 51 30.72 ↓*** 3.88 ↓***
24 3244727 1781566 ES B 0.177 0.217 ↑** 0.257 0.306 ↑** 73 43.98 ↑ 4.73 ↑
25 3643963 1942374 FR C 0.184 0.204 ↑*** 0.273 0.291 ↑*** 83 50.00 ↑*** 4.09 ↓***
26 3734857 1884488 FR B, C, D 0.193 0.200 ↑*** 0.287 0.288 ↑*** 88 53.01 ↑*** 4.62 ↓ 27 3963289 1967082 IT C 0.188 0.216 ↑*** 0.274 0.307 ↑*** 77 46.39 ↑** 5.10 ↑**
28 4117431 2227780 IT 0.167 0.203 ↑ 0.246 0.292 ↑ 73 43.98 ↑ 4.65 ↓
29 4168674 1855975 IT C 0.161 0.201 ↑ 0.239 0.288 ↑ 72 43.37 ↑ 5.85 ↑***
30 4283470 1775774 IT 0.168 0.199 ↑* 0.250 0.287 ↑* 76 45.78 ↑** 3.94 ↓***
31 4294181 2064660 HR C 0.194 0.216 ↑*** 0.282 0.307 ↑*** 80 48.19 ↑*** 5.72 ↑***
32 4459280 1954615 HR 0.184 0.204 ↑*** 0.273 0.293 ↑*** 81 48.80 ↑*** 4.23 ↓**
33 4606595 1846122 HR B 0.143 0.205 ↓* 0.208 0.292 ↓** 59 35.54 ↓*** 4.60 ↓
34 4650717 2352434 HU 0.181 0.210 ↑*** 0.266 0.299 ↑*** 78 46.99 ↑*** 4.89 ↑
35 4728781 2108665 RS C 0.163 0.191 ↑ 0.246 0.277 ↑ 79 47.59 ↑*** 3.71 ↓***
36 4928849 1692140 MK 0.166 0.195 ↑ 0.249 0.283 ↑* 77 46.39 ↑** 4.15 ↓***
37 4976423 1551289 GR 0.138 0.188 ↓** 0.207 0.272 ↓** 66 39.76 ↓ 3.07 ↓***
38 4988778 1927190 RS C 0.137 0.197 ↓** 0.202 0.282 ↓** 60 36.14 ↓*** 6.13 ↑***
TABLE 2.1 Genetic variation within populations of Sanguisorba minor based on AFLP fragments. ID (population identifier), Cnty (country code according to ISO 3166), Ssp (Subspecies assignment of 19 S. minor populations based on hypanthium morphology. A:
subsp. minor, B: subsp. balearica (stenolopha), C: subsp. balearica (platylopha), D: S. verrucosa. He (Nei’s gene diversity), SI (Shan- non-Index), PL (number of polymorphic loci), PPL (Percentage of polymorphic loci) and DW (rarity value), ↓ (values below average),
↑ (values above average). Significance levels: *: p < 0.05, **: p < 0.01, ***: p < 0.001. Sample size of each population 5, total number of sampled individuals 190 and total number of loci 166.