General rights
Copyright and moral rights for the publications made accessible in the public portal are retained by the authors and/or other copyright owners and it is a condition of accessing publications that users recognise and abide by the legal requirements associated with these rights.
Users may download and print one copy of any publication from the public portal for the purpose of private study or research.
You may not further distribute the material or use it for any profit-making activity or commercial gain
You may freely distribute the URL identifying the publication in the public portal
If you believe that this document breaches copyright please contact us providing details, and we will remove access to the work immediately and investigate your claim.
Molecular ontogeny of larval immunity in European eel at increasing temperatures
Miest, Joanna J.; Politis, Sebastian Nikitas; Adamek, Mikolaj; Tomkiewicz, Jonna; Butts, Ian A. E.
Published in:
Fish and Shellfish Immunology
Link to article, DOI:
10.1016/j.fsi.2018.12.048
Publication date:
2019
Document Version Peer reviewed version Link back to DTU Orbit
Citation (APA):
Miest, J. J., Politis, S. N., Adamek, M., Tomkiewicz, J., & Butts, I. A. E. (2019). Molecular ontogeny of larval immunity in European eel at increasing temperatures. Fish and Shellfish Immunology, 87, 105-119.
https://doi.org/10.1016/j.fsi.2018.12.048
Molecular ontogeny of larval immunity in European eel at increasing temperatures Joanna J. Miest, Sebastian N. Politis, Mikolaj Adamek, Jonna Tomkiewicz, Ian A.E.
Butts
PII: S1050-4648(18)30854-4
DOI: https://doi.org/10.1016/j.fsi.2018.12.048 Reference: YFSIM 5815
To appear in: Fish and Shellfish Immunology Received Date: 9 August 2018
Revised Date: 12 November 2018 Accepted Date: 23 December 2018
Please cite this article as: Miest JJ, Politis SN, Adamek M, Tomkiewicz J, Butts IAE, Molecular ontogeny of larval immunity in European eel at increasing temperatures, Fish and Shellfish Immunology (2019), doi: https://doi.org/10.1016/j.fsi.2018.12.048.
This is a PDF file of an unedited manuscript that has been accepted for publication. As a service to our customers we are providing this early version of the manuscript. The manuscript will undergo copyediting, typesetting, and review of the resulting proof before it is published in its final form. Please note that during the production process errors may be discovered which could affect the content, and all legal disclaimers that apply to the journal pertain.
M AN US CR IP T
AC CE PT ED
1
Molecular ontogeny of larval immunity in European eel at increasing temperatures 2
3
Running title: Immunity in European eel larvae 4
5
Joanna J. Miest1,2,ǂ*, Sebastian N. Politis3,ǂ, Mikolaj Adamek4,Jonna Tomkiewicz3 and Ian A.E.
6
Butts3,5 7
8
1 Evolutionary Ecology of Marine Fish, GEOMAR Helmholtz Centre for Ocean Research, 24148 9
Kiel, Germany 10
2 Department of Life and Sport Sciences, University of Greenwich, Chatham Maritime, Kent, ME4 11
4TB, UK 12
3 National Institute of Aquatic Resources, Technical University of Denmark, 2800 Kgs. Lyngby, 13
Denmark 14
4 Fish Disease Research Unit, Centre of Infectious Diseases, University of Veterinary Medicine 15
Hannover, 30559Hannover, Germany 16
5School of Fisheries, Aquaculture and Aquatic Sciences, Auburn University, Auburn, Alabama, 17
36849, USA 18
19
ǂ These authors contributed equally to the manuscript 20
* Corresponding author’s email: j.j.miest@gre.ac.uk 21
22
M AN US CR IP T
AC CE PT ED
Abstract:
23
Temperature is a major factor that modulates the development and reactivity of the immune system.
24
Only limited knowledge exists regarding the immune system of the catadromous European eel, 25
Anguilla anguilla, especially during the oceanic early life history stages. Thus, a new molecular 26
toolbox was developed, involving tissue specific characterisation of 3 housekeeping genes, 9 genes 27
from the innate and 3 genes from the adaptive immune system of this species. The spatial pattern of 28
immune genes reflected their function, e.g. complement component c3 was mainly produced in liver 29
and il10 in the head kidney. Subsequently, the ontogeny of the immune system was studied in 30
larvae reared from hatch to first-feeding at four temperatures, spanning their thermal tolerance 31
range (16, 18, 20, and 22°C). Expression of some genes (c3 and igm) declined post hatch, whilst 32
expression of most other genes (mhc2, tlr2, il1β, irf3, irf7) increased with larval age. At the optimal 33
temperature, 18°C, this pattern of immune-gene expression revealed an immunocompromised phase 34
between hatch (0 dph) and teeth-development (8 dph). The expression of two of the studied genes 35
(mhc2, lysc) was temperature dependent, leading to increased mRNA levels at 22°C. Additionally, 36
at the lower end of the thermal spectrum (16°C) immune competency appeared reduced, whilst 37
close to the upper thermal limit (22°C) larvae showed signs of thermal stress. Thus, protection 38
against pathogens is probably impaired at temperatures close to the critical thermal maximum 39
(CTmax), impacting survival and productivity in hatcheries and natural recruitment.
40 41
Key words (3-6):
42
Fish Larvae; Innate Immunity; Anguilla anguilla; Early Life History, Gene Expression;
43
Aquaculture; Climate change 44
45
1. Introduction:
46
With more than 34,000 species, teleost fish represent the largest class of vertebrates [1]. This 47
diversity reflects their successful adaption to a great variety of aquatic environments. However, 48
common to most species is an elevated natural mortality during early life [2]. Thus, subtle 49
differences in survivorship can cause large differences in annual offspring production [3]. This is 50
especially important for species that may spawn only once in a lifetime, such as the European eel 51
(Anguilla anguilla, Linnaeus 1758), as survival during early-life represents a substantial component 52
of variation in lifetime fitness. An increased understanding of the physical and biological factors 53
that influence mortality rates during these ‘critical’ developmental stages can enable aquaculture 54
M AN US CR IP T
AC CE PT ED
hatchery production, enhance recruitment predictions for fisheries, and aid in the conservation of 55
this critically endangered species [4].
56
Teleost fish possess both the innate and adaptive arm of the immune response, characteristic 57
to higher vertebrates [5]. However, evidence has accumulated that newly hatched fish larvae are 58
highly sensitive to pathogens as their immune system is not fully developed [6]. Marine fish larvae 59
are particularly vulnerable to pathogen-induced mortality as it can take up to three months until 60
their immune response is fully functional [7]. During this time, the larvae solely rely on the innate 61
arm of the immune system, which acts in a non-specific manner. During the first stages of larval 62
development (i.e. hatching, mouth opening, first-feeding) exposure to pathogens intensifies [8].
63
Knowledge of the development of the immune system is hence needed to design preventative 64
methods against pathogens such as the anguillid herpesvirus 1 (AngHV-1) and the parasite 65
Anguillicoloides crassus, which pose an important threat to the European eel [9], in order to prevent 66
losses in forthcoming aquaculture hatcheries. The European eel is a commercially high-value fish 67
species with a long tradition in European fisheries and fish farming. Recruitment and stock size of 68
European eel have decreased substantially in the last decades [10] and a European-wide 69
management strategy is being implemented, while efforts to establish hatchery technology for this 70
species are ongoing [11,12]. However, up-to-date farming as well as restocking of European eel 71
relies on wild-caught juveniles as the life-cycle has not been closed in captivity. It is therefore vital 72
that breeding-technologies and hatchery techniques are being established. Recent advances have 73
enabled the stable production of eggs and larvae, which allow the development and optimisation of 74
hatchery protocols [12,13].
75
76
During development organisms are influenced by extrinsic factors (e.g. temperature, 77
pathogens), intrinsic factors (e.g. genetic makeup), and their associated interactions [14,15].
78
Temperature is one of the main factors influencing marine ecosystems, as it defines the 79
geographical distribution of populations and affects the physiology of individual organisms at all 80
life stages [16]. Furthermore, physiological processes, and therefore development and survival, in 81
ectothermic organisms are generally controlled by the environmental temperature [17]. Here, early 82
life history stages are known to be particularly sensitive to temperature as they have a narrower 83
thermal tolerance window than juveniles or adults and thus are more profoundly affected by even 84
minor temperature changes and short heatwaves [18]. Moreover, temperature is a fundamental 85
modulator of the immune system of fish [19] and has been shown to affect immunity during fish 86
M AN US CR IP T
AC CE PT ED
early life history [20]. The consideration of temperature as an immunomodulatory factor is therefore 87
not only important in the development of hatchery technology of a species such as the European eel 88
in order to optimise offspring rearing protocols, but also in the light of environmental changes in the 89
natural habitat of the larval stages of this species. Here, warming temperatures of the ocean may 90
influence the recruitment of the critically endangered European eel [21,22].
91
Eels, i.e. Anguilliformes, are basal bony fish (Teleostei) which belong to the ancient 92
superorder of Elopomorpha, at the phylogenetic basis of Teleostei [23]. The current knowledge of 93
eel immunity has recently been reviewed [24]. Whilst the immune system of fish is well studied in 94
some model species, very little research has been conducted regarding the immune system of 95
Elopomorpha with their unique leptocephalus larvae. Research conducted on the immune system of 96
European and Japanese eels (A. japonica) has up to date focused on the cellular innate immune 97
response to infections and have rarely involved molecular studies [24]. For example, in Japanese eel 98
it has been shown that some immune factors (i.e. lectin) are present 8 days post-hatch (dph; rearing 99
temperature unknown), whilst the appearance of most immune organs occurs late during larval 100
development [25]. In this study, we aimed to elucidate certain aspects of the development of the 101
immune system in European eel larvae. Specifically, as part of the innate immune system we 102
investigated two complement components (c3 and c1qc), which aid microbial killing, phagocytosis, 103
inflammatory reactions, immune complex clearance, and antibody production (reviewed by [26]).
104
Moreover, we monitored gene expression of the antimicrobial protein C-type lysozyme (lysc), the 105
cytokines interleukin 10 (il10) and 1β (il1β), as well as tumor necrosis factor alpha (tnfα).
106
Cytokines aid both the innate and the acquired immune system by interacting with cells, ligands, 107
and receptors to activate cell-mediated immune responses [27]. IL-10 is an anti-inflammatory 108
cytokine whilst IL-1β expression leads to activation of lymphocytes and synthesis of acute phase 109
proteins and thus activation of the complement system [28]. Furthermore, TNF-α is involved in the 110
control and local restriction of infection. In lieu of measuring antiviral type 1 interferon expression, 111
we analysed interferon regulating factors 3 and 7 (irf3 and irf 7) as they have previously been 112
described for European eel [29]. Additionally, we analysed the expression of a pathogen recognition 113
receptor, the toll like receptor 2 (tlr2), which is suggested to recognize bacterial and fungal 114
pathogens in eel [30], while the adaptive immune response was studied using the major 115
histocompatibility complex II (mhc2), immunoglobulin M (igm) and the cluster of differentiation 3 116
(cd3). Here, MHC II is responsible for the presentation of antigens to adaptive immune cells and 117
thus the initiation of an adaptive immune response. This recognition ultimately leads to the 118
M AN US CR IP T
AC CE PT ED
destruction of the pathogen through the immune response [28]. Moreover, IgM is the first 119
immunoglobulin to be produced after activation of B cells and can then interact with the 120
complement component C1 to activate the classical complement pathway [28]. Last, CD3, a protein 121
complex, associated to the T-cell receptor and acting as co-receptor, is involved in the activation of 122
T-cells. Together, these immunological insights may be critical to close the life cycle in captivity 123
for this commercially high-value fish species within aquaculture, and to better understand potential 124
impacts of ocean warming on early life stages in nature.
125 126
This study therefore aimed to i) develop tools to specifically study innate (i.e. complement 127
components, antimicrobial peptides, cytokines) and adaptive (i.e. MHC II, immunoglobulin M) 128
immunity in European eel; ii) shed light on the molecular ontogeny of their immune system during 129
early larval development; and finally iii) investigate the interaction of immune gene expression with 130
temperature during early life history.
131 132
2. Material and methods:
133
In order to fulfil the above aims we carried out three independent studies. To develop the 134
molecular toolbox to study immune related genes, we characterised the tissue specific expression of 135
the studied genes (see 2.1) and their regulation in response to an AngHV-1 infection (see 2.2). For 136
the purpose of studying thermally modulated immune gene ontogeny, we carried out a study on eel 137
larvae, which analysed immune-related gene expression every 2 dph at 4 different temperatures (see 138
2.3). In all studies, gene expression was analysed using molecular methods (see 2.4).
139 140
2.1. Generation of tissue library from farmed immature eels 141
The tissue specific expression of the studied immune genes was investigated using three 142
immature female European eels at the yellow eel stage raised from the glass eel stage to a size of 58 143
± 1.6 cm and weight of 470 ± 39.7 g at a Danish commercial fish farm (Stensgård Eel Farm A/S).
144
The eels were euthanized by submersion in an aqueous solution of ethyl p-aminobenzoate 145
(benzocaine) at 20 mg L-1 (Sigma-Aldrich, Missouri, USA) and organ tissue samples dissected from 146
hind-gut, gills, head kidney, kidney, liver, skin, spleen, whole brain, heart, and muscle. Samples 147
were stored in RNA-later at -80°C until further use. For further processing see 2.4.
148
149
M AN US CR IP T
AC CE PT ED
2.2 AngHV-1 infection of Juvenile European eel tail explants 150
In addition to the tissue specific expression, we characterised the response of the targeted immune 151
genes to AngHV-1 infection. The alloherpesvirus AngHV-1 is a highly virulent infection agent and 152
considered the most significant viral threat to the eel population. The virus causes extensive 153
necrosis in the gills as well as necrotic lesions in the skin [31]. Here, we used an in vitro model to 154
study the immunological response to an AngHV-1 infection in compliance with the 3R rule. As the 155
in vivo infection system is not well established yet for AngHV-1 in European eel, we conducted the 156
infection using explants of the tail tissue. Tail tissues (~10 mm of the body end) were sampled from 157
10 euthanized (with 0.5g l-1 of MS-222) European glass eels during routine health checks at the 158
Veterinary University Hannover, Germany. The fish from which the explants had been collected 159
were confirmed to be AngHV-1 negative by qPCR described earlier [9]. The explants were 160
collected into PBS supplemented with 10 IU ml-1 penicillin, 100 mg ml-1 streptomycin, 100 mg ml-1 161
gentamycin, and 1 mg ml-1 amphotericin B (all Sigma), and thereafter placed on ice. Explants were 162
placed individually into the wells of 24 well tissue culture plates and 1 ml of culture medium 163
(medium 199 supplemented with 20% FCS, 10 IU ml-1 penicillin, 100 mg ml-1 streptomycin, 100 164
mg ml-1 gentamycin and 1 mg ml-1 amphotericin B [Sigma]) was added to each well. Explants were 165
incubated at 25°C in a humidified atmosphere containing 2% CO2. After 1 h, half of the explant 166
cultures (n = 5) were randomly infected by adding 10 µl of AngHV-1 virus suspension [32]. The 167
final concentration of the virus was 5 x 10⁵ TCID50 ml-1. Controls received 10 µl of uninfected 168
medium. After 48 h the explants were placed in RNA-later and stored in -80 °C until further 169
processing.
170
RNA was extracted from the tip of the tail as described above and diluted to a common 171
concentration of 30 ng µl-1 with HPLC water. RNA (250 ng) was transcribed to cDNA (-RT 172
controls were included) and expression in these samples were analysed using the qPCR Biomark™
173
HD system (Fluidigm) based on 96.96 dynamic arrays (GE chips) as described below in section 2.4.
174
Further analysis of gene expression was carried out according to the 2-∆∆Ct method, in relation to the 175
non-infected control [33]. Gene expression for these samples was normalised against the geometric 176
mean of rps18 and ef1 (= ∆ct) as these genes showed the highest stability (see 2.4).
177 178
2.3 Experimental broodstock management and offspring production 179
M AN US CR IP T
AC CE PT ED
Female silver eels were obtained from a freshwater lake, Vandet Sø, Denmark. Male eels 180
were obtained from Stensgård Eel Farm A/S.Females used for experiments (n = 4) had a mean (±
181
SEM) standard length and body weight of 65 ± 4 cm and 486 ± 90 g, respectively. Male eels (n = 182
11) had a mean (± SEM) standard length and body weight of 40 ± 3 cm and 135 ± 25 g, 183
respectively. Experiments were conducted at a DTU Aqua research facility located at Lyksvad Fish 184
Farm, Denmark. For detailed information on fish handling, maturation and strip spawning, as well 185
as gamete collection and fertilisation see [11,12,34]. The experimental protocol for the study was 186
approved by the Danish Animal Experiments Inspectorate, Ministry of Food, Agriculture and 187
Fisheries (permit number: 2012-15-2934-00458). All fish were handled in accordance with the 188
European Union regulations concerning the protection of experimental animals (EU Dir 2010/63).
189 190
2.3.1 Experimental conditions 191
Eggs from each female were fertilised by a milt pool from 4 males [11] to experimentally 192
create four parental crosses. In total, 11 males were used. Within 30 min post fertilization, ~500 193
floating zygotes per 100 mL, with a mean size (± SD) of 1.5 ± 0.1 mm (n = 4 females), were 194
distributed in replicated 600 mL flasks [182.5 cm2 sterile tissue culture flasks with plug seal caps 195
(VWR®)] [34]. Larvae were reared in thermal controlling incubators (MIR-154 Incubator, 196
Panasonic Europe B.V.) at five temperatures (16, 18, 20, 22, and 24 ± 0.1°C), with a salinity of 36 197
ppt. Seawater was 0.2 µm filtered, UV sterilized and supplemented with rifampicin and ampicillin 198
(each 50 mg L-1, Sigma-Aldrich, Missouri, USA) [35]. Rearing of embryos and larvae took place in 199
darkness, while handling and sampling was performed under low intensity light conditions (< 2.2 200
µmol m-2 s-1) [36]. Light and salinity levels as well as the temperature range were chosen to 201
resemble the environmental conditions prevailing between 0 and 600 m’s depth in the Sargasso Sea, 202
i.e. the assumed spawning area of European eel, and to account for projected climate-driven ocean 203
warming.
204
205
2.3.2 Data collection 206
For molecular analysis, ~30 larvae (× 2 replicates) from each temperature and parental 207
combination were randomly sampled at hatch and every second day post-hatch until the 208
corresponding first-feeding stage. As feeding trials were beyond the scope of this study, rearing was 209
not conducted beyond these time points. Larvae were euthanized, using an aqueous solution of 210
tricaine methane sulphonate (MS-222, Sigma-Aldrich, Germany) at 500 ppm, rinsed with deionized 211
M AN US CR IP T
AC CE PT ED
water, preserved in RNA-later (Qiagen, Germany), and kept at -20°C. No larvae hatched at 24°C 212
and therefore this treatment was excluded from the statistical analysis.
213 214
2.4. Molecular analyses 215
The present study is part of a wider project in which various aspects of larval development 216
were investigated. In this regard, various molecular pathways were investigated in the same larvae.
217
Whilst this study focusses on the immune system, other studies have focussed on the expression of 218
genes relating to stress and growth [34] as well as the thyroid hormone signalling pathway [37].
219
The present study took advantage of the assembly of the European eel genome [38] and 220
obtained sequences (blastn) were checked for high similarity with other fish species (see 221
supplementary material ST3). Primers (Table 1) were designed for real-time PCR with Primer3plus 222
(http://primer3plus.com/). Molecular analysis was performed at GEOMAR, Helmholtz Centre for 223
Ocean Research in Kiel, Germany. Total RNA from all samples was extracted using a combination 224
of Tri-Reagent (Sigma-Aldrich, Germany) and the InviTrap® Spin tissue RNA MiniKit (Stratec) 225
following the manufacturer’s instructions. RNA concentration was determined by Nanodrop ND- 226
1000 (Peqlab, Germany) and normalized to a common concentration of 100 ng µl-1 with HPLC 227
water. Consequently 680 ng RNA were transcribed with the Quanta qScript cDNA Synthesis Kit 228
(QuantaBio, Germany) as described by the manufacturer including a genomic DNA wipe-out step 229
[Quanta PerfeCta DNase I Kit (QuantaBio, Germany)]. Controls for gDNA efficiency were also 230
included and cDNA was stored at -20°C until further use.
231
Tissue specific expression was measured for 14 genes using the StepOnePlus qPCR system 232
(Applied Biosystems, Germany). For this purpose, a mix of 2 µl cDNA, 5x EvaGreen qPCR Mix 233
Plus Rox (Solis Biodyne, Estonia), 2.5 pmol of each primer, and HPLC water was used in a total 234
volume of 10 µl. The cycling conditions were 95°C for 10 min, followed by 40 cycles of 95°C for 235
15 s and 60°C for 1 min, followed by 95°C for 15 s, 60°C for 1 min and 95°C for 15 s.
236
From all larval samples (4 crosses × 4 temperatures × 2 replicates) and the AngHV-1 237
infection samples, the expression of 14 genes (rps18, tubb, ef1, c3, c1qc, cd3, igm, irf3, irf7, il1β, 238
lysc, mhc2, tnfα, tlr2; Table 1) was analysed with three technical replicates using the qPCR 239
BiomarkTM HD system (Fluidigm) based on 96.96 dynamic arrays (GE chips), as previously 240
described in [39]. In brief, a pre-amplification step was performed with a 500 nM pool of all 241
primers in TaqMan-PreAmp Master Mix (Applied Biosystems) and 1.3 µl cDNA per sample at 10 242
min at 95°C; 14 cycles: 15 s at 95°C and 4 min at 60°C. Obtained PCR products were diluted 1:10 243
M AN US CR IP T
AC CE PT ED
with low EDTA-TE buffer. The pre-amplified product was loaded onto the chip with SsoFast- 244
EvaGreen Supermix Low Rox (Bio Rad) and DNA-Binding Dye Sample Loading Reagent 245
(Fluidigm). Primers were loaded onto the chip at a concentration of 50 µM in Assay Loading 246
Reagent (Fluidigm) and low EDTA-TE Buffer. The chip was run according to the Fluidigm 96.96 247
PCR protocol with a Tm of 60°C. qBase+ software verified stability of housekeeping gene 248
expression throughout analysed samples (M < 0.4; according to [40]). Gene expression was 249
normalised (∆Ct) to the geometric mean of the two most stable housekeeping genes (rps18, ef1).
250
Further analysis of gene expression was carried out according to the 2-∆∆Ct method, in relation to the 251
16°C sample of Day 0 from female 1 [33]. This calculation allowed us to test for effects induced by 252
temperature and larval age at specific developmental stages and in real time.
253
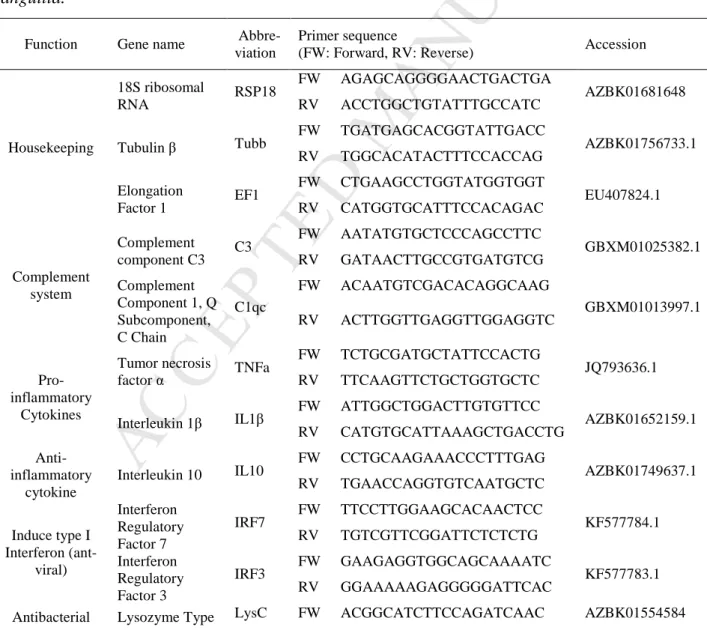
Table 1: Oligos used for molecular analysis of immune-related gene expression in Anguilla 254
anguilla.
255
Function Gene name Abbre- viation
Primer sequence
(FW: Forward, RV: Reverse) Accession
Housekeeping
18S ribosomal
RNA RSP18 FW AGAGCAGGGGAACTGACTGA
AZBK01681648 RV ACCTGGCTGTATTTGCCATC
Tubulin β Tubb FW TGATGAGCACGGTATTGACC
AZBK01756733.1 RV TGGCACATACTTTCCACCAG
Elongation
Factor 1 EF1 FW CTGAAGCCTGGTATGGTGGT
EU407824.1 RV CATGGTGCATTTCCACAGAC
Complement system
Complement
component C3 C3 FW AATATGTGCTCCCAGCCTTC
GBXM01025382.1 RV GATAACTTGCCGTGATGTCG
Complement Component 1, Q Subcomponent, C Chain
C1qc
FW ACAATGTCGACACAGGCAAG
GBXM01013997.1 RV ACTTGGTTGAGGTTGGAGGTC
Pro- inflammatory
Cytokines
Tumor necrosis
factor α TNFa FW TCTGCGATGCTATTCCACTG
JQ793636.1 RV TTCAAGTTCTGCTGGTGCTC
Interleukin 1β IL1β FW ATTGGCTGGACTTGTGTTCC
AZBK01652159.1 RV CATGTGCATTAAAGCTGACCTG
Anti- inflammatory
cytokine
Interleukin 10 IL10 FW CCTGCAAGAAACCCTTTGAG
AZBK01749637.1 RV TGAACCAGGTGTCAATGCTC
Induce type I Interferon (ant-
viral)
Interferon Regulatory Factor 7
IRF7 FW TTCCTTGGAAGCACAACTCC
KF577784.1 RV TGTCGTTCGGATTCTCTCTG
Interferon Regulatory Factor 3
IRF3 FW GAAGAGGTGGCAGCAAAATC
KF577783.1 RV GGAAAAAGAGGGGGATTCAC
Antibacterial Lysozyme Type LysC FW ACGGCATCTTCCAGATCAAC AZBK01554584
M AN US CR IP T
AC CE PT ED
response C RV TGGAGCACGGGATATTACAG
Pathogen recognition
Toll like
receptor 2 TLR2 FW TGGTTCTGGCTGTAATGGTG
AZBK01853964.1 RV CGAAATGAAGGCATGGTAGG
Antigen presentation to
immune cells
Major
histocompatibili ty complex, Class II
MHC 2
FW TCAAATTGACCTGGCTGAGAG
AF134926.1 RV TTTCCATTAGCCAGCTCCTC
Antibody Immunoglobulin
M IgM FW CCAAGGACCATTCTTTCGTC
EU551246.1 RV ACTGGCTTTCAGGAAGATGC
T-cell co- receptor
Cluster of
differentiation 3 CD3
FW AACCGATGATGCTGGAGAAG
AZBK01640579.1 RV ATGTGTATTCGCCCGAACTG
256
2.5. Statistical analysis 257
Tissue specific expression was tested using one-way ANOVAs with parental cross stated as 258
random term. The difference between control samples and samples infected with AngHV-1 was 259
statistically analysed using Mann-Whitney tests for each gene. Statistical models were used to 260
investigate temperature effects on larval morphology and gene expression throughout early larval 261
development (0 to 18 dph) and at specific developmental stages (Stages 1-3). Across the 262
temperature treatments, Stage 1 represents the day of hatch, Stage 2 represents the timing of teeth 263
formation, and Stage 3 represents the first-feeding stages [12]. Together, this allowed us to decipher 264
changes in temperature in real-time and at standardized developmental intervals.
265
To examine the effect of temperature on gene expression throughout early development, we 266
used two statistical approaches. In the first approach, we analysed the data using a series of repeated 267
measures mixed-model ANOVAs (PROC MIXED; SAS Institute 2003). Models contained the 268
temperature (16, 18, 20 and 22°C) and age (0 to 18 DPH) or stage (1, 2 and 3) main effects as well 269
as the temperature × age (or stage) interaction term. Akaike’s (AIC) and Bayesian (BIC) 270
information criteria were used to assess which covariance structure (compound symmetry, 271
autoregressive order, or unstructured) was most appropriate [41]. Temperature and age (or stage) 272
were considered fixed, whereas parental cross was considered random. Tukey’s post-hoc analyses 273
were used to compare means between treatments. If a significant temperature × age (or stage) 274
interaction was detected, the model was decomposed into a series of reduced one-way ANOVA 275
models to determine the effect of temperature for each age (or stage) and of age (or stage) for each 276
temperature. This was the case for il1β, lysc, irf7, and mhc2. Reduced one-way ANOVA models 277
involved only pre-planned comparisons and did not include repeated use of the same data, so alpha 278
level corrections for a posteriori comparison were not necessary.
279
M AN US CR IP T
AC CE PT ED
In the second approach, we examined variation in gene expression, throughout development 280
at each temperature, by fitting linear, quadratic, or cubic equations (PROC REG; SAS Institute 281
2003). This allowed us to create predictive models to explore patterns of variation throughout early 282
development at each temperature. Linear, quadratic, or cubic equations were chosen a-priori to fit 283
the data [42]. Final equation selection (linear, quadratic, or cubic) was based on an F-statistic: d.f.j × 284
(R2j − R2i)/(1 − R2j), where: R2i = the R2 for the i-th order, R2j = the r2 for the next higher order, 285
d.f.j = the degrees of freedom for the higher-order equation with j degrees of freedom in the 286
numerator and d.f.j = n − j −1 degrees of freedom in the denominator [42]. Graphs and regressions 287
were prepared in SigmaPlot® (Version 13.0).
288 289
3. Results:
290
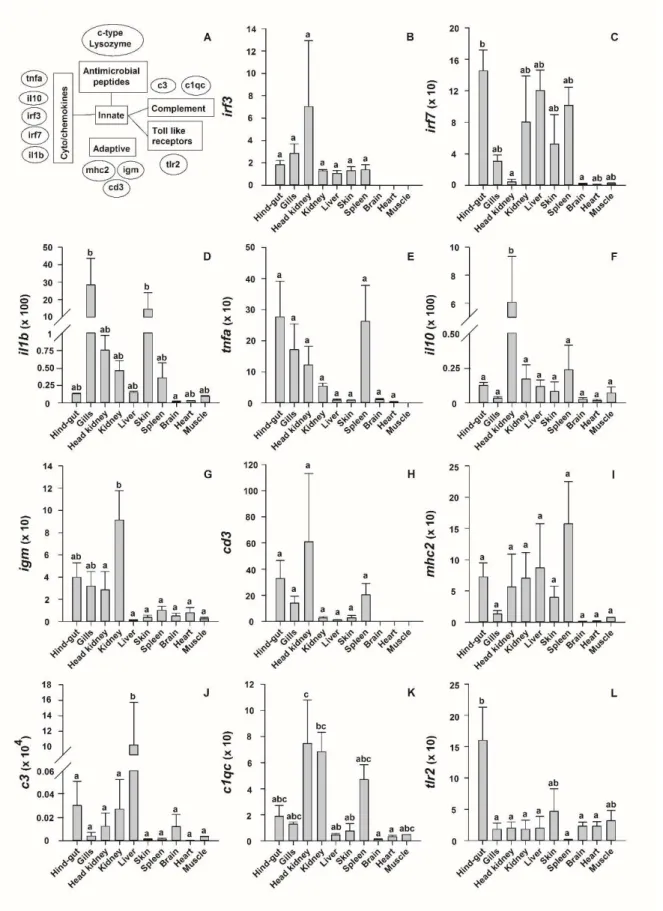
3.1 Characterisation of tissue specific gene expression:
291
Target genes were characterised for their expression in various tissues of on-grown farmed 292
European eels (Fig. 1). Only baseline levels of irf3 expression could be detected in all studied 293
organs (Fig. 1B). On the contrary, interferon regulator factor 7 (irf7) demonstrated low expression 294
in brain, heart, muscle as well as head kidney but significantly higher mRNA levels (P ≤ 0.05; Fig.
295
1C) were detected in the hind-gut (145 ± 26-fold compared to head-kidney). Tissue specific 296
expression also varied amongst cytokines: mRNA levels of interleukin (il1β) were highest in gills 297
(2844 ± 1517-fold) and skin (1450 ± 953-fold) (both P ≤ 0.05 compared to brain; Fig. 1D), followed 298
by the immune organs. Variation between individuals was high and no significant differences 299
between organs were detected for the expression of tumor necrosis factor α (tnfα) (Fig. 1E).
300
However, il10 was mainly expressed in head kidney (606 ± 326-fold compared to heart with P ≤ 301
0.05; Fig. 1F). In regard to the adaptive immune system, immunoglobulin M (igm) seemed to be 302
expressed in the hind-gut, gills, and head kidney, with the highest expression in kidney (91 ± 26- 303
fold compared to the liver with P ≤ 0.01; Fig. 1G). High intra-individual variability was observed 304
for cd3 and mhc2, which led to no significant differences between tissues to be detected (Fig. H, I).
305
Differential tissue expression was detected for the two complement components analysed: whilst c3 306
was mainly expressed in liver (P ≤ 0.05 compared to all other organs; Fig. 1J), c1qc was least 307
expressed in this organ but highest in the head kidney and kidney (P ≤ 0.05; Fig. K). The expression 308
of the toll like receptor 2 (tlr2) was 160 ± 52-fold higher in the hind-gut than in the other 309
investigated organs (P ≤ 0.05; Fig. 1L).
310 311
M AN US CR IP T
AC CE PT ED
312
Fig. 1: Tissue specific expression of immune-related genes in on-grown farmed female A.
313
anguilla. A) Overview of genes targeted in the present study. B-L) Expression of immune-related 314
M AN US CR IP T
AC CE PT ED
genes in certain tissues of European eel. Data are presented as mean ± SEM (n = 3). Gene 315
expression is displayed as x-fold expression compared to the organ with lowest mRNA levels.
316
Values with the same letters are not significantly different (P > 0.05).
317 318
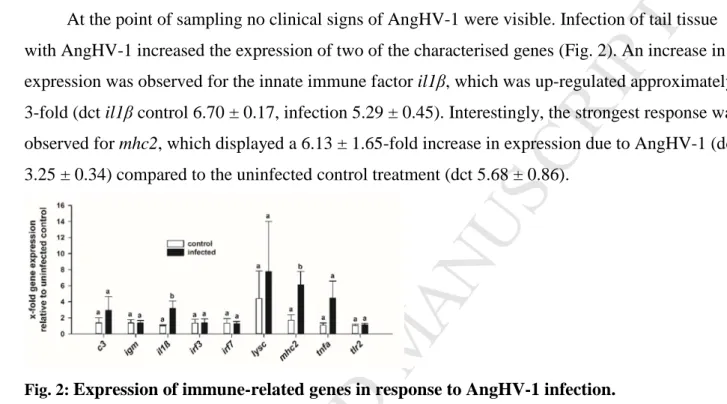
3.2 AngHV-1 infection 319
At the point of sampling no clinical signs of AngHV-1 were visible. Infection of tail tissue 320
with AngHV-1 increased the expression of two of the characterised genes (Fig. 2). An increase in 321
expression was observed for the innate immune factor il1β, which was up-regulated approximately 322
3-fold (dct il1β control 6.70 ± 0.17, infection 5.29 ± 0.45). Interestingly, the strongest response was 323
observed for mhc2, which displayed a 6.13 ± 1.65-fold increase in expression due to AngHV-1 (dct 324
3.25 ± 0.34) compared to the uninfected control treatment (dct 5.68 ± 0.86).
325
326
Fig. 2: Expression of immune-related genes in response to AngHV-1 infection.
327
Tail tissue explants of European eel were infected with 5 x 10⁵ TCID50 of AngHV-1 in vitro for 36 328
hours. Values represent means (±SEM) of five biological replicates. Treatments with the same 329
letters are not significantly different (P > 0.05).
330 331
3.3 Development of the larval immune system:
332
Generally, increasing temperature accelerated development, resulting in larvae reaching the 333
first-feeding stage in 8 days at 22°C, 10 days at 20°C, 12 days at 18°C, and 16 days at 16°C.
334
Housekeeping (HK) gene expression was stable (M < 0.4) throughout the experiment (see Fig. S1, 335
supplement) and variance in HK expression was clearly coupled to variation in cDNA amount in 336
samples. No mRNA of complement component c1qc and T-cell marker cd3 was detected in the 337
studied larvae. Gene expression of the cytokine tnfα was low (ct > 26) and not affected by 338
temperature nor larval age and no temperature × age interaction was detected. For details on the 339
observed regression please refer to Table S1 in the supplementary material. If not otherwise 340
M AN US CR IP T
AC CE PT ED
indicated, x-fold values and ∆ct-values are given as mean ± SEM of all temperatures combined 341
(indicated as ∆ct(T̅)).
342
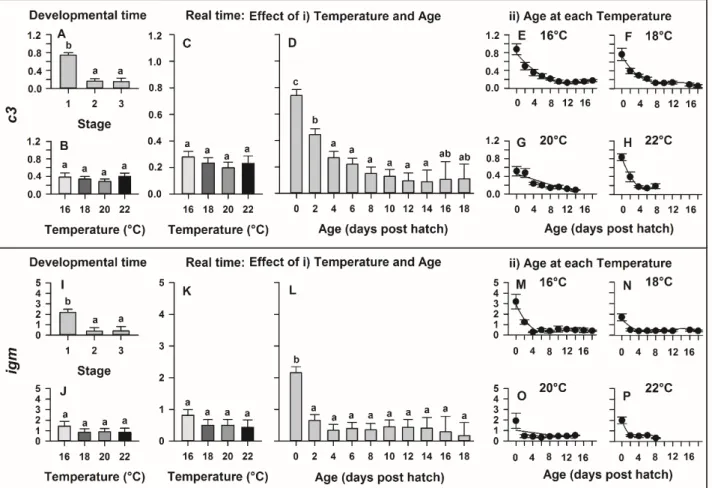
Complement component c3 is the central molecule in the activation pathway of complement 343
and thus its protein levels are linked to complement activity. During development, it was observed 344
that larval gene expression was related to age or stage (P < 0.0001; Fig. 3A, D), such that gene 345
expression of c3 significantly decreased with increasing age from 0.77 ± 0.06-fold (∆ct(T̅): 4.18 ± 346
0.20) on 0 dph to a minimum of 0.13 ± 0.06-fold (∆ct(T̅) 6.61 ± 0.20) on day 12 ph (Fig. 3D).
347
Immunoglobulin M is the first antibody to respond to an infection and has been dubbed a natural 348
antibody in both mammals and teleosts as it can respond to pathogens without prior immunisation 349
[43]. Thus, providing initial protection before the adaptive immune response is formed. Its mRNA 350
levels decreased significantly with increasing stage (P < 0.0001; Fig. 3I) and age (P < 0.0001; Fig.
351
3L) displaying a maximum expression (2.16 ± 0.30-fold, ∆ct(T̅): 9.42 ± 0.21) on day 0 and a 352
constant expression level of 0.48 ± 0.03-fold (∆ct(T̅): 11.51 ± 0.10) after that.
353
354
Fig. 3: Gene expression of c3 and igm in European eel (Anguilla anguilla) larvae reared under 355
four different temperatures. All y-axes display x-fold expression in relation to the 16°C sample of 356
day 0 from female 1. The expression at specific developmental stages (1: hatching, 2: teeth 357
M AN US CR IP T
AC CE PT ED
formation, 3: first-feeding) is displayed for c3 (A-B) and igm (I-J) whilst expression measured in 358
real time is displayed in C-D for c3 and K-L for igm. E-H and M-P show the effect of age on c3 and 359
igm, respectively. Relationships between age and c3 expression can be explained by a cubic 360
regression at 18°C, a linear regression at 20°C and quadratic regressions at 16 or 22°C (P < 0.01; R² 361
> 0.78). Relationships between age and igm expression can be explained by a linear regression at 362
20°C and cubic regressions at 16, 18 or 22°C (P < 0.001; R² > 0.16). Values represent means 363
(±SEM) among four crosses at each temperature and treatments with the same letters are not 364
significantly different (P > 0.05).
365 366
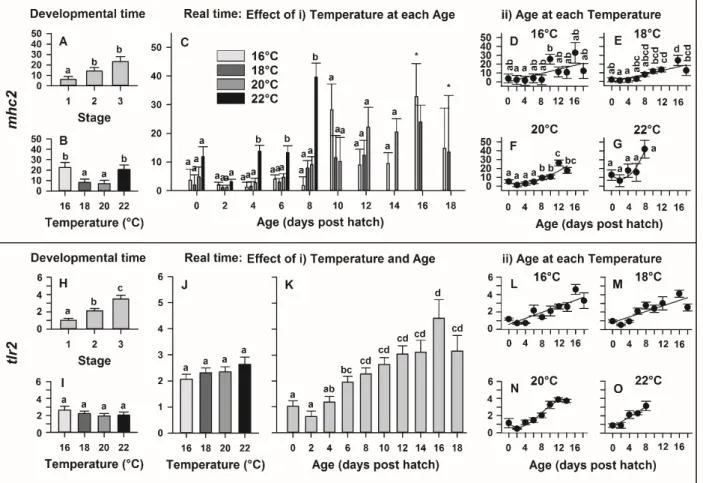
Moreover, mRNA levels of major histocompatibility complex II (mhc2) were also 367
significantly affected by stage as transcription increased beyond stage 2 (teeth formation; P = 0.001;
368
Fig. 4A). MHC II is located on the cell surface of antigen-presenting cells (e.g. macrophages, B- 369
cells) and it fulfils the function of presenting extracellular antigens to immune cells. The expression 370
of mhc2 increased more than 2-fold at 16 and at 22°C (P = 0.003) compared to the other 371
temperatures, though no significant temperature × stage interaction was detected (Fig. 4B). On the 372
contrary, when analysed in real time, a significant temperature × age interaction (P = 0.043) was 373
observed, which allowed us to determine the effects of temperature for each age (Fig. 4C) and of 374
age for each temperature (Fig. 4D-G). Here, 22°C showed the largest effect as it led to an increase 375
of mhc2 levels of 13.71 ± 3.76-fold at 4 dph, 13.27 ± 0.93 at 6 dph, and 39.60 ± 6.54 at 8 dph (all P 376
≤ 0.01). Furthermore, larval age significantly influenced expression of mhc2 (Fig. 4D-F) when 377
larvae were reared at temperatures ranging from 16 to 20°C (P ≤ 0.01), while no age effect was 378
observed at 22°C (Fig. 4G). This leads to a steady increase in mRNA levels throughout 379
development of the larvae. Initial detection of antigens is amongst others carried out by toll like 380
receptors. In fish, toll like receptor 2 (TLR2) is involved in the recognition of bacterial and parasitic 381
ligands [44]. As shown in Fig. 4H, expression of tlr2 approximately doubled at stage 2 (teeth 382
formation) and tripled at stage 3 (first-feeding; P < 0.0001). It was also significantly affected in real 383
time (P < 0.0001) and increased with increasing age from a minimum expression of 0.62 ± 0.09- 384
fold (∆ct: 10.52 ± 0.15) on 2 dph to a maximum expression of 4.34 ± 0.23-fold (∆ct: 7.48 ± 0.08) 385
on 16 dph (Fig. 4K).
386
M AN US CR IP T
AC CE PT ED
387
Fig. 4: Gene expression of mhc2 and tlr2 in European eel (Anguilla anguilla) larvae reared 388
under four different temperatures. All y-axes display x-fold expression in relation to the 16°C 389
sample of day 0 from female 1. The expression at specific developmental stages (1: hatching, 2:
390
teeth formation, 3: first-feeding) is displayed for mhc2 (A-B) and tlr2 (H-I), whilst expression 391
measured in real time is displayed in C for mhc2 and J-K for tlr2. D-G and L-O show the effect of 392
age on mhc2 and tlr2, respectively. Relationships between age and mhc2 expression can be 393
explained by linear regressions at 16 or 18°C and quadratic regressions at 20 or 22°C (P < 0.0001;
394
R² > 0.36). The relationship between age and tlr2 expression can be explained by a cubic 395
regression at 20°C and linear regressions at 16, 18 or 22°C (P < 0.002; R² > 0.66). Data points with 396
an asterisk (*) were not included in the statistical model due to insufficient sample size. Values 397
represent means (± SEM) among four crosses at each temperature and treatments with the same 398
letters are not significantly different (P > 0.05).
399 400
Type I IFNs are cytokines, which are expressed in response to the detection of viral antigens 401
and elicit an antiviral immune response. The expression of type I IFNs is regulated with the 402
Interferon regulating factors 3 and 7 (irf3 and 7) and in the present study, we demonstrate that their 403
M AN US CR IP T
AC CE PT ED
expression is dependent on larval stage (Fig. 5A, B, I, J; P < 0.0001), and age (Fig. 5D, K; P <
404
0.0001) as well as temperature when measured in real time (Fig. 5C, K; P < 0.029). Gene 405
expression of irf3 was significantly elevated (6.66 ± 0.69-fold) at 22°C compared to (4.59 ± 0.45- 406
fold) 16°C (Fig. 5C) and significantly increased throughout ontogeny with increasing larval age 407
(Fig. 5D). Here, general expression was 2.24 ± 0.25-fold (∆ct(T̅): 11.29 ± 0.16) on day 0 and 408
increased in a linear manner to reach a maximum of 8.26 ± 0.78-fold (∆ct(T̅): 9.19 ± 0.14) at 14 409
dph. Irf7 was significantly affected by the temperature × age interaction (P = 0.013). Significant 410
differences in mRNA levels of irf7 among temperatures occurred on 4 dph (P = 0.045) where 411
expression at 22°C was about 40% higher than the expression at 16°C (Fig. 5K). Additionally, irf7 412
levels increased steadily throughout development in all tested temperatures (16 – 22°C; P ≤ 0.007;
413
Fig. 5L-O).
414
415
Fig. 5: Gene expression of irf3 and irf7 in European eel (Anguilla anguilla) larvae reared 416
under four different temperatures. All y-axes display x-fold expression in relation to the 16°C 417
sample of day 0 from female 1. The expression at specific developmental stages (1: hatching, 2:
418
teeth formation, 3: first-feeding) is displayed for irf3 (A-B) and irf7 (I-J), whilst expression 419
measured in real time is displayed in C-D for irf and K-L for irf7. E-H and M-P show the effect of 420
M AN US CR IP T
AC CE PT ED
age on irf3 and irf7, respectively. Relationships between age and irf3 expression can be explained 421
by linear regressions at all temperature treatments (P < 0.0001; R² > 0.74). The relationship 422
between age and irf7 expression can be explained by a quadratic regression at 20°C and linear 423
regressions at 16, 18 or 22°C (P < 0.002; R² > 0.72). Data points with an asterisk (*) were not 424
included in the statistical model due to insufficient sample size. Values represent means (± SEM) 425
among four crosses at each temperature and treatments with the same letters are not significantly 426
different (P > 0.05).
427 428
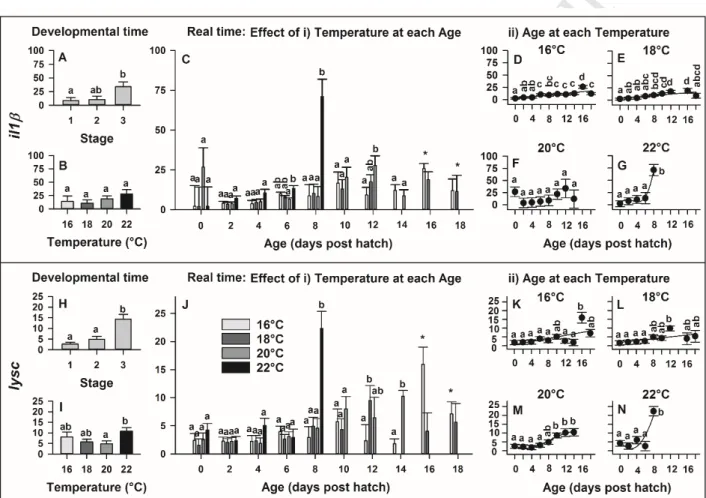
Gene expression of the pro-inflammatory cytokine Interleukin 1β (il1β) was only significantly 429
increased at stage 3 (first-feeding; P = 0.033) but at this stage it was up-regulated approximately 3- 430
fold (Fig. 6A). The real time analysis, however, revealed a significant temperature × age interaction 431
(Fig. 6C; P = 0.003). Significant differences in gene expression of il1β among temperatures 432
occurred on 6, 8 and 12 dph (P < 0.02). On 8 dph in specific, expression levels of il1β were 433
approximately 6-fold (∆ct: 5.96 ± 0.97) higher at 22°C compared to the other temperatures (∆ct:
434
8.70 ± 0.15). Larval age led to a significant increase in il1β expression at all rearing temperatures (P 435
≤ 0.001) except at 20°C (Fig. 6D-G), probably due to high levels of variation between individuals at 436
this temperature. A linear increase of il1β expression was observed at 16°C and 18°C (P < 0.0001;
437
R² ≥ 0.53), leading to an approximately 4-fold increase within the sampling period. The 438
relationships between age and il1β expression can be explained by a sigmoidal cubic regression at 439
22°C (P < 0.001; R² = 0.95) with low levels of expression during the first 6 dph and a sudden 440
increase at 8 dph, resulting in the 6-fold up-regulation described above.
441
Expression of the antimicrobial c-type lysozyme (lysc) was also significantly up-regulated at 442
the first-feeding stage (stage 3) by approx. 3-fold (Fig. 6H; P = 0.0001). Furthermore, expression of 443
this gene was doubled at 22°C compared to 20°C (Fig. 6I; P = 0.041). In real time, the temperature 444
× age interaction significantly influenced the gene expression of lysc (Fig. 6J; P < 0.0001). Here, 445
significant differences in expression of lysc among temperatures occurred on 8, 12 and 14 dph (P ≤ 446
0.04). More specifically, and in line with expression patterns of other genes at day 8 ph, a strong up- 447
regulation (300 %) of lysc at 22°C compared to the other temperatures was observed. Additionally, 448
a rearing temperature of 16°C led to a significant lower level of expression of lysc compared to 449
18°C (16°C: ∆ct: 12.93 ± 0.35, 18°C: ∆ct: 11.37 ± 0.45) on 12 dph and compared to 20°C (16°C:
450
∆ct: 13.11 ± 0.92, 20°C: ∆ct: 11.04 ± 0.19) on 14 dph. Expression of lysc was also significantly 451
affected by larval age (Fig. 6K-N) at all rearing temperatures (P ≤ 0.01). Similar to il1β, expression 452
M AN US CR IP T
AC CE PT ED
of lysc linearly increased at 16°C (P = 0.012, R² = 0.29) and 18°C (P < 0.001, R² = 0.31) throughout 453
larval development. The relationships between age and lysc expression can further be explained by 454
a sigmoidal cubic regression at 20°C (P < 0.0001; R² = 0.96) leading to a 9-fold expression at 14 455
dph (∆ct: 11.04 ± 0.19) compared to day 0 (∆ct: 19.14 ± 0.58; Fig. 6M). As observed in il1β, 456
rearing larvae at 22°C led to a constant level of lysc expression during the first 6 dph and a sharp 457
increase in mRNA levels at 8 dph. This is best described by a parabolic quadratic regression at 458
22°C (Fig. 6N; P = 0.0001; R² = 0.59).
459
460
Fig. 6: Gene expression of il1β and lysc in European eel (Anguilla anguilla) larvae reared 461
under four different temperatures. All y-axes display x-fold expression in relation to the 16°C 462
sample of day 0 from female 1. The expression at specific developmental stages (1: hatching, 2:
463
teeth formation, 3: first-feeding) is displayed for il1β (A-B) and lysc (H-I), whilst expression 464
measured in real time is displayed in C for il1β and J for lysc. D-G and K-N show the effect of age 465
on il1β and lysc, respectively. Relationships between age and il1β expression can be explained by 466
linear regressions at 16 or 18°C and a cubic regression at 22°C (P < 0.0001; R² > 0.53). The 467
relationship between age and lysc expression can be explained by linear regressions at 16 or 18°C, a 468
cubic regression at 20°C and a quadratic regression at 22°C (P < 0.002; R² > 0.29). Data points with 469
M AN US CR IP T
AC CE PT ED
an asterisk (*) were not included in the statistical model due to insufficient sample size. Values 470
represent means (± SEM) among four crosses at each temperature and treatments with the same 471
letters are not significantly different (P > 0.05).
472 473
4. Discussion:
474
The ultimate aim of this study was to elucidate the expression patterns of key immune genes 475
during A. anguilla development and investigate how temperature influences these patterns. As no 476
molecular tools were available to analyse immune-related genes in this fish species, we first set out 477
to develop primers and characterize tissue specific expression of immune-related genes in healthy 478
on-grown farmed individuals. Subsequently, the usability of this tool was evaluated during AngHV- 479
1 exposure of tail explant cultures. Once their usability was established, we applied these new tools 480
to study the ‘critical’ early life stages of eel across a broad thermal regime.
481 482
4.1 Tissue specific expression & AngHV-1 infection 483
Complement activation leads to the production of activated protein fragments that play an 484
important role in innate immune responses [26]. In mammals, and possibly in fish, C3 is the central 485
complement molecule of the three pathways [26]. It is known that complement proteins are mainly 486
synthesized in the liver in mammals and fish [45]. The tissue specific expression pattern for c3 487
(highest expression in liver) in the present study is therefore in line with previous findings. Similar 488
results have been observed in other fish species, such as yellow croaker (Larimichthys crocea), 489
Indian major carp (Labeo rohita), and orange spotted grouper (Epinephelus coioides) [46–48]. The 490
gene complement C1q C chain (c1qc) encodes the large subunit (C1q) of the complement 491
component C1. C1q acts as a pathogen sensor and binds directly to their surface or to antibodies 492
bound to pathogens, which leads to the activation of the complement system via the classical 493
pathway [28]. In mammals, C1q is mainly synthesized in macrophages and dendritic cells and not 494
by hepatocytes unlike the other complement components [49]. This is reflected in the expression 495
pattern observed in the analysed healthy eel tissue where c1qc expression was very low in the liver 496
but high in spleen, kidney, and head kidney. This pattern seems to be conserved across many fish 497
species and orders as it was also observed in Siberian sturgeon (Acipenser baerii), mandarin fish 498
(Siniperca chuatsi), and zebrafish (Danio rerio) [50–52]. Both investigated complement factors c3 499
and c1qc were not significantly up-regulated during AngHV-1, which is in line with results from 500
common carp gills infected with cyprinid herpesvirus 3 (CyHV-3), which has been shown to be able 501
M AN US CR IP T
AC CE PT ED
to modulate the immune response of the host [53]. However, targeted studies are needed to 502
investigate the immunuomodulatory potential of AngHV-1.
503
Toll-like receptors (TLR) were the first receptors identified that recognize pathogen associated 504
molecular patterns (PAMPs) [54]. In European eel, TLR2 is suggested to recognize bacterial and 505
fungal pathogens [30]. This is in line with our results where the expression was not regulated during 506
AngHV-1 infection. The tlr2 expression in the present study was especially low in the spleen but 507
high in hind-gut. Throughout the literature, it is clear that tissue specific tlr2 expression varies 508
among species [44,55–57]. As pathogens are often ingested with food or water, it was expected that 509
tlr2 is highly expressed in the hind-gut. However, the lack of expression in the spleen was not 510
expected as this is a major immune organ and future studies should address this phenomenon.
511
Cytokines include interleukins, tumor necrosis factors, interferons and chemokines. In this 512
study, we investigated il10, il1β and tnfα as well as the type 1 interferon inducing factors irf3 and 513
irf7. In humans, IL-10 is mainly produced by monocytes [28], whilst in fish the functional role of 514
IL-10 is still under investigation. It has been shown that, similar to the expression observed in eel, 515
sea bass (Dicentrarchus labrax) and carp (Cyprinus carpio) produce this cytokine intensely in head 516
kidney [58,59]. This indicates that the head kidney is a major side of monocytes in eel. IL-1β is 517
produced by macrophages in response to signalling via toll-like receptors (TLRs) and induces an 518
inflammatory immune response. For the eels used in this study, il1β was constitutively expressed in 519
all studied organs with the highest expression in gills and skin. The latter is contrary to other fish 520
species, such as brown trout (Salmo trutta) and rohu (Labeo rohita), where il1β expression was 521
always low in skin [60,61]. Interleukin-1β has been shown to be up-regulated in skin of fish 522
following infection or injury as reviewed by [62]. Thus, it has to be investigated further if the high 523
expression in skin is an eel specific characteristic or if it is due to an undetected infection or injury.
524
Due to the low variability between the three tested individuals, this might be an eel specific trait 525
attributed to their rudimentary scales and high mucus production [63]. Interestingly, il1β was also 526
one of the genes up-regulated during the AngHV-1 infection. This is in line with the response in 527
carp to CyHV-3, which also induces pro-inflammatory responses in skin [64].
528
The main role of TNF-α is the control and local restriction of infection and the here observed 529
tissue specific expression corresponds to a study in rainbow trout (Oncorhynchus mykiss) [65] but 530
differs from expression patterns in other fish species, such as mandarin fish (Siniperca chuatsi), 531
rohu, and crucian carp (Carassius carassius) [61,66–68]. This indicates, as previously discussed by 532
Kajungiro and colleagues, that constitutive expression of tnfα varies with fish species and tissues 533
M AN US CR IP T
AC CE PT ED
[67]. During exposure of the explants to AngHV-1 in our in vitro experiments, the up-regulation 534
was noticed, however due to high variation it was not significant.
535
The interferon regulating factors 3 and 7 have been previously characterised in European eel 536
[29]. In healthy organisms, IRF3 is constitutively expressed in a variety of tissues and is present in a 537
latent inactive form in the cytoplasm [69]. On the other hand, IRF7 is expressed at low levels in the 538
cytoplasm of lymphoid cells [70]. Both are strongly induced upon viral infection. Surprisingly, 539
these two type I IFN response markers were not up-regulated during AngHV-1 infection, which 540
should be further investigated in the future. However, the group of fish herpes viruses is known to 541
have strong anti-interferon abilities [71]. The present study aimed, amongst others, to complement 542
the knowledge from a previous A. anguilla study [29] by adding the tissue specific expression of 543
these two genes. Irf3 was constitutively expressed at a low level in all analysed tissues whilst irf7 544
displayed higher expression levels in organs involved in the immune response except for head 545
kidney. The latter not only concurs with the spatial pattern found in PolyI:C treated eels [29] but 546
also resembles the pattern observed in crucian carp and Japanese flounder (Paralichthys olivaceus) 547
[72,73].
548
Immunoglobulin M (IgM) is, like all classes of immunoglobulins, produced by B-cells and 549
therefore its expression gives an indication of the localisation of these immune cells. The observed 550
tissue specific expression pattern of igm concurs with the pattern observed in turbot (Scophthalmus 551
maximus) [74] whilst higher spleen expression levels were observed in pufferfish (Takifugu 552
rubripes) [75]. The high expressions in head kidney and trunk kidney indicate the haematopoetic 553
function of these organs in A. anguilla and confirm previous findings in New Zealand freshwater 554
eels (A. australis schmidtii and A. dieffenbachii) [76]. The low expression of igm in spleen, similar 555
to the expression of tlr2 in this organ, is however unexpected and should be addressed in future 556
studies. In respect to the AngHV-1 infection, igm up-regulation was not expected due to the early 557
sampling point, which precedes activation of the adaptive immune response in teleosts [77].
558
Another member of the immunoglobulin superfamily is the clusters of differentiation (CD). In 559
humans, CD3 is initially expressed in the cytoplasm of pro-thymocytes and migrates to the cell 560
membrane when T-cells mature. Hence, CD3 is only expressed on T-cells and can therefore be used 561
as a marker for the presence of this cell type. Our study showed that cd3 was ubiquitously expressed 562
in all tested immune organs of on-grown farmed European eel. Unfortunately, due to the involution 563
of thymus in eels [76], it was not possible to test expression in thymus tissue. In fish, mature T-cells 564
M AN US CR IP T
AC CE PT ED
have been shown to be abundant in lymphoid tissues such as thymus, kidney, and spleen and in 565
mucosal tissues (intestine and gills) [78].
566
The major histocompatibility complex (MHC) binds peptide fragments of pathogens and 567
presents them on the cell surface for recognition by appropriate T-cells. In mammals, MHC II class 568
molecules can be found on antigen-presenting cells, i.e. B-cells, macrophages, and dendritic cells 569
[28]. A detailed characterization of MHC II in eel was beyond the scope of this study and thus we 570
concentrated on the tissue specific expression. The mhc2 expression pattern observed in the present 571
analysis is similar to tissue expression recorded in swamp eel where hardly any expression was 572
detected in heart and muscle, whilst the highest expression was observed in the stomach, spleen and 573
skin [79]. Certain genotypes of MHC class II were shown to be associated with higher survival of 574
carp to CyHV-3 [80]. Therefore, the up-regulation of mhc2 gene could be considered important for 575
the response to AngHV-1 as this might enable disease prevention methods for eel aquaculture in the 576
future.
577
Taken together, our in vitro viral model infection induced pro-inflammatory responses 578
marked with up-regulation of il1β. Furthermore, up-regulation of mhc2 links the responses with the 579
adaptive arm of immunity. Interestingly, the antiviral responses markers (irf 3 and 7) were not up- 580
regulated which could be related with anti-IFN activities of alloherpesviruses. Considering the time- 581
point at which the samples were collected the findings fit to the initial phase of mucosa responses to 582
the alloherpesviral pathogen [81].
583 584
As pointed out by [30], the phylogenetic distance to more common fish species and their 585
status as non-model fish hampered the immune-related research of European eel in the past.
586
However, advancement in the understanding of their immune system is vital to improve health and 587
survival under rearing conditions [24]. The present study now provides new molecular tools to 588
characterize the immune system of European eel in more depth and, as described below, to 589
understand the development of the immune system and its response to environmental factors. We 590
therefore applied these tools to elucidate expression of key immune genes during development of 591
the immune system from hatch to the first-feeding stage.
592 593
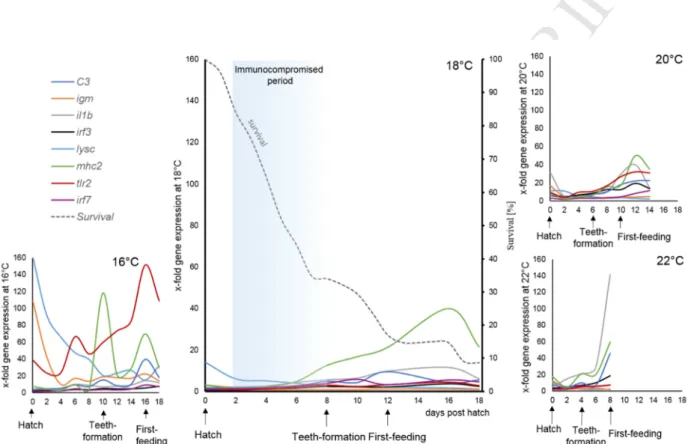
4.2 Ontogeny at 18°C 594
M AN US CR IP T
AC CE PT ED
Our findings showed that the studied immune genes could be clustered into three groups, 595
which were differently affected by temperature: low-level age independent expression and 596
expression positively or negatively correlated with age.
597
In a further analysis of the same larvae [34], 18 - 20°C was found to be the optimal 598
temperature in regard to survival, growth, and development. In order to elucidate regular ontogeny 599
of the immune system of European eel larvae, we therefore focused on the 18°C treatment to 600
discuss temperature influences. Both complement component c3 and immunoglobulin M (igm) 601
seem to have been already expressed during the embryonic stage and might have been transferred 602
maternally to the larvae as seen in various other fish species [45,82–85]. However, to confirm this, 603
further studies are needed. It has previously been suggested that at this developmental stage, c3 and 604
igm work together to facilitate binding of opsonized bacteria to complement receptors on 605
phagocytes [26,85]. In carp, it was demonstrated that c3 gene expression peaked around the time of 606
hatching and that it is produced in the yolk syncytial layer [45]. During eel ontogeny, c3 gene 607
expression was also linked to a shrinking yolk sac area [34], probably indicating that C3 is 608
important for innate immune function shortly after hatch. Similar to c3 and in line with the present 609
study, it was shown in sea bass that IgM is transferred maternally through the yolk. Its persistence 610
only lasted a few days and got exhausted with yolk absorption [86] to then completely disappear 611
during later larval stages [87]. In the European eel larvae studied here, igm levels peaked at hatch 612
and decreased rapidly to basal levels afterwards. Interestingly, studies on Japanese eel demonstrated 613
that whilst igm and T-cell-related lck genes were expressed already 3 days post fertilisation, the 614
development of lymphoid tissues were delayed and neither spleen, thymus nor lymphocytes were 615
observed in larvae of similar sizes [25,88]. This is in line with the observed absence of cd3 616
expression in the present study and it can therefore be assumed that adaptive immune protection is 617
still underdeveloped in very early larval stages (i.e. pre-leptocephalus stage). Overall, this would 618
have implications for the use of vaccines during early life stages, thus further studies are needed to 619
link the present findings to the functionality of the adaptive immune system.
620
Toll like receptor 2 (TLR2) is involved in the recognition of bacterial and parasitic ligands. In 621
this study, tlr2 expression increased throughout larval development in a temperature independent 622
manner. To our knowledge, this is the first study investigating tlr2 expression during larval 623
development of fish. However, it was previously shown that toll like receptors are already 624
expressed before hatch and that their expression is temperature independent in zebrafish [89]. Our 625
results therefore indicate that eel larvae were probably already able to detect pathogens and that this 626