evolutionary potential of the European eel?
Miguel Baltazar-Soares1& Christophe Eizaguirre1,2
1GEOMAR Helmholtz Centre for Ocean Research Kiel, D€usternbrooker Weg 20, 24105 Kiel, Germany
2School of Biological and Chemical Sciences, Queen Mary University of London, Mile End Road, London E1 4NS, UK
Keywords
Anguilla anguilla, demes, habitat fragmentation, matrilines, population dynamics.
Correspondence
Miguel Baltazar-Soares, GEOMAR Helmholtz Centre for Ocean Research, D€usternbrooker Weg 20, 24105 Kiel, Germany.
Tel: +49 (0)431-600-4577 Fax: +49 (0)431-600-4553 E-mail: msoares@geomar.de Funding Information
Max-Planck-Gesellschaft, Fisheries Society of the British Isles, Deutsche
Forschungsgemeinschaft (Grant/Award Number: “EI 841/4-1”, “EI 841/6-1”).
Received: 5 January 2016; Revised: 2 March 2016; Accepted: 3 March 2016
doi: 10.1002/ece3.2098
Abstract
Using evolutionary theory to predict the dynamics of populations is one of the aims of evolutionary conservation. In endangered species, with geographic range extending over continuous areas, the predictive capacity of evolutionary- based conservation measures greatly depends on the accurate identification of reproductive units. The endangered European eel (Anguilla anguilla) is a highly migratory fish species with declining population due to a steep recruitment col- lapse in the beginning of the 1980s. Despite punctual observations of genetic structure, the population is viewed as a single panmictic reproductive unit. To understand the possible origin of the detected structure in this species, we used a combination of mitochondrial and nuclear loci to indirectly evaluate the pos- sible existence of cryptic demes. For that, 403 glass eels from three successive cohorts arriving at a single location were screened for phenotypic and genetic diversity, while controlling for possible geographic variation. Over the 3 years of sampling, we consistently identified three major matrilines which we hypoth- esized to represent demes. Interestingly, not only we found that population genetic models support the existence of those matriline-driven demes over a completely panmictic mode of reproduction, but also we found evidence for asymmetric gene flow amongst those demes. We uphold the suggestion that the detection of demes related to those matrilines reflect a fragmented spawning ground, a conceptually plausible consequence of the low abundance that the European eel has been experiencing for three decades. Furthermore, we suggest that this cryptic organization may contribute to the maintenance of the adap- tive potential of the species.
Introduction
The field of evolutionary conservation aims at identifying processes and mechanisms that contribute to the mainte- nance of the adaptive potential of species and uses this knowledge to improve management (Frankham 2005; Har- risson et al. 2014). The adaptive potential is generally defined as the ability of species/populations to respond to natural selection, whether it relates to species interactions– such as predator–preys or host–parasite coevolution–or to environmental shifts (Eizaguirre and Baltazar-Soares 2014) The adaptive potential can be estimated by screening the distribution of genetic diversity across populations of a given species but, for that, some knowledge of those popu- lations’ boundaries is needed. Identifying boundaries in natural populations is an extremely challenging but critical
task (Waples and Gaggiotti 2006). This is particularly evi- dent in those species with no spatially explicit breeding groups (Manel et al. 2007). For example, reduced gene flow (which implies population structure) may facilitate the evo- lution of local adaptation (Eizaguirre et al. 2012) but may also hinder the spread of beneficial mutations across a spe- cies range, and in extreme cases, may lead to inbreeding depression (Frankham 2005). In contrast, extensive gene flow amongst populations might promote migration load and disrupt patterns of local adaptation (Bolnick and Nosil 2007). Practically, management programs that underesti- mate the genetic structure of natural populations may prove ineffective and may irreversibly damage the species they aimed to protect (Hutchinson 2008).
Several evolutionary processes are known to establish or reinforce cryptic genetic structures in species with
otherwise continuous spatial distributions. Selection (Schluter 2009), mate choice (Kirkpatrick 2000), habitat choice (Via 1999) or sex-biased dispersal (Pusey 1987;
Portnoy et al. 2015) are examples of well-documented cases. Amongst those, sex-biased dispersal – which describes situations where one sex shows natal philopatry while the other shows less accurate fidelity to the natal site – is perhaps the best documented (Prugnolle and De Mee^us 2002). Evolutionary lineages of distinct mitochon- drial haplotypes (matrilines) are often associated with specific colonies in bats (Rossiter et al. 2005), linked to different nursery areas in sharks (Keeney et al. 2005) or correspond to different nesting groups in turtles (Bowen et al. 2004; Stiebens et al. 2013). While matrilines may differ from each other by as few as one mutation step (Keeney et al. 2005; Levin and Parker 2012), larger differ- ences have also been reported (Tillett et al. 2012). The usual signature of sex-biased dispersal shows that uni-par- entally inherited loci (such as mitochondrial DNA of female vertebrates) have a stronger signature of differenti- ation amongst philopatric locations than bi-parentally inherited loci (Pardini et al. 2001; Bowen et al. 2004).
Theoretically, sex-biased dispersal is interpreted as an evolutionary mechanism of inbreeding avoidance, whether through the existence of genetic differences between the dispersive and the philopatric sex (Berg et al. 1998) or through the movement of the dispersing sex in order to avoid kin mating (Dobson 2013). Recent evidence showed that despite female philopatry amongst endangered log- gerhead turtles, male-biased opportunistic mating is criti- cal to maintain the genetic diversity – and thus the adaptive potential–of the species by increasing gene flow amongst nesting locations and maintain high genetic diversity (Stiebens et al. 2013). The identification of cryp- tic genetic structure is therefore essential to estimate the adaptive potential of species.
The European eel (Anguilla anguilla) is a highly migra- tory fish with a life cycle that uses the entire North Atlan- tic basin. Born in the Sargasso Sea, eels are passively transported towards the European coasts with the main ocean currents. This connection is facilitated by the North Atlantic gyre (Blanke et al. 2012) and, in particular, by an oceanic pathway linking the spawning grounds with the Gulf Stream (Baltazar-Soares et al. 2014). Upon sexual maturity, all adult eels aim to return to the Sargasso Sea to mate. Recent investigations on speciation and historical demography further reinforce the intrinsic role of the Gulf Stream on this species’ evolution (Jacobsen et al.
2014a): by the beginning of the 1980s, the juveniles arriv- ing at European coasts – hereafter referred to as recruit- ment –experienced a steep decline (Moriarty 1990). This was followed by consecutive years of extremely low recruitment affecting the abundance of adult eels in their
continental range (Astrom and Dekker 2007). It is thought that a multitude of factors have contributed to this decline: changes in ocean currents (Baltazar-Soares et al. 2014) and ocean productivity (Friedland et al.
2007), diseases (Van Nieuwstadt et al. 2001; Kirk 2003), pollution (Robinet and Feunteun 2002), reduced freshwa- ter habitats (Prigge et al. 2013), overfishing (Dekker 2003) and lack of spawners (Dekker 2003) are amongst the most consensual hypotheses.
The European eel population is perceived as a single panmictic reproductive unit (Als et al. 2011) with single- generation local selection sorting genotypes in European freshwater systems (Pujolar et al. 2014b). Still, after the recruitment collapse, punctual observations of genetic structure amongst coastal locations were detected (Avise et al. 1986; Wirth and Bernatchez 2001; Dannewitz et al.
2005; Baltazar-Soares et al. 2014). Particularly, the identi- fication of genetically distinct glass eel cohorts by (Dan- newitz et al. 2005) was suggested to reflect temporal genetic discontinuities amongst reproductive events.
However, the presence of a spatial genetic structure at Sargasso Sea could not be entirely excluded (Dannewitz et al. 2005). This scenario was further extended by the use of hypotheses-driven ocean models. These models tested predictions of female philopatry to specific loca- tions within the Sargasso Sea as a possible source of genetic structure, by comparing simulated and field data of A. anguilla mitochondrial DNA (Baltazar-Soares et al.
2014). While overall results suggested that the Sargasso Sea may not represent an entirely homogenous spawning ground, field data specifically identified three distinct matrilines. Noteworthy, the definition of a “natal environ- ment” does not need to relate to a given location in the Sargasso Sea, but could rather be associated with imprint- ing on physical, chemical, or ecological conditions in the region (Miller et al. 2015). Despite successful locations and capture of eel larvae in the Sargasso Sea (Miller et al.
2015), expeditions have been unable either to detect events of reproduction, or capture mature individuals.
Realistically, these challenges limit our knowledge regard- ing the reproductive strategy of this species which thus requires relying on more hypotheses-driven indirect approaches.
The primary objective of this study is therefore to test for the possibility of the three matrilines identified in (Bal- tazar-Soares et al. 2014) to represent cryptic female-driven demes in the Sargasso Sea. We collected, at a single location in Europe, a total of 403 freshly-arrived juvenile eels (glass eels) in three consecutive years. Sampling within one loca- tion over time has the advantage of controlling for con- founding factors associated with varying single generation selection across European coasts (Pujolar et al. 2014b). We then sequenced the same portion of mitochondrial genome
as in (Baltazar-Soares et al. 2014), and screened for the existence of the same matrilines over time. We then grouped individuals per matrilines, measured their relative fitness and used 22 microsatellites to measure genetic dif- ferentiation, rates and directionality of gene flow and per- form heterozygosity fitness correlations amongst matrilines. We hypothesized that a panmictic population would show bi-directional gene flow amongst matrilines.
Any deviation from this pattern would suggest a different mode of functioning of the eel spawning ground.
Material and Methods
Indicator of individual fitness: “condition index after arrival”
We sampled 403 glass eels from three distinct cohorts captured in the mouth of the river Adour in France (GPS coordinates: 43°31048″N. 1°31028″W). Individuals were captured within the fourth week of December of 2010 (n =157), 2011 (n =127) and 2012 (n=121). Speci- mens were dried with absorbing tissue, weighed (total weight1 mg), measured with an electronic caliper (total length, 0.01 mm), and a piece of tissue was clipped for DNA extraction.
We first calculated the relative condition index (Kn) (Le Cren 1951; Froese 2006) following: Kn= W/aLb, where W and L are weight and length, respectively, a is the intercept of the log(L) – log(W) regression, and b is the slope of this regression. To investigate whether we could fit a regression line common to all the cohorts (and therefore consider a species-specific growth), we first performed an analyses of covariance with log(W) as the dependent variable and log(L) as an independent variable and “cohort” as a fixed effect. Since all our fish were cap- tured at the glass eel stage in the mouth of the Adour River, we expected Kn to provide an estimate of individ- ual condition after the transatlantic migration. This esti- mate is referred to as “condition index at arrival”.
Genetic diversity, structure, and matrilines All samples were sequenced for the forward and the reverse side of the mitochondrial NADH dehydrogenase 5 (ND5) gene following (Baltazar-Soares et al. 2014). Chro- matographs were checked and sequences were assembled and aligned in Codon Code Aligner (v.3.7.1, Codon Code Corporation, Centerville, MA, USA). A total of 355 base pairs of 100% quality (verified by sequencing both direc- tions) was obtained and used for further analyses. In addi- tion, five sequences of American eels (Anguilla rostrata), the sister species of the European eel, were added from a previous study (Baltazar-Soares et al. 2014). Haplotype
diversity (Hd) and nucleotide diversity (p) were calculated for each cohort in DnaSP v5 (Librado and Rozas 2009). To infer genetic structure, a test of pairwise comparisons of haplotype frequencies amongst cohorts was performed using Arlequin v3.5 (10,000 permutations) (Excoffier and Lischer 2009).
We then compared a panmictic mode of evolution with an alternative scenario. To this end, we used mtDNA matrilines as a proxy signature for philopatric spawning groups, as it is observed amongst animals that follow this strategy. We followed (Baltazar-Soares et al. 2014) that suggested mtDNA matrilines to reflect female philopatry within the Sargasso Sea. We thus created a mtDNA hap- lotype list in DnaSP v5 and constructed a network using NETWORK v4.6.1.2 (Bandelt et al. 1999). Five sequences of American eels (A. rostrata), the sister species of the European eel were used to provide a visual calibration of intraspecific diversity (Baltazar-Soares et al. 2014). We calculated a median joining network with the following parameters: frequency criteria inactive, epsilon of 35, and transversions weighted eight times more heavily than transitions, as suggested by analyses of transition/transver- sions bias performed in Mega v5 (Tamura et al. 2011).
Lastly, the network was subjected to a maximum parsi- mony optimal post-processing (Polzin and Daneshmand 2003). Connection ambiguities, common in complex and large data sets such as ours (Bandelt et al. 1999), were solved by parsimonious choice of the most frequent con- nections observed amongst all shortest trees produced by the optimal post-processing step. Individuals were then grouped into three matrilines (A, B, and C) with respect to their network location and connection to the three most frequent haplotypes. That grouping was also per- formed within each cohort, which resulted in glass eels to be distributed amongst nine groups (three main matrili- nes9three cohorts). Hereafter, we will refer to those nine groups as nine “demes”.
Construction of Bayesian skylines for each matriline
The use of Bayesian statistics (Drummond et al. 2005) and coalescent theory (Kingman 1982) allowed the recon- struction of each matriline’s demographic pattern. Demo- graphic history of each matriline was investigated through Bayesian skyline plots (BSP) in BEAST v.1.8 (Drummond and Rambaut 2007). We first estimated the required parameters to run the Bayesian analyses, that is the sub- stitution model, mutation rate and clock model. The sub- stitution model was estimated in jModelTest on the entire dataset (N= 403) (Darriba et al. 2012). The intraspecific mutation rate and clock model were estimated using five A. rostrata sequences as an outgroup. For this purpose,
we used the tree prior “calibrated Yule mode” (Gernhard 2008) as suggested by the authors when considering sequences from different species (Heled and Drummond 2012). We enforced monophyly of all A. anguilla to con- strain the tree topology during the course of the Markov Chain sampling (Heled and Drummond 2012). The initial tree root height was set at 5.8 9106years (standard devi- ation=0.5 million years), in line with estimates of most recent common ancestor (TMRCA) of both species reported by (Minegishi et al. 2005) in the most compre- hensive phylogenetic analyses of the genus Anguilla (Minegishi et al. 2005).
With the substitution model, mutation rate and respec- tive clock model, as well as the initial tree height, we pro- ceeded with the construction of the BSP. BSP were constructed independently for each matriline. The tree prior for these analyses was set to “coalescent: Bayesian skyline” (Drummond et al. 2005). Markov chains were set to 1 9108 in all the above mentioned analyses. Con- vergence, that is effective sample size (ESS) >200 and dis- tribution of posterior’s marginal likelihood was inspected in Tracer v1.6 (Rambaut et al. 2014).
Genetic footprints of gene flow amongst hypothetical philopatric demes: insights from nuclear DNA
Validation of microsatellite data: null alleles, linkage, and selective neutrality
In addition to theND5, all samples were screened for varia- tion at 22 microsatellites. The amplification was performed in four PCR multiplexes of four to six microsatellite loci developed for the European eel (Wielgoss et al. 2008; Pujo- lar et al. 2009b; Als et al. 2011) following the protocol described in Text S1. Reactions were performed in a total volume of 10 lL and followed the QIAGEN© Multiplex (Hilden, Germany) PCR kit’s recommendations. Genotyp- ing was performed on an ABI© 3100 Genetic Analyzer.
Alleles were called in GENEMARKER©v. 1.91 (Softgenetics LLC, State College, PA). We controlled the quality of microsatellite data by estimating the frequency of null alleles through maximum likelihood estimates of gene frequency [Dempster’s EM method (Dempster et al.
1977)] and inferring linkage of alleles between pairs of loci.
Those analyses were done in GENEPOP (Rousset 2008) and GENETIX (Belkir et al. 1999) respectively.
To validate the use of the 22 nuclear markers for popu- lation genetic purposes, we inferred their selective neutral- ity by exploring the distribution of the FST/expected heterozygosity ratio expected to occur in an island model and assuming neutral evolution (Antao et al. 2008). These calculations were performed in LOSITAN (Beaumont and
Nichols 1996; Antao et al. 2008). The confidence intervals were calculated with 100,000 permutations and after forced calculation of a meanFST, as suggested to improve robustness (Antao et al. 2008). Simulations were per- formed assuming both an infinite allele and a stepwise mutation model. We considered pairwise comparisons between matrilines and pairwise comparisons between demes, to infer if hypothetically non-neutral evolving loci would be linked to (1) mtDNA variation and (2) mtDNA variation within cohorts respectively. Lastly, to test for correlation between mitochondrial and nuclear loci, we performed a mantel test with theFSTvalues obtained with both type of markers using the “ape” function in R.
Genetic diversity, contemporary demography, and structure
To obtain estimates of genetic diversity, we calculated the observed heterozygosity (He), inbreeding coefficient (FIS), and rarefied allelic richness (Ar) in GENETIX (1000 boot- strap), (Belkir et al. 1999) and HP-RARE v1.0 (Kali- nowski 2005), respectively, for each deme within a cohort. We also investigated if the recent decline in popu- lation abundance had left a genetic signature of decreased diversity in the different demes. For that, we used BOT- TLENECK (Cornuet and Luikart 1996), which relies on methods sensitive to recent and severe reduction of effec- tive population size (Ne) (Cornuet and Luikart 1996). A two-phase mutation model was assumed with 10% of the loci allowed to evolve through stepwise mutations with variance of 10% (Kimura and Ohta 1978).
To evaluate and compare the magnitude of genetic dif- ferentiation between nuclear and mitochondrial markers, we calculated the FST amongst cohorts in Arlequin v3.5 (10,000 permutations). We also investigated the distribu- tion of molecular variance amongst the possible nine demes (three cohorts and three matrilines): to this end we performed an AMOVA with “cohort” as higher hierar- chical group (Arlequin, 10,000 permutations). Then, we used STRUCTURE v2.3.3. to infer the likelihood of popu- lation structure, that is incomplete admixture, without a- priori knowledge of cohort or matriline (Pritchard et al.
2000). STRUCTURE’s running period consisted of 100,000 MCMC after a burn-period of 10,000 chains. We used an admixture model where a (the degree of admix- ture) was inferred from a uniform prior, with initial a= 1, max= 10.0 and standard deviation=0.025. The frequency model was set to correlated allele frequencies amongst populations. The number of subpopulations (K) was set to 9. K =9 is the maximum number of demes that can be expected from a spatial and temporal combination of three matrilines and three cohorts. Five iterations were run for each K. The most likely number
of subpopulations present in the dataset was assessed through two methods: (1) calculation of Evanno’s DK (DK=mean(|L″(K)|)/SD(L(K)) (Evanno et al. 2005) in STRUCTURE HARVESTER (Earl 2012) and (2) visual inspection of admixture plot produced by STRUCTURE.
Estimates of directionality and migration rates amongst demes
One of the primary goals of this study was to investigate gene flow amongst putative female philopatric reproduc- tive units represented by different matrilines. By grouping the samples by female matrilines, gene flow measured with nuclear markers would primarily be the product of male migration. Here, using Bayesian inference methods imple- mented in MIGRATE-n v.3.6.4 (Bertorelle et al. 2009), we compared the likelihood of a panmictic scenario against the hypothetical female-driven structure. For this, we cre- ated two population models. In the first model (model I), the three matrilines were considered to be part of a single panmictic population, while in model II–island model– each matriline was regarded as segregated reproductive unit allowing for bi-directional gene flow, that is possibil- ity of emigration and immigration to exist. These scenarios were simulated independently for each cohort.
Three replicates were performed for each scenario, and the most likely model was identified by comparing the average marginal likelihoods of each model (Mlog) (Beerli and Palczewski 2010). The effective number of migrants (Nem) was calculated following Nem= (Μj?i*hI)/4. The priors of the parametersh andΜwere the same for both models which allowed the direct comparison of marginal likelihoods. We used an uniform prior of h ranging between 0 and 200, with mean=200 and delta= 20, after improving over other posterior probability distribu- tions. The uniform prior forΜ remained as default, that is ranged between 0 (minimum) and 1000 (maximum), with delta=100. The running parameters included a long chain of 5000 recorded steps, with an increment every step of 100 over three identical replicates. A total of 1,500,000 parameters were visited. This methodology allows for the calculation of the harmonic mean of mar- ginal log likelihoods (Raftery 1996).
Individual-based genetic indices and relationship with migration rates
At the individual level, we calculated the internal related- ness (IR) and the homozygosity byloci (HL) indices in R version 2.13.2 (Fox 2005) using the Rhh package (Alho et al. 2010). IR compares parental half genotypes within an individual. It ranges from1 (outbred) to 1 (inbred), where 0 is the score of individuals born from the random
pairing of unrelated parents (Amos et al. 2001). HL is a homozygosity index that extends IR by considering the contribution of each locus, rather than each allele, while estimating allele frequencies (Aparicio et al. 2006). Such difference between both indices might be particularly informative in the presence of migration amongst repro- ductive units (Aparicio et al. 2006). For instance, since IR weights the contribution of alleles based on their fre- quency, homozygous individuals carrying rare alleles (brought in the population through migration) are attrib- uted higher IR index than those homozygous individuals carrying more common alleles (Aparicio et al. 2006).
Those differences stand out when comparing the strengths of correlation of IR and HL with a population-based inbreeding coefficient, such as the FIS. Under asymmetric migration, this would translate in a lower correlation coefficient (r) between mean IR and FIS in comparison with the correlation coefficient obtained for HL and FIS. Such a result would suggest that rare or low frequency alleles are transported between demes through migration.
Hereafter we will refer to the correlation coefficients r (mean IR, FIS) and r(mean HL, FIS) as RIR and RHL respectively. Lastly, IR and HL were calculated indepen- dently for each deme, ensuring that those metrics were weighed by the allelic frequencies of the deme alone and not of the whole data set.
Heterozygote-fitness correlations
To verify if individual fitness could be explained by matriline or cohort, relationships between individual con- dition index at arrival (Kn)–measure of relative fitness– and individual genetic indices (HL and IR) were analyzed using linear models, with “matrilines” nested into “co- hort”. To avoid confounding effects of HL and IR on the linear model, we calculated the residuals of their correla- tion and used those residuals as independent variable in the linear model. All statistical analyzes were performed in R 2.13.2 (Fox 2005).
Results
Variation in length (L), weight (W) and condition index (Kn) amongst cohorts
Although sampled within the same week and the same loca- tion (River Adour, France) every year for three consecutive years, the mean fish length upon arrival at the European coasts significantly varied (ANOVAcohorts, F2,401=85.83, P<0.001, L2010=66.59 3.49 mm, L2012=71.60 3.55). Mean fish weight also significantly varied and ranged from 0.230.04 g in the 2010 cohort to 0.330.05 g in the 2012 cohort (ANOVAcohorts,F2,401=184.50,P< 0.001).
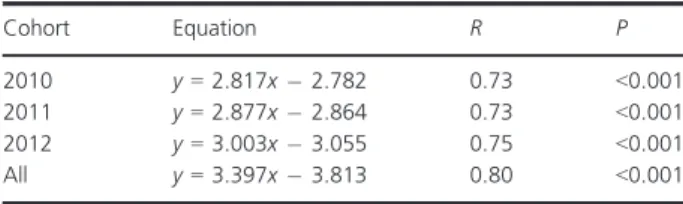
The analysis of co-variance supported the use of a single regression line to calculate the condition index (Kn) of all individuals (Table 1 and 2). The comparisons of the condi- tion index among cohorts revealed statistically significant differences in Kn, with higher Kn in the most recent cohort (Fig. 1, ANOVAcohorts, F2 =48.22, P<0.001; Post-hoc tests:t2010–2011=4.065;t2010–2012=9.817;t2011–2012=5.320, allP<0.001).
Evolution and demographic history of the matrilineages
Genetic diversity, differentiation and haplotype network
Amongst cohorts, the haplotype diversity of ND5 ranged between 0.818 (2010) and 0.861 (2011) while the nucleo- tide diversity (p) varied from 0.004 (2010) to 0.005 (2012) (Table 3). PairwiseFSTcomparisons did not reveal evidence of population structure based on mtDNA amongst cohorts, suggesting a stable pattern over the course of this study (highest FST 2010 vs. 2011=0.0002, P= 0.36). All sequences can be found in Appendix S1.
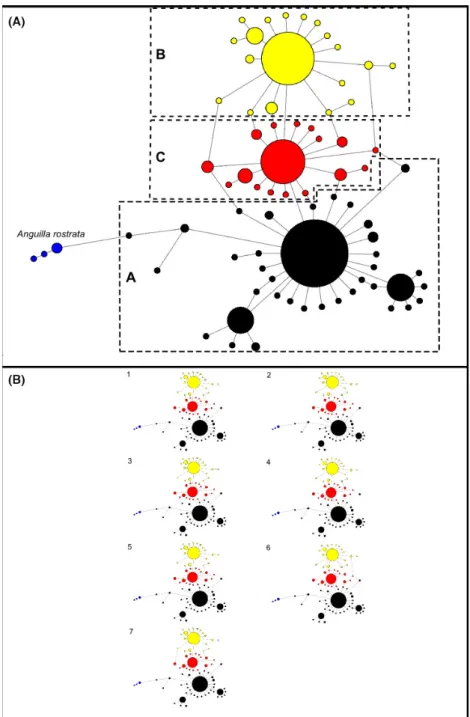
Reconstructing the ND5 haplotype network revealed the existence of three major haplotypes and 68 satellite haplotypes, a structure similar to that of (Baltazar-Soares et al. 2014; Fig. 2). Forty-eight randomly picked single- tons were verified by independent extraction, amplifica- tion and re-sequencing to eliminate possible risks of sequencing errors. The three main haplotypes diverged from each other by one and two base pairs respectively.
Noteworthy, this is to be compared with five ND5 sequences of American eels which diverged from one European eel haplotype by as little as five base pairs (Fig. 2). The parsimonious resolution of connection ambiguities allowed us to delimitate three matrilines (see Fig. 2 and Fig. S1 for detailed information on the net- work). Each matriline consists of the main haplotype and respective satellites that directly connect to it. We named those matrilines “A”, “B” and “C” (Fig. 2). Matriline A was consistently observed as the most represented matri- line accounting for 46–54% of the total number of indi- viduals within cohorts (B ~30%, C~20%).
Estimates of mutation rate, substitution model and demographic history of matrilines
Clock rate estimates based on the divergence time between A. anguilla and A. rostrata resulted in a mean mutation rate of 0.946 9105 subs/site/million year (standard deviation=0.1969105). The substitution model HKY +I+G was selected amongst 24 others through Akaike information criteria (AIC) in jModeltest (AICc 1668.651, DAICc= 0) (Darriba et al. 2012). For the construction of the Bayesian skylines, we adopted the HKY+I+ G substitution model. Also, the mean muta- tion rate was inserted as a uniform prior, with upper and lower boundaries representing meanstandard deviation respectively.
Bayesian skyline plots revealed different patterns amongst matriline’s demographic history: matriline A showed a steeper growth phase surrounded by two pla- teaus of constant sizes. The onset of the growth phase
Table 1. Regression equations fitted for the log(L)–log(W) relation- ship in each cohort.
Cohort Equation R P
2010 y=2.817x2.782 0.73 <0.001
2011 y=2.877x2.864 0.73 <0.001
2012 y=3.003x3.055 0.75 <0.001
All y=3.397x3.813 0.80 <0.001
Table 2. ANCOVA testing for differences in the slope of log(L)–log(W) relationship amongst cohorts.
log(W)~ t-Value P
log(L) 19.724 <0.001
Cohort 2011 0.250 0.803
Cohort 2012 0.758 0.449
Log(L):cohort 2011 0.328 0.743
Log(L):cohort 2012 0.934 0.351
2010 2011 2012
0.80.91.01.11.21.3
Average cohort Kn
Cohort
Condition index at arrival
***
***
***
Figure 1. Variation of condition index (Kn) amongst glass eel cohorts. The condition index at arrival (Kn) was calculated with the slope and intercept of the log(W)/log(L) regression equation built upon the allometric growth of all specimens; ***represents pairwise relationships with P<0.001. The line at 1.0 represents the mean condition index, following (Le Cren 1951).
Table 3. Genetic diversity indices and condition index of each cohort.
Cohort n
Mitochondrial DNA Microsatellites
nHap S Hd p He Ar FIS Kn
2010 155 31 30 0.818 0.004 0.734 14.52 0.159 0.944 (0.091)
2011 127 34 31 0.861 0.005 0.747 15.21 0.165 0.993 (0.114)
2012 121 34 35 0.851 0.005 0.748 15.40 0.166 1.061 (0.089)
n=number of individual analyzed. Mitochondrial data from a 355 base-pair fragment of the ND5:nHap=number of haplotypes,S=segrega- tion sites, p=nucleotide diversity; Microsatellite data from 22loci: He, heterozygosity; Ar, rarefied allelic richness;FIS, inbreeding coefficient;
Phenotypic data Kn, condition index. Values in brackets represent standard deviation.
Figure 2. Main haplotype network and all shortest networks obtained through maximum parsimony. Panel (A) Network obtained with maximum parsimony approach already containing all possible trees. Letters correspond to matrilineages. The matrilines A, B and C are represented by colors black, yellow and red respectively. Blue representsAnguilla rostrata sequences added as an outgroup to provide a visual scale for differentiation. Mutation steps, median vectors and frequency of each haplotype can be consulted in Fig S1. Panel (B) All the seven possible shortest trees identified through maximum parsimony. The assignment of satellite haplotypes to respective matriline, that is A (black), B (yellow) and C (red), was performed through maximum parsimony analyses (Bandelt et al. 1999).
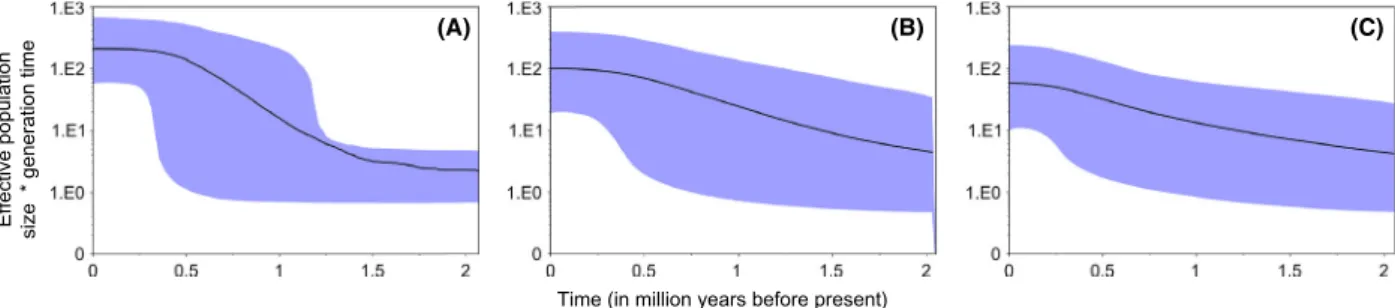
occurred ~1.5 million years ago (mya) and ended
~0.5 mya. This pattern contrasted with the single phase of constant growth that was observed in the demographic plots of matrilines B and C that extends throughout the historical timeline investigated (Fig. 3). Differences amongst demographic scenarios are also explicit in the distributions of the marginal probabilities of the run of each matriline, where each explored a different demo- graphic space (Fig. S2). Noteworthy, all Markov chains reached convergence: the posterior’s ESS was always above 200 (matriline A= 219; matriline B=456; matri- line C= 1249), with respective distributions of marginal likelihood probabilities proven to be unimodal (Fig. S2).
Validation of microsatellite data: null alleles and selective neutrality
None of the 22 loci revealed a frequency of null alleles above the 20% threshold that is assumed to influence population differentiation estimates (Chapuis and Estoup 2007) (Table S1) – as estimated by Dempster’s EM method (Dempster et al. 1977). Similarly, no alleles were fixed amongst loci. Selection tests also revealed that none of the 22 microsatellites loci deviated from a neu- tral mode of evolution (Fig. S3). This was true either when pairwise comparisons were performed between matrilines or amongst demes (Table S2). In addition, there was no correlation between mtDNA and microsatellite FST (Mantel test, z=0.038, P=0.583).
Consequently, all 22 microsatellite loci were kept for fur- ther analyses.
Nuclear genetic diversities, contemporary demography and structure
When investigating cohort-based indices of genetic diver- sity, that is allelic richness (Ar), Nei’s unbiased heterozy- gosity (He) and FIS, we found that only the allelic richness Ar significantly differed amongst cohorts (ANO- VAAr: F2= 7.01,P= 0.03) with the 2012 cohort showing
the highest level (mean Ar2010= 9.780, SD=0.130; mean Ar2011= 10.073, SD=0.161; mean Ar2012=10.117, SD =0.005). Neither He nor FIS significantly varied amongst cohorts (ANOVAHe: F2= 2.864, P=0.134;
ANOVAFis: F2=0.107, P=0.9). Focusing on matrilines, there were no differences observed for any of the tested indices (ANOVAAr: F2= 0.45, P=0.66; ANOVAHe: F2=1.56, P=0.29; ANOVAFIS: F2=0.40, P=0.68, Table 3 and Appendix S2). In relation to the individual- based diversity indices (HL, IR), we found no differences amongst cohorts, amongst matrilines or amongst demes (ANOVAHL: cohorts F2= 0.049, P=0.953; matrilines F2=0.315, P=0.730; demes F8=12.340, P=0.296;
ANOVAIR: cohorts F2=0.001, P= 0.996; matrilines F2=0.288, P=0.750; demes F8 =10.219, P=0.396) (Table 4). BOTTLENECK tests revealed neither the occur- rence of a mode shift in allele frequencies nor an excess of heterozygotes – the typical genetic signatures expected after a severe declines in population size (Table S3).
Pairwise FST comparisons showed low but statistically significant differentiation amongst cohorts after correction for false-discovery rate (Narum 2006) (FST 2010/2011=0.002, P=0.02). Similarly, when focusing on demes, four pairwise comparisons showed a P-value lower than 0.05 and one remained statistically significant after correction for multiple testing (FST 2010A/
2011B=0.005,P=0.01, Table S4). The AMOVA consider- ing “cohort” as the higher hierarchical group showed no statistical support (FCT =0.001,P=0.28).
Calculations of Evanno’s DK (Evanno et al. 2005), and admixture plots in STRUCTURE revealed no clustering, as expected under the low FST observed (Table S5, Figs. S4 and S5).
Comparing models: assessing the likelihood of structure and directionality of gene flow To infer the likelihood of the matrilines to represent sub- samples of a panmictic population, in contrast with the alternative hypothesis where each matriline would corre-
Time (in million years before present) Effective population size * generation time
(A) (B) (C)
Figure 3. Matrilines demographic history. Bayesian skyline plots were constructed independently for each matriline. Here thex-axis represents
“time” and is defined in million years (my).Y-axis represents the femaleNemultiplied by generation time. The black line represents the median Neand the shades the 95% high probability density interval.
spond to a reproductively isolated unit, we fitted our data into two population models and statistically tested which one would explain our data better.
Average of the marginal log likelihoods of each model were calculated and compared to identify the most likely scenario (Beerli and Felsenstein 1999). Results showed that the model simulating a structured ground (model II) was favored over the model simulating a panmictic population (model IMLog=5400.113; model IIMLog=3740.630, Bayes factor (model IIMlogmodel IMlog) =1659.483). Furthermore, results revealed the existence of asymmetric migration amongst matrilines.
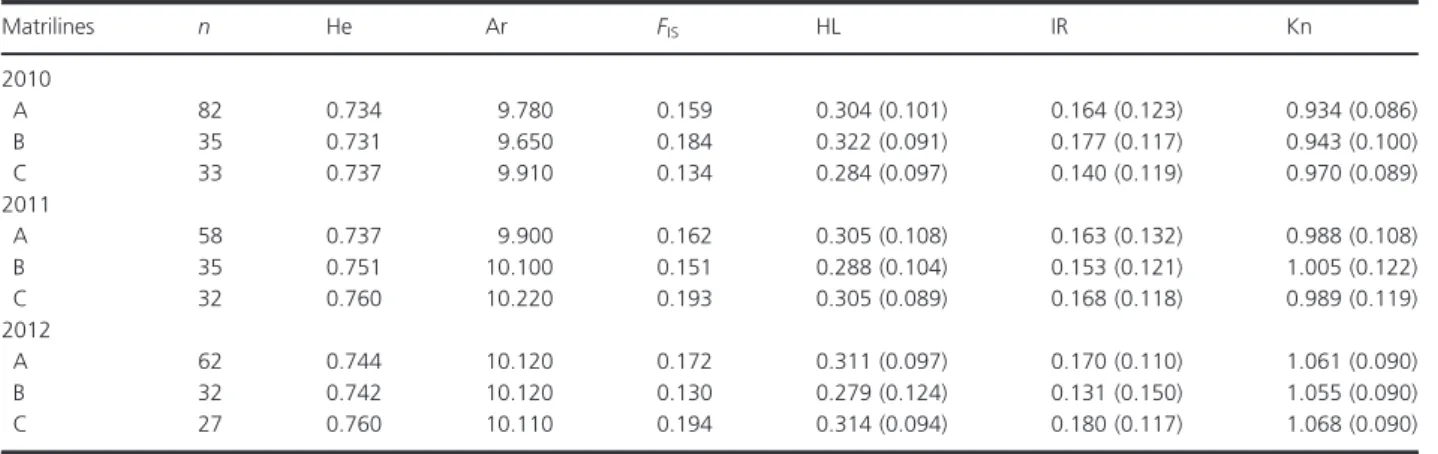
In particular, matriline A always acted as source for the others matrilines. This was clearly evident in the cohort of 2010, where emigration ranged between 10 and 12 Nem, while immigration was reduced to <1 Nem. In addition, for the 2012 cohort, emigration from deme A to deme C was the highest observed in this study, 21 Nem, and contrasted with the immigration of <1 Nem
(Table 5 and Fig. 4). Modes and confidence intervals of h and Nem within each cohort can be found in Tables
S6–S8. Posterior distributions of migration parameters are available in Figure S6.
Impacts of gene flow on the genetic diversity of matrilines
Differences between correlation coefficients RIR (correla- tion coefficient between mean IR andFIS) and RHL (cor- relation coefficient between mean HL and FIS) are particularly informative in the presence of migration:
under asymmetric gene flow amongst demes, one would expectRHL>RIRif immigration would bring new or low frequency alleles to the receiving demes. Here, we detected a coefficientRIRof 0.93 (P<0.001) and a coeffi- cient RHL of 0.88 (P=0.002). The incorporation of HL and IR as independent explanatory variables in a linear model confirmed that IR explains a higher proportion of FIS than HL (tIR =2.380, P= 0.06; tHL= 0.543, P=0.61).
Table 5. Mutation scaled effective population sizes (h) and effective number of migrants (Nem) of model II.
2010 2011 2012
hA 0.067 2.600 0.067
hB 2.067 2.067 0.067
hC 2.467 4.600 4.200
NemB?A 0.325 14.084 0.295
NemC?A 0.318 12.350 0.328
NemA?B 10.161 11.195 0.295
NemC?B 8.095 8.738 0.195
NemA?C 11.716 21.850 20.650
NemB?C 9.661 19.550 12.250
Nemwas calculated throughNem=(Μj?i*hI)/4 for each deme.
Table 4. Genetic diversity and condition index for each matriline within the cohorts.
Matrilines n He Ar FIS HL IR Kn
2010
A 82 0.734 9.780 0.159 0.304 (0.101) 0.164 (0.123) 0.934 (0.086)
B 35 0.731 9.650 0.184 0.322 (0.091) 0.177 (0.117) 0.943 (0.100)
C 33 0.737 9.910 0.134 0.284 (0.097) 0.140 (0.119) 0.970 (0.089)
2011
A 58 0.737 9.900 0.162 0.305 (0.108) 0.163 (0.132) 0.988 (0.108)
B 35 0.751 10.100 0.151 0.288 (0.104) 0.153 (0.121) 1.005 (0.122)
C 32 0.760 10.220 0.193 0.305 (0.089) 0.168 (0.118) 0.989 (0.119)
2012
A 62 0.744 10.120 0.172 0.311 (0.097) 0.170 (0.110) 1.061 (0.090)
B 32 0.742 10.120 0.130 0.279 (0.124) 0.131 (0.150) 1.055 (0.090)
C 27 0.760 10.110 0.194 0.314 (0.094) 0.180 (0.117) 1.068 (0.090)
n=number of individuals analyzed, Microsatellite data from the 22loci: He, heterozygosity; Ar, rarefied allelic richness;FIS, inbreeding coefficient;
HL, homozygosity per loci; IR, internal relatedness; Phenotypic data from morphological measurements: Kn, condition index. Values in brackets represent standard deviation.
0-7 8-14 >15
A
B C
2010
A
B C
2011
A
B C
2012
Figure 4. Effective number of migrants (Nem) amongst demes in each cohort. Visual depiction of migration rates, or effective number of migrants (Nem), estimated from the island model with bi-directional gene flow simulated for each cohort. The arrows represent the flux, in terms ofNem, and direction of migration. The categories ofNemare expressed in terms of thickness. Nem was calculated through Nem=(Μj?i*hI)/4.
Heterozygosity-fitness correlations
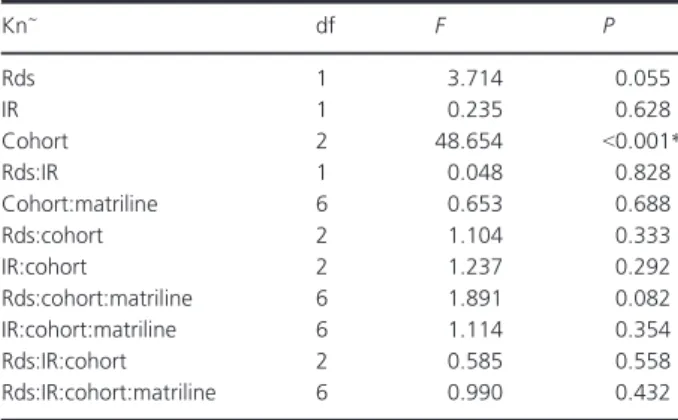
To explore potential drivers of the variations in condition index (Kn) observed amongst cohorts or amongst demes we fitted a linear model where we included potential effects of mitochondrial lineage (mtDNA) and individual diversity indices such as HL and IR. We found that Kn varied only amongst cohorts (F2= 48,654,P<0.001, Table 6).
Discussion
Due the many challenges associated with research expedi- tions, understanding the biology and evolution of the European eel still strongly relies on indirect genetic evi- dence. In this study, we undertook the task of comparing the genetic signature of a homogenous spawning ground, where reproduction would be panmictic, with the signa- ture of a hypothetical matriline-driven structured spawn- ing ground.
To do so, we screened for the occurrence of the three major haplotypes groups investigated in a previous study across three consecutive cohorts of glass eels (Baltazar- Soares et al. 2014). The underlying goal was to provide theoretical explanation to the previously observed struc- ture on the European coasts. To this end, we grouped individuals according to their matrilines and then used nuclear markers to evaluate possible gene flow. The com- parison of the models representing panmixia and a struc- tured population linked to matrilines revealed better support for the data to be explained by female segregated spawning units. Surprisingly, inferences of gene flow amongst matrilines revealed that migration is asymmetric, inconsistent with a panmictic mode of reproduction. Our study thus points towards the existence of female- mediated reproductive units, which we speculate its detec- tion to be a consequence of a fragmented spawning
ground due to the lasting low recruitment that this spe- cies is experiencing.
Definition, historical demography and contemporary structure of matrilines
By constructing a haplotype network based on the ND5 mitochondrial gene, we confirmed the existence of a stable haplotype network structure, dominated by three major haplotypes separated by 1–2 base pairs. As these differences are in line with site-specific haplotype differ- ences in philopatric species (Keeney et al. 2005; Levin and Parker 2012), we grouped our samples accordingly and assumed it to represent female-mediated reproductive units. Upon their definition, we investigated the demo- graphic history of each matriline. This scenario is concep- tually plausible as the recruitment collapse that the European eel has undergone may have fragmented its spawning ground isolating reproductive demes, as is often the case with declining population size (Yamamoto et al.
2004; Hastings and Botsford 2006).
Skyline plots suggest that all matrilineages are likely experiencing an historical growth phase yet with contrast- ing shapes: the most common matriline A displays a stee- per and more pronounced expansion compared to the two others. This expansion has started ~1.25 mya and lasted for ~1 my, and can be justified by several hypothe- ses. First, it may relate to a major geological event match- ing a high velocity phase of the Gulf Stream’s western boundary current (Kaneps 1979). This is a possible expla- nation given the key role of this major current in the contemporary dynamics of the European eel population (Bonhommeau et al. 2009; Blanke et al. 2012). Second, it may be a gene-specific signature. Screening the full mito- genome (Jacobsen et al. 2014a) found a past decline and recovery of the eel population. Mitogenome analyses pro- vide robust inference of the historical demography with higher resolution than a single gene. Furthermore, simula- tions performed by (Grant et al. 2014) suggested that Bayesian skylines applied to a single mitochondrial gene may only capture the most recent event of a population expansion. Thus, our ND5-based skyline plots might only be capturing the recent expansion detected by (Jacobsen et al. 2014a). However, like previous studies (Pujolar et al. 2011; Jacobsen et al. 2014a), we did not capture the signature of a recent decline.
Measures of gene flow: insights into the structure and dynamics of the European eel population
The definition of matrilines allowed us to test for the sta- tistical robustness of a panmictic mode of reproduction
Table 6. Effects of possible explanatory variables to condition index variation.
Kn~ df F P
Rds 1 3.714 0.055
IR 1 0.235 0.628
Cohort 2 48.654 <0.001*
Rds:IR 1 0.048 0.828
Cohort:matriline 6 0.653 0.688
Rds:cohort 2 1.104 0.333
IR:cohort 2 1.237 0.292
Rds:cohort:matriline 6 1.891 0.082
IR:cohort:matriline 6 1.114 0.354
Rds:IR:cohort 2 0.585 0.558
Rds:IR:cohort:matriline 6 0.990 0.432
Rds, residuals of the correlation of HL and IR; mtDNA, matriline;
*represents a significant effect.
versus segregated units of matrilines based on gene flow estimated with 22 microsatellites. We used Bayesian statis- tics coupled with coalescent theory, a framework that is becoming increasingly acknowledged as an ideal inferen- tial approach to test connectivity amongst putative popu- lations (Beerli and Palczewski 2010). Quite surprisingly, results support the hypothesis that genetic diversity is best explained by a structured spawning ground rather than a panmictic mode of reproduction (Bayes factor: model IIMlogmodel IMlog= 1659.483). We are fully aware that this methodology does not provide final proof regarding the true structure of a population (Beerli and Palczewski 2010). The high acceptance rate of the harmonic mean estimator in identifying panmixia (70%) in a true pan- mictic population (Beerli and Palczewski 2010) suggests, however, that panmixia is less likely to be the underlying structure observed in our samples.
Interestingly, in addition to the support for the model assuming a segregated spawning ground, we detected asymmetry of the migration rates amongst the matrilines.
Particularly, over the three sampled cohorts, the most common matriline always acted as a source of migrants for the other matrilines. While consistent asymmetries in migration rates are not predicted under panmixia (Waples and Gaggiotti 2006), they are commonly reported amongst philopatric demes in highly migratory species with sex- biased dispersal such as sperm whales (Lyrholm et al.
1999), salmonids (Fraser et al. 2004), or turtles (Stiebens et al. 2013). It is thought to reflect the contrast between opportunistic mating of one of the sexes and faithfulness to specific spawning conditions of the other. Given that we grouped samples by matriline, the asymmetries reported here should reflect male-mediated gene flow.
One critical insight is gained from these observations:
asymmetries in gene flow can generate low but significant FST amongst the putative demes (0.001<FST<0.006).
While differentiation estimates of this order of magnitude may escape the scrutiny of Bayesian clustering methods (Pearse and Crandall 2004; Anseeuw et al. 2008), it is inter- esting to note that those values and significance are extre- mely similar to those reported by (Dannewitz et al. 2005) or (Pujolar et al. 2009a) but differ in their interpretations in the light of a female-mediated structure (Baltazar-Soares et al. 2014). To exist, gene flow among female-driven reproductive units should be male-mediated. This assump- tion is coherent with the speculative life-history of male European eels, who are believed to mature before the females, consequently returning to the spawning grounds faster and thus mixing cohorts (Tesch 2003).
We uphold the suggestion that the results can be inter- preted in light of the recruitment collapse that occurred in the early 1980s. The lack of spawners associated with the collapse (Dekker 2003; Aalto et al. 2015) may have
led to a fragmentation of the spawning area in the Sar- gasso Sea creating semi-isolated reproductive demes. The detection of genetic structure due to habitat fragmenta- tion is a well described phenomenon (Monaghan et al.
2002; Yamamoto et al. 2004; Hastings and Botsford 2006). Our data suggest that under high abundance of spawners, female-mediated patterns may not be detected because of leakage at the margins of the units. However, under reduced numbers of mature fish, this structure is observed. If this structure was to be verified, it would explain why despite a drastic recruitment collapse down to<10% of historical record, no genetic signature of bot- tleneck was observed (Pujolar et al. 2011 and this study).
Indeed, male-mediated gene flow would allow the trans- port of alleles among demes at each reproductive event maintaining the genetic variability, as well as the adaptive potential currently observed in the population.
Lastly, there is also the possibility forFSTand gene flow asymmetries here reported using microsatellites to be associated with introgressive hybridization betweenA. an- guillaandA. rostrata(Pujolar et al. 2014a; Wielgoss et al.
2014). It has been shown through simulations that vari- able admixture rates, in the Sargasso Sea, can produce a latitudinal cline onFSTdifferentiation similar to a pattern of isolation by distance, across the European coast (Wiel- goss et al. 2014). We cannot discard a possible role for hybridization, despite such patterns have not been reported to low latitudes as was our sampling site.
Heterozygosity-fitness correlations: linking demography and evolution?
To infer whether different matrilines are associated with variable fitness traits, we performed heterozygosity-fitness correlations using body condition post-transatlantic migra- tion as fitness trait of interest. Assuming that female philopatry evolved to maximize successful transport of off- spring under given oceanic conditions (Baltazar-Soares et al. 2014), lineage-specific fitness would be a reasonable expectation. Variable recruitment could be related to varia- tion in condition index amongst the different matrilines, linking recruitment and lineage-specific fitness. However, we observed that “cohort” is the major effect determining condition index variation. This means that either the condi- tion index upon arrival is not directly related to matriline fitness, or, more likely that variation in the condition index is linked to ocean-mediated recruitment success (Friedland et al. 2007; Bonhommeau et al. 2008; Kettle et al. 2008;
Melia et al. 2013; Baltazar-Soares et al. 2014). For example, if ocean currents promote a faster transatlantic migration of the 2012 cohort (in comparison with 2010) those individu- als would have consumed less internal nutritional reserves and therefore achieved higher condition index at arrival.
Conclusions
Because direct sampling of adult spawners in the Sargasso Sea is a challenge yet to be overcome, to understand the evolution of the European eel, new theories have to be proposed and tested. Here, we built on previous mod- elling work which suggested that a female structured spawning ground could explain the punctual reports of genetic structure in a population otherwise considered panmictic. Artificially creating those female philopatric groups and testing for the population signature against panmixia suggested that multiple (in time or space) spawning grounds may exist.
Rather than bringing conclusive evidence for the exis- tence of a structured European eel spawning ground, the work we here present aimed at opening avenues of research on the much challenging theme of eel population genetics. We are greatly aware of the limits of the study, which primarily relies on strong assumptions associated with the definition of matrilines. Further studies challeng- ing the understanding of the mode of evolution of this enigmatic species could, for instance, expand the scope using complete mitogenome or genome-wide markers (Jacobsen et al. 2014b; Pujolar et al. 2014b) to hypothe- size variable scenarios and test for their possible existence.
Acknowledgments
The authors wish to thank J. Duhart for the samples; M.
Heckwolf and P. Roedler for help in processing glass eel samples. M.B.-S. is funded by the International Max Planck Research School for Evolutionary Biology. CE is partly supported by Deutsche Forschungsgemeinschaft grants (EI 841/4-1 and EI 841/6-1). The authors would also like to thank the Fisheries Society of the British Isles for their support.
Conflict of Interest
None declared.
References
Aalto, E., F. Capoccioni, J. T. Mas, M. Schiavina, C. Leone, G.
De Leo, et al. 2016. Quantifying 60 years of declining European eel (Anguilla anguillaL., 1758) fishery yields in Mediterranean coastal lagoons. ICES J. Mar. Sci. 73:101– 110.
Alho, J. S., K. Valimaki, and J. Merila. 2010. Rhh: an R extension for estimating multilocus heterozygosity and heterozygosity–heterozygosity correlation. Mol. Ecol. Resour.
10:720–722.
Als, T. D., M. M. Hansen, G. E. Maes, M. Castonguay, L.
Riemann, K. Aarestrup, et al. 2011. All roads lead to home:
panmixia of European eel in the Sargasso Sea. Mol. Ecol.
20:1333–1346.
Amos, W., J. W. Wilmer, K. Fullard, T. Burg, J. Croxall, D.
Bloch, et al. 2001. The influence of parental relatedness on reproductive success. Proc. R. Soc. Lond. B Biol. Sci.
268:2021–2027.
Anseeuw, D., G. E. Maes, P. Busselen, D. Knapen, J. Snoeks, and E. Verheyen 2008. Subtle population structure and male-biased dispersal in two Copadichromis species (Teleostei, Cichlidae) from Lake Malawi, East Africa.
Hydrobiologia 615:69–79.
Antao, T., A. Lopes, R. J. Lopes, A. Beja-Pereira, and G.
Luikart. 2008. LOSITAN: a workbench to detect molecular adaptation based on a Fst-outlier method. BMC
Bioinformatics 9:323.
Aparicio, J., J. Ortego, and P. Cordero. 2006. What should we weigh to estimate heterozygosity, alleles or loci? Mol. Ecol.
15:4659–4665.
Astrom, M., and W. Dekker. 2007. When will the eel recover? A full life-cycle model. ICES J. Mar. Sci. 64:1491– 1498.
Avise, J. C., G. S. Helfman, N. C. Saunders, and L. S. Hales.
1986. Mitochondrial DNA differentiation in North Atlantic eels: population genetic consequences of an unusual life history pattern. Proc. Natl Acad. Sci. 83:4350–4354.
Baltazar-Soares, M., A. Biastoch, C. Harrod, R. Hanel, L.
Marohn, and E. Prigge, et al. 2014. Recruitment collapse and population structure of the European eel shaped by local ocean current dynamics. Curr. Biol. 24:104–108.
Bandelt, H. J., P. Forster, and A. Rohl. 1999. Median-joining networks for inferring intraspecific phylogenies. Mol. Biol.
Evol. 16:37–48.
Beaumont, M. A., and R. A. Nichols. 1996. Evaluating loci for use in the genetic analysis of population structure. Proc. R.
Soc. Lond. B Biol. Sci. 263:1619–1626.
Beerli, P., and J. Felsenstein. 1999. Maximum-likelihood estimation of migration rates and effective population numbers in two populations using a coalescent approach.
Genetics 152:763–773.
Beerli, P., and M. Palczewski. 2010. Unified framework to evaluate panmixia and migration direction among multiple sampling locations. Genetics 185:313–326.
Belkir, K., P. Borsa, J. Goudet, L. Chikhi, and F. Bonhomme, 1999. Genetix, logiciel sous Windows TM pour la genetique des populations. Laboratoire Genome et Populations UdM, Montpellier, France.
Berg, L. M., M. Lascoux, and P. Pamilo. 1998. The infinite island model with sex-differentiated gene flow. Heredity 81:63–68.
Bertorelle, G., M. W. Bruford, H. C. Hauffe, A. Rizzoli, and C.
Vernesi. 2009. Population genetics for animal conservation.
Cambridge Univ. Press, New York.
Blanke, B., S. Bonhommeau, N. Grima, and Y. Drillet. 2012.
Sensitivity of advective transfer times across the North
Atlantic Ocean to the temporal and spatial resolution of model velocity data: implication for European eel larval transport. Dyn. Atmos. Oceans 55 and 56:22–44.
Bolnick, D. I., and P. Nosil. 2007. Natural selection in populations subject to a migration load. Evolution 61:2229–
2243.
Bonhommeau, S., E. Chassot, and E. Rivot. 2008. Fluctuations in European eel (Anguilla anguilla) recruitment resulting from environmental changes in the Sargasso Sea. Fish Oceanogr. 17:32–44.
Bonhommeau, S., B. Blanke, A.-M. Treguier, et al. 2009. How fast can the European eel (Anguilla anguilla) larvae cross the Atlantic Ocean? Fish Oceanogr. 18:371–385.
Bowen, B. W., A. L. Bass, S.-M. Chow, M. Bostrom, K. A.
Bjorndal, A. B. Bolten, et al. 2004. Natal homing in juvenile loggerhead turtles (Caretta caretta). Mol. Ecol. 13:3797– 3808.
Chapuis, M.-P., and A. Estoup. 2007. Microsatellite null alleles and estimation of population differentiation. Mol. Biol.
Evol. 24:621–631.
Cornuet, J. M., and G. Luikart. 1996. Description and power analysis of two tests for detecting recent population bottlenecks from allele frequency data. Genetics 144:2001–
2014.
Dannewitz, J., G. E. Maes, L. Johansson, H. Wickstr€om, F. A.
M. Volckaert, and T. J€arvi. 2005. Panmixia in the European eel: a matter of time. Proc. R. Soc. Lond. B Biol. Sci.
272:1129–1137.
Darriba, D., G. L. Taboada, R. Doallo, and D. Posada. 2012.
jModelTest 2: more models, new heuristics and parallel computing. Nat. Methods 9:772–772.
Dekker, W. 2003. Did lack of spawners cause the collapse of the European eel,Anguilla anguilla? Fish. Manage. Ecol.
10:365–376.
Dempster, A. P., N. M. Laird, and D. B. Rubin. 1977.
Maximum likelihood from incomplete data via the EM algorithm. J. R. Stat. Soc. Ser. B Stat. Methodol. 39:1–38.
Dobson, F. S. 2013. The enduring question of sex-biased dispersal: Paul J. Greenwood’s (1980) seminal contribution.
Anim. Behav. 85:299–304.
Drummond, A. J., and A. Rambaut. 2007. BEAST: Bayesian evolutionary analysis by sampling trees. BMC Evol. Biol.
7:214.
Drummond, A. J., A. Rambaut, B. Shapiro, and O. G. Pybus.
2005. Bayesian coalescent inference of past population dynamics from molecular sequences. Mol. Biol. Evol.
22:1185–1192.
Earl, D. A. 2012. STRUCTURE HARVESTER: a website and program for visualizing STRUCTURE output and
implementing the Evanno method. Conserv. Genet. Resour.
4:359–361.
Eizaguirre, C., and M. Baltazar-Soares. 2014. Evolutionary conservation–evaluating the adaptive potential of species.
Evol. Appl. 7: 963–967.
Eizaguirre, C., T. L. Lenz, M. Kalbe, and M. Milinski. 2012.
Divergent selection on locally adapted major
histocompatibility complex immune genes experimentally proven in the field. Ecol. Lett. 15:723–731.
Evanno, G., S. Regnaut, and J. Goudet. 2005. Detecting the number of clusters of individuals using the software STRUCTURE: a simulation study. Mol. Ecol. 14:2611– 2620.
Excoffier, L., and H. E. L. Lischer. 2009. Arlequin suite ver 3.5:
a new series of programs to perform population genetics analyses under Linux and Windows. Mol. Ecol. Resour.
10:564–567.
Fox, J. 2005. The R commander: a basic-statistics graphical user interface to R. J. Stat. Softw. 14.
Frankham, R. 2005. Genetics and extinction. Biol. Conserv.
126:131–140.
Fraser, D. J., C. Lippe, and L. Bernatchez. 2004. Consequences of unequal population size, asymmetric gene flow and sex- biased dispersal on population structure in brook charr (Salvelinus fontinalis). Mol. Ecol. 13:67–80.
Friedland, K. D., M. J. Miller, and B. Knights. 2007. Oceanic changes in the Sargasso Sea and declines in recruitment of the European eel. ICES J. Mar. Sci. 64:519–530.
Froese, R. 2006. Cube law, condition factor and weight–length relationships: history, meta-analysis and recommendations.
J. Appl. Ichthyol. 22:241–253.
Gernhard, T. 2008. The conditioned reconstructed process. J.
Theor. Biol. 253:769–778.
Grant, W. S., M. Liu, T. Gao, and T. Yanagimoto. 2014.
Limits of Bayesian skyline plot analysis of mtDNA sequences to infer historical demographies in Pacific herring (and other species). Mol. Phylogenet. Evol. 65:203–212.
Harrisson, K. A., A. Pavlova, M. Telonis-Scott, and P.
Sunnucks. 2014. Using genomics to characterize
evolutionary potential for conservation of wild populations.
Evol. Appl. 7:1008–1025.
Hastings, A., and L. W. Botsford. 2006. Persistence of spatial populations depends on returning home. Proc. Natl Acad.
Sci. 103:6067–6072.
Heled, J., and A. J. Drummond. 2012. Calibrated tree priors for relaxed phylogenetics and divergence time estimation.
Syst. Biol. 61:138–149.
Hutchinson, W. F. 2008. The dangers of ignoring stock complexity in fishery management: the case of the North Sea cod. Biol. Lett. 4:693–695.
Jacobsen, M., J. M. Pujolar, M. T. P. Gilbert, J. Moreno- Mayar, L. Bernatchez, T. D. Als, et al. 2014a. Speciation and demographic history of Atlantic eels (Anguilla anguillaand A. rostrata) revealed by mitogenome sequencing. Heredity 113:432–442.
Jacobsen, M. W., J. Martin Pujolar, L. Bernatchez, K. Munch, J. Jian, Y. Niu, et al. 2014b. Genomic footprints of speciation in Atlantic eels (Anguilla anguillaandA.
rostrata). Mol. Ecol. 23:4785–4798.